Network Monitoring with Checkmk: 3 rules to rule them all
 on May 25, 2021
Monitoring networks, especially large environments, can quickly become very demanding. With the right tools, however, you can keep the effort low. Checkmk, for example, allows you to set up a comprehensive network monitoring in just a few simple steps – a monitoring which will help you to identify and rectify problems in your IT infrastructure.
In this blog article we will show you how with Checkmk 2.0, with just three rules, you can set up an efficient network monitoring that will not only monitor all of your network interfaces, but also simultaneously provide a detailed overview of all of your ports.
Why should you even monitor all of the interfaces on your network? The reason is quite simple: every port – no matter whether it is an access port, a server or firewall interface or an uplink port – can have errors and if this is the case, you should definitely pay attention to it. After all, a faulty port can always have a direct impact on the network.
All interfaces at a glance
By monitoring all network interfaces, you are able to immediately detect broken patch or installation cables, dirty fiber optics, defective firmware and configuration errors such as duplex mismatches, and ensure a high-performance network – regardless of whether it is a small infrastructure with a few hosts or a large environment with hundreds or thousands of hosts.
Depending on the size of the network, monitoring all of the ports in an environment can quickly mean needing to include thousands, if not tens of thousands or more interfaces in your monitoring. A normal interface scan is usually not sufficient for this because, for example, ports that are offline at the time of the scan will not otherwise show up in the monitoring.
It can also happen that an access port that was initially online at some point goes offline, triggering an error message – for example because the connected computer is switched off. However, since this is a normal behavior by an access port, you can avoid such error messages by ignoring changes in the status and speed of access ports.
Preparation: name the important ports
Before you start setting up your network monitoring in Checkmk, however, a little preparatory work is necessary. First, give all interfaces that are not access ports a specific name. For example, an uplink port to a switch, such as Switch01, can be renamed 'Uplink Switch01' via the switch's configuration interface. You can of course name your ports as appropriate, but it is important that your naming system is consistent and human-readable. In addition, the name should not only consist of numbers, otherwise our rules will not be effective later.
Ports do not have names by default – instead, you will usually see a list of interfaces in your monitoring environment that just consist of numbers or technical descriptions.
In this screenshot, in addition to the unnamed access ports, whose names we have left as they are, you can also see 'VIPs' (Very Important Ports) to access points, which we have named 'AP12', 'AP13' and 'AP14', among others.
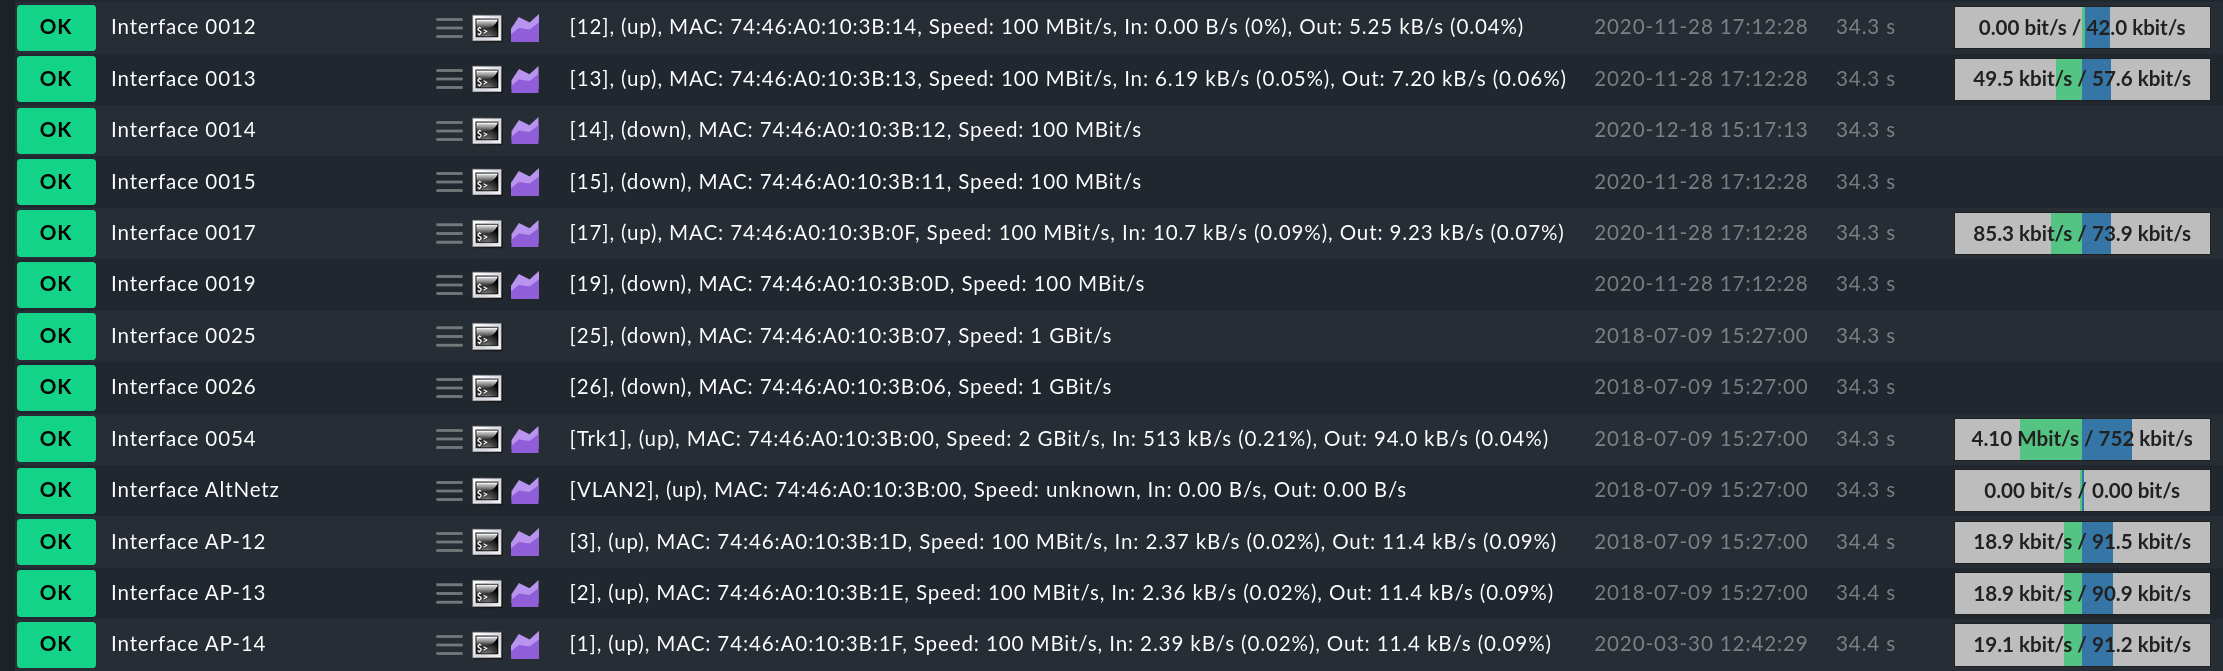
By naming important ports, we enable Checkmk to distinguish between access ports and these 'VIPs'. There is another problem, however. While some manufacturers use the SNMP table Alias for the interface names, some use the Description for this. You must be able to take this into account later in your monitoring. This problem can be easily solved in Checkmk however.
The three rules for a comprehensive network monitoring system
To solve this problem, you will first need to create two rules in Checkmk – one for the Alias table and one for the Description table. In addition, you need to create a host tag that allows you to choose between these two rules. Then create the third rule so that Checkmk ignores changes to the status and speed of access ports.
Tipping the scales with a host tag
Create a host tag under Setup ➳ Host ➳ Tag groups. There, click on Add tag group, and in the ID field enter: if_alias_desc, and in the Title: Interface: by Alias/by Description. Then add two choices by clicking twice on add tag choice. The upper tag will be the default setting. Since most manufacturers use the Alias table, use this as your default entry. To do so, assign our internal Tag ID: if_alias, and as Title: use Alias. The second choice is for assigning the use of the Description table. Therefore, set if_desc as the Tag ID, and use Description as the Title. Then save the created tag group.
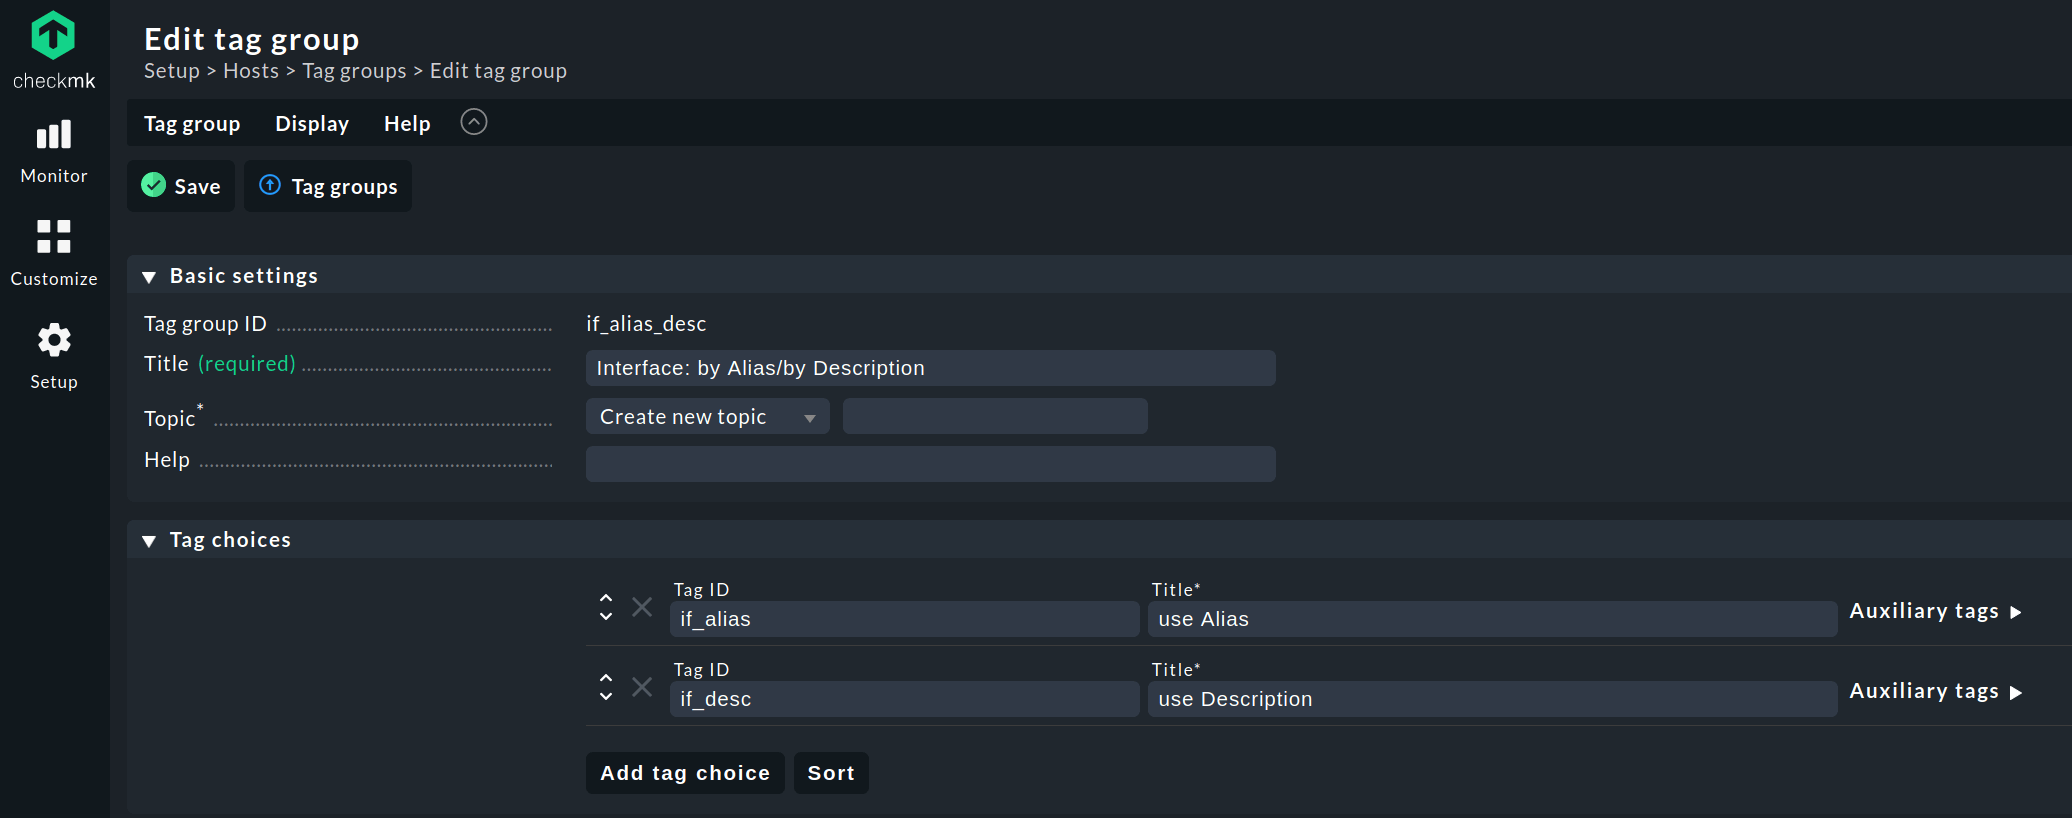
The tag group we have just created should now appear in the tag groups with the ID if_alias_desc. However, in order for the tag to be applied, you must also use it in a rule, since this is the only way for the tag we have just created to be able to influence for which hosts the rules will apply. To do this, go to the Checkmk setup menu again.
Discover all ports
In the Setup menu, use the search function to search for interface. Under Services ➳ Service Discovery rules you will find the required rule Network interface and switch port discovery. This rule influences how Checkmk discovers network interfaces. After clicking on the rule, create a new rule by clicking on create rule in folder.
In the configuration, under the item Appearance of network interface, use the drop-down menu to change the setting from Use index to Use alias so that Checkmk will use the alias for the port name in the future. In the Conditions section, under Host tags, add our just-created created tag Interface: by Alias/by Description as the condition for the rule. Since you have already set Use alias under Appearance of network interfaces, we can keep it and use Alias as tag conditions for the Host tag.
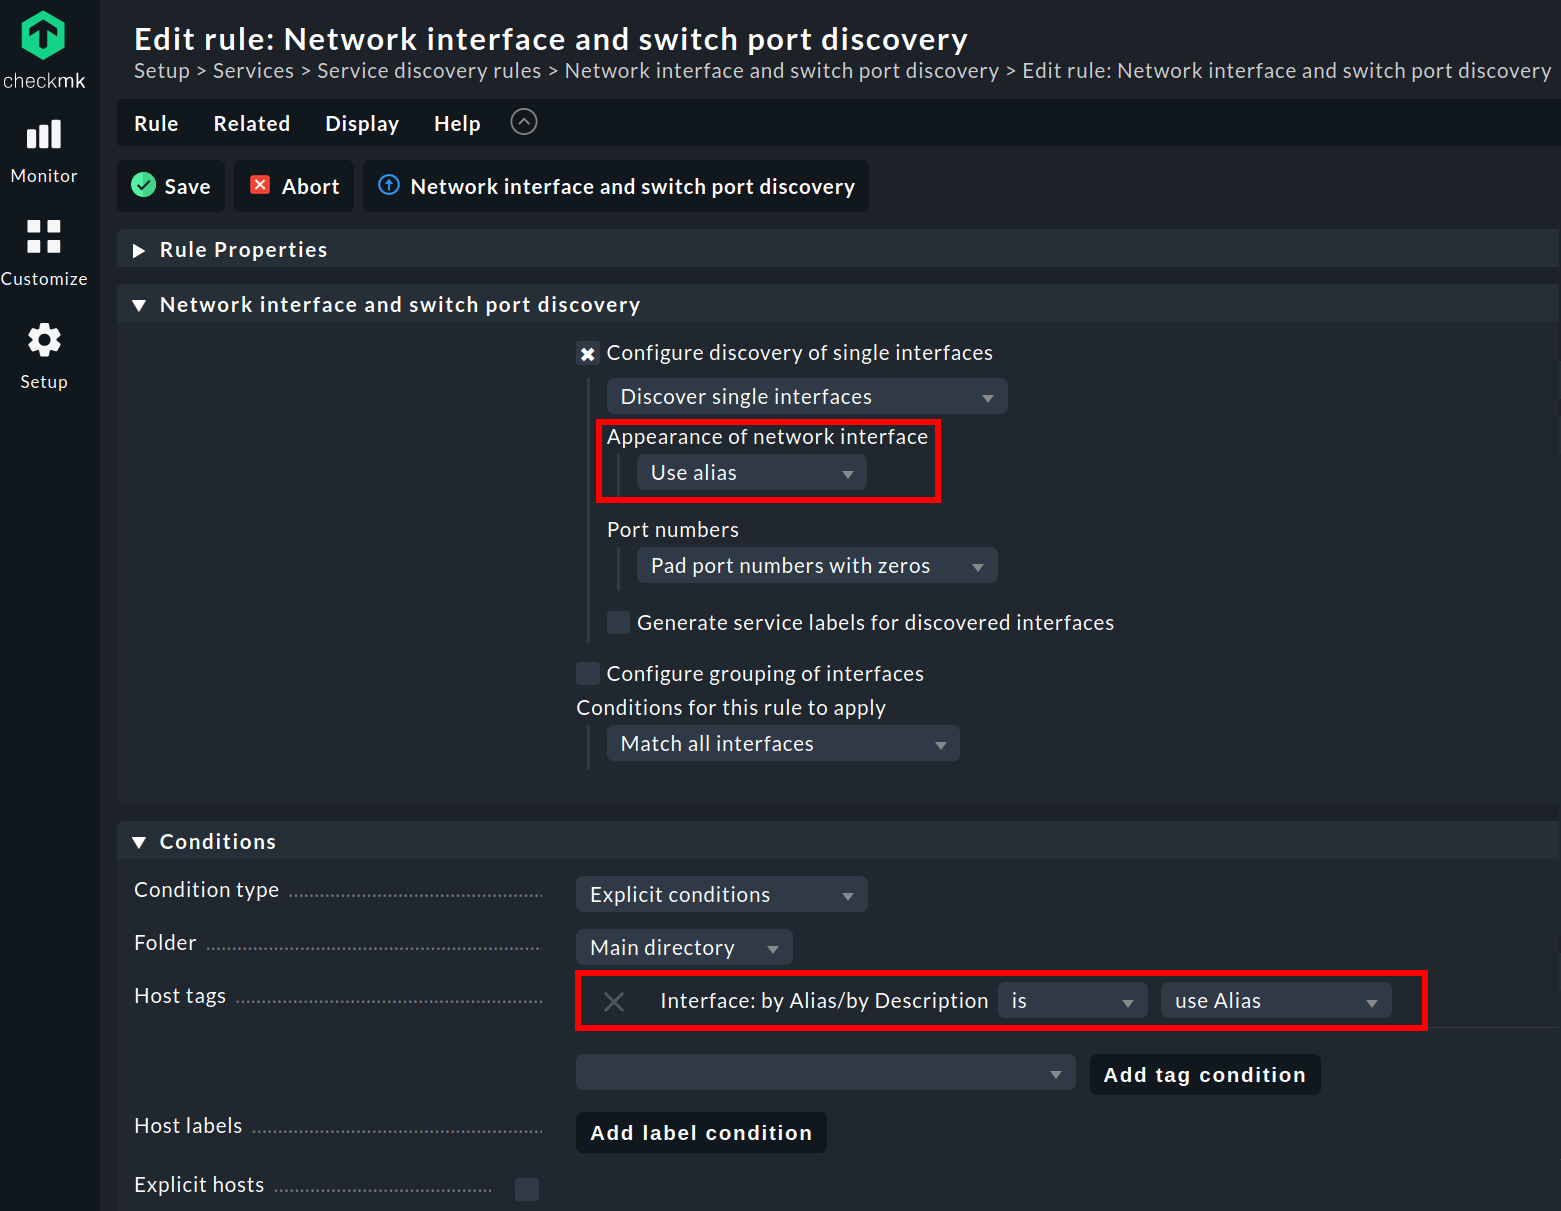
To ensure that Checkmk also detects interfaces that are offline during the check, under Conditions for rule to apply keep the setting as Match all interfaces. This ensures that Checkmk includes all port types in the monitoring, regardless of whether they are regular Ethernet ports or Etherchannels, VLAN interfaces, etc. Also, keep the Main directory as the folder so that the rule is applied to the entire network environment. Finally, save the rule.
Since you only use the alias table with this rule, you must create a second rule for the description table. To do this, clone the rule you have just created, and under Appearance of network interface change only the Host tag setting from Use alias to Use description. Then save this rule and activate changes.
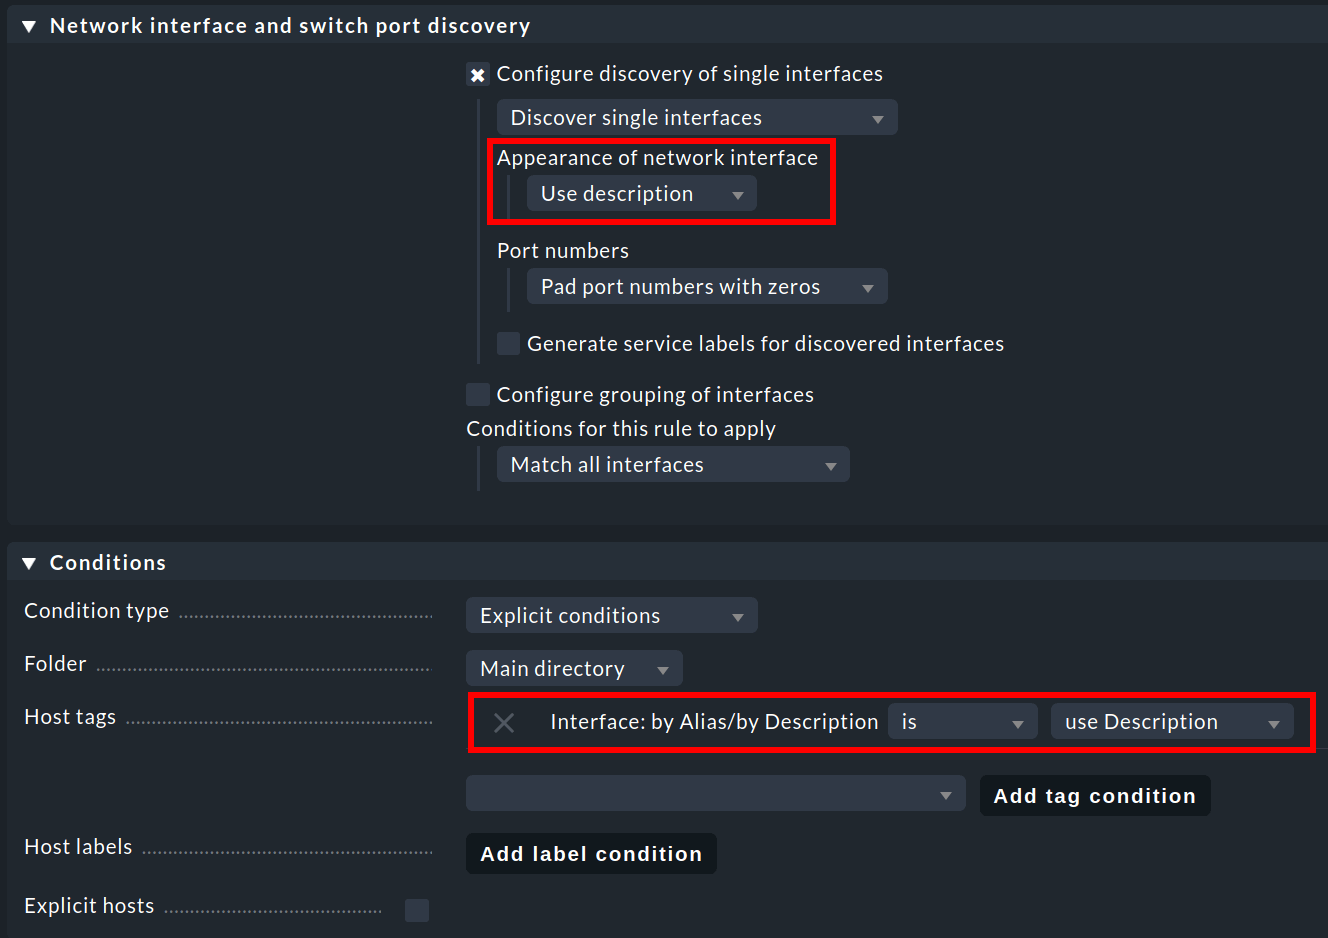
If you now trigger a new service discovery on your hosts, all named ports should now list the new assigned name in the service column. If this is not the case for a host, you must select use Description instead of use Alias under the Host Properties in the section Custom Attributes ➳ Interface: by Alias/by Description. With the correct service description in Checkmk, you can now not only distinguish between access ports and 'VIPs', but also at a glance see what is connected to the 'VIP' port.
Distinguishing Access Ports from 'VIPs'
You now need to create another rule for distinguishing the Access Ports from the 'VIPs'. If you have previously named all of your important ports, only the access ports should now have the default naming. With the new rule, you can now configure Checkmk to ignore status and speed changes on the access ports.
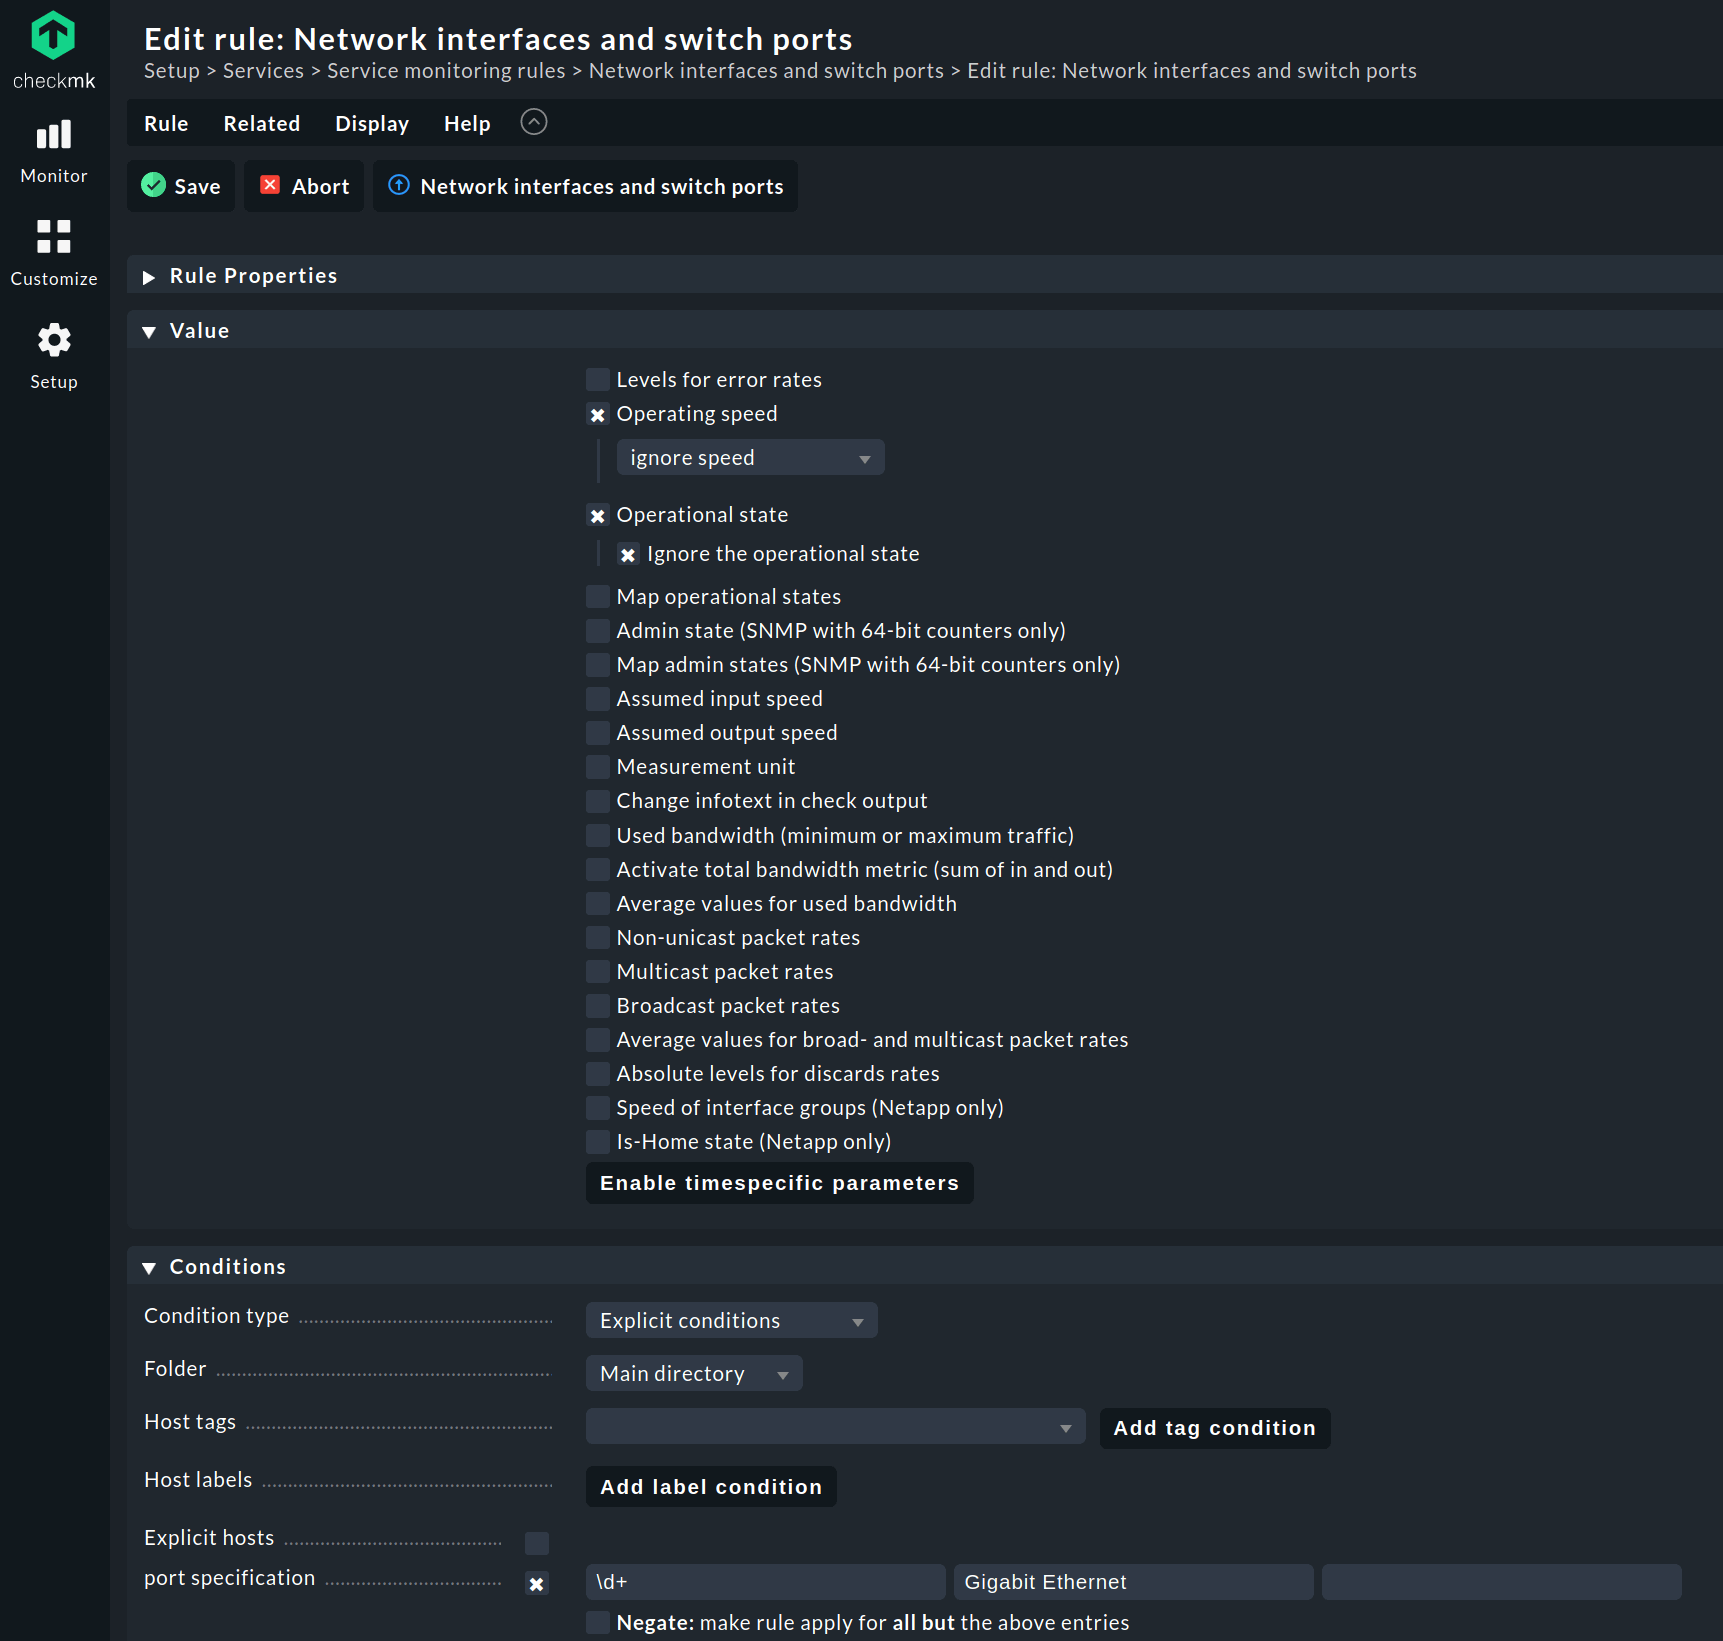
To do this, go back to the Setup menu and search for interface again. This time, however, under Services ➳ Service monitoring rules select the Network interfaces and switch ports rule. This rule determines how Checkmk should deal with newly discovered interfaces.
You also create this rule in the Main directory. Under Conditions, activate the checkbox for Port Specification and create a regex by entering \d+ in the next field if the port names start with numbers. This should cover most instances. However, sometimes manufacturers do not name their interfaces '0001', but 'Giga', 'TenGiga', 'FortyGiga Ethernet' or similar. To take these situations into account, simply create additional regex expressions in the subsequent fields if necessary, e.g. 'Gigabit Ethernet' and 'TenGigabit Ethernet', etc. This simply depends on how the switch or firewall manufacturer outputs the unnamed ports via SNMP.
Now, under Value, activate the options you need for your access ports. Since you want to ignore the speed for these interfaces, activate the Operating speed checkbox and select ignore speed in the drop-down menu. To ignore the state, also check the Operational state checkbox and select ignore the operational state there. Save the rule and activate the changes you have just made.
With these three rules defined, you now have all network interfaces configured in your environment, regardless of how large the infrastructure is. You can now also detect when a 'VIP' changes its status or speed. If such a situation occurs, the status becomes CRIT. For access ports, on the other hand, the status remains OK if its status or speed changes. However, if any errors occur on the port, Checkmk will show these for Access Ports as well!
By the way, this rule not only works for switch ports and firewall interfaces, but it will also give you usable names for all other network interfaces, for example, for Linux or Windows systems as well as for all other devices.
The Inventory Function
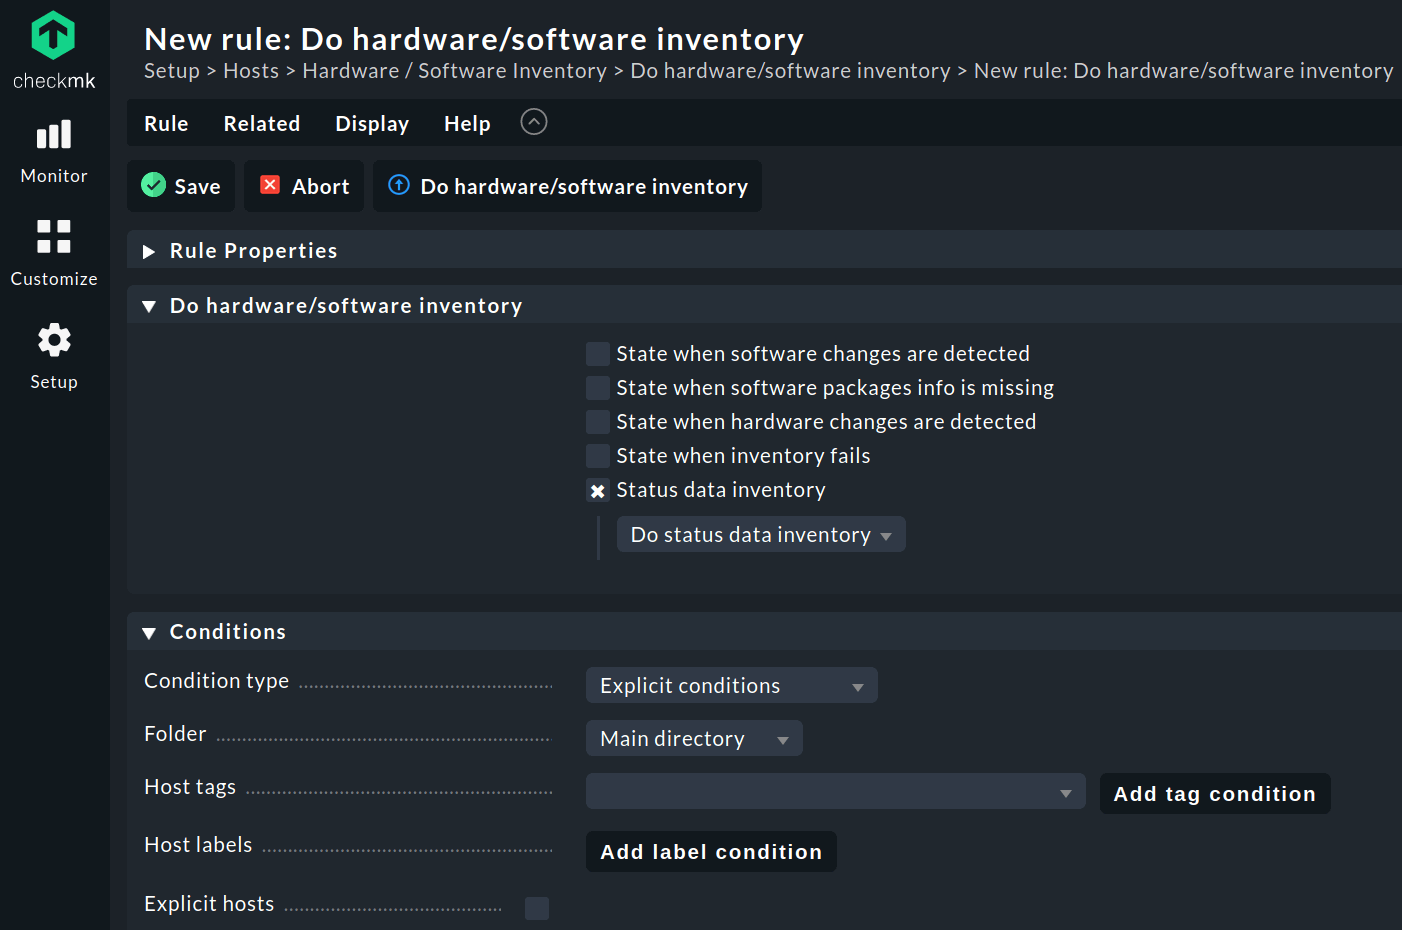
Checkmk also provides you with the ability to get more information on your ports, which can make administration easier. To benefit from this, search for inventory in the Setup menu and select HW/SW inventory. Then go to Do hardware/software inventory.
In the next step, you create a new rule in the Main directory. You can use this rule to take an inventory of the status data. To do this, activate the Status data inventory checkbox and select the Do status data inventory submenu item. Save the rule and apply the changes.
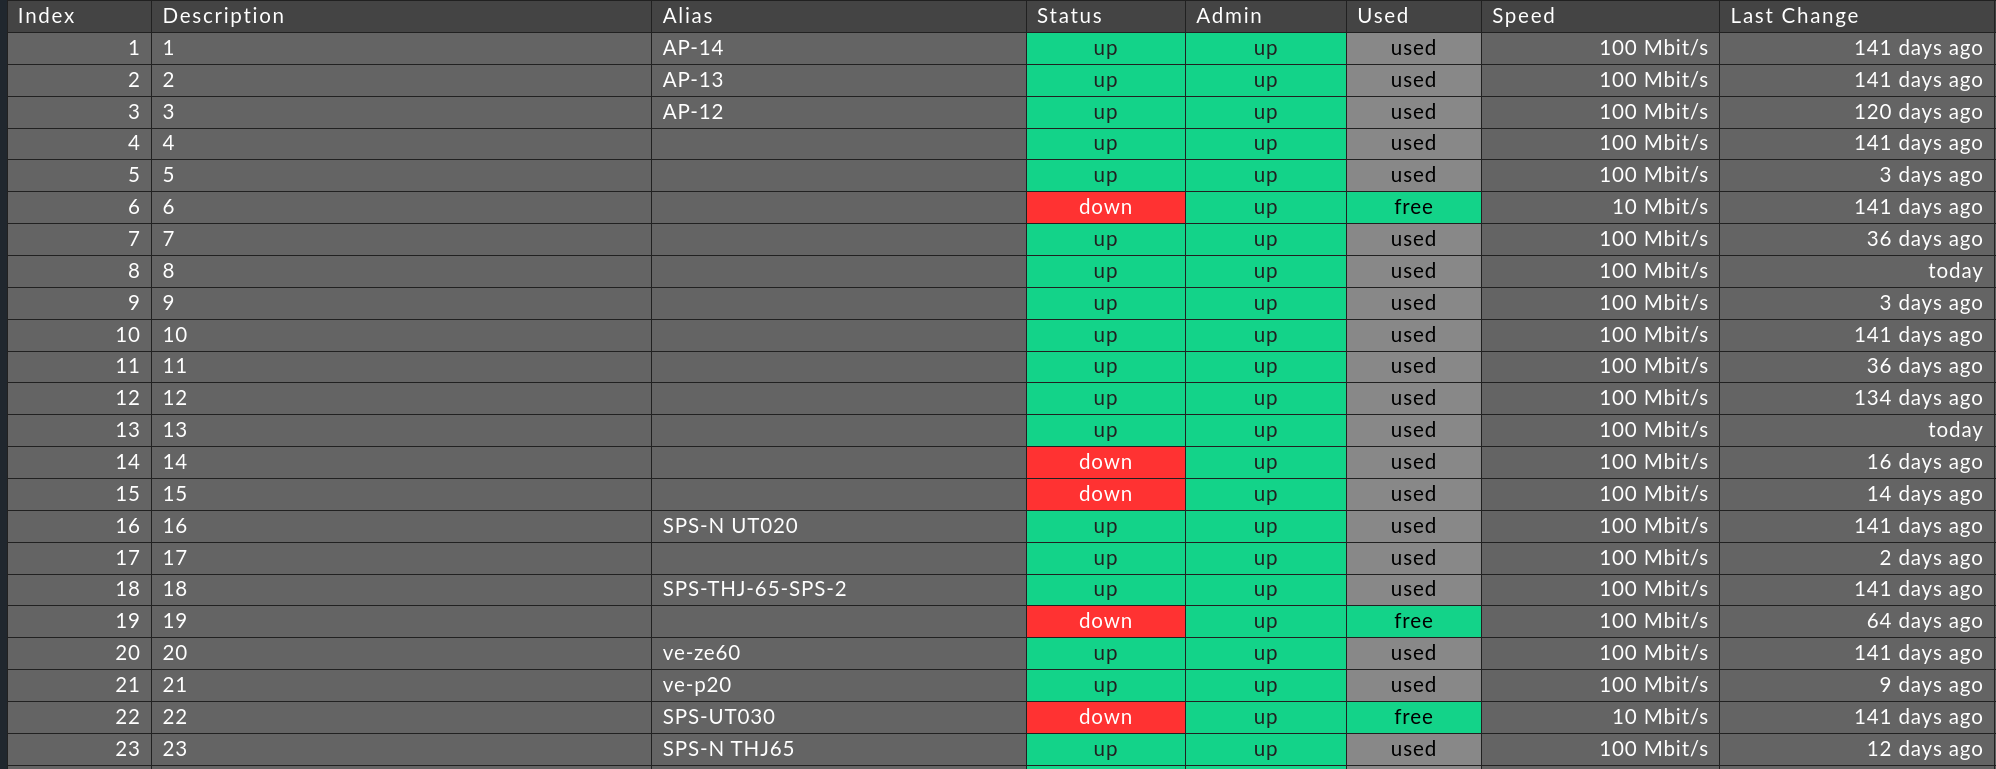
If you now run a new check on a host, Checkmk will discover new inventory entries. In the burger menu in the CHECK_MK HW/SW Inventory service, click on Show Hardware/Software Inventory of this host to get an overview of the individual interfaces of the host under Networking. There you can now see which ports are currently Down and Up. You can also see at a glance which ports are in use – even if they are currently Down – and which are not. By default, Checkmk remembers the status of a port for 30 days. If a used port is Down for longer than 30 days, Checkmk marks it as free again. With the Parameters for switch port inventory rule, you can customize this time period according to your own needs.
Conclusion
In this guide we have shown you how, with Checkmk from version 2.0, in just a few steps you can set up a network monitoring including all interfaces. In addition, you will now only receive the most important alarms, as Checkmk ignores changes in the status and speed of access ports. You have set all this up with relatively little effort - the naming of important ports and the creation of only three rules in Checkmk.
Since every IT environment is different, you may face some other challenges along the way. However, with this configuration you should be able to identify many of the problems in your network.
If you want to set up a holistic network monitoring with an older Checkmk version, check out the blog post 'Monitoring your network: Four rules to rule them all'.
Related Articles