Explore Checkmk 2.4
Checkmk 2.4 brings powerful new capabilities to help you monitor modern IT environments more effectively than ever. From deep application insights with OpenTelemetry to smarter synthetic tests and lightning-fast cloud setup – this release gives you the tools to stay in control, no matter how complex your infrastructure gets.
Get a complete view of your applications
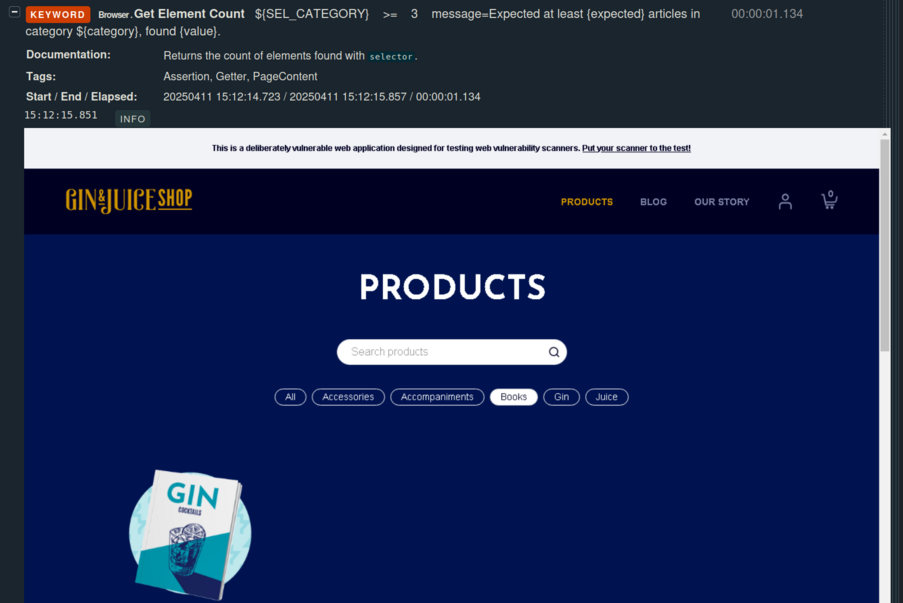
With the release of Checkmk 2.4, application monitoring reaches a new level. Thanks to built-in support for OpenTelemetry, you can now gain deep visibility into the inner workings of your applications. At the same time, synthetic monitoring makes it easier than ever to test your applications from a user’s perspective. This gives you end-to-end visibility into your applications – from the user interaction to the internal logic behind them.
Get application performance insights with OpenTelemetry
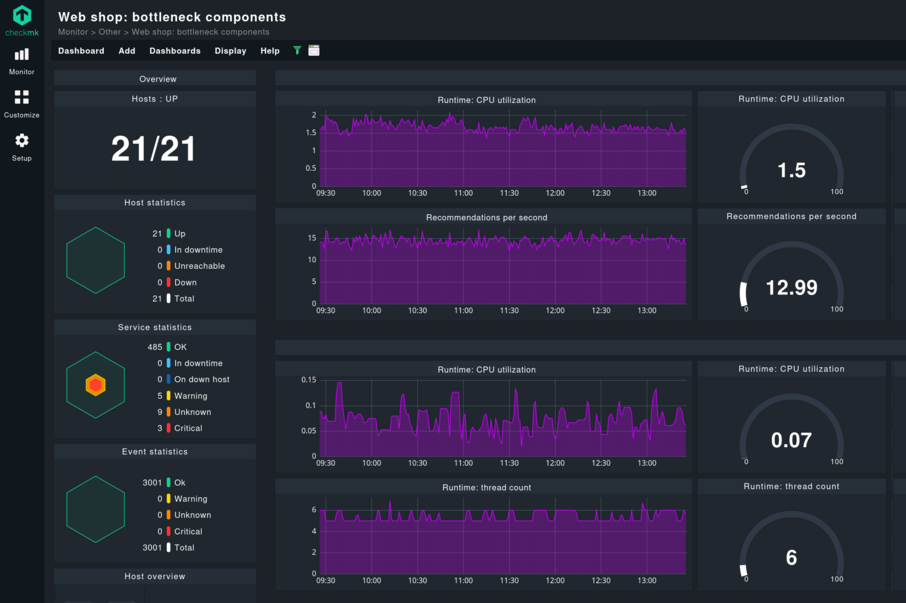
OpenTelemetry support in Checkmk 2.4 allows you to extend your infrastructure monitoring with powerful insights into your applications. Monitor performance, reliability, and root causes of issues directly from within your applications using metrics – all in one place.
Many modern applications already support OpenTelemetry out-of-the-box or expose Prometheus metrics endpoints. Checkmk’s integrated OpenTelemetry collector ingests this data, converts it into actionable metrics, and maps it to the correct hosts.
The result: You don’t just see that something is wrong – you see where and why. This helps you troubleshoot even unknown issues more effectively and keep your applications stable and performant.
Note: The OpenTelemetry collector is an experimental beta feature, and not supported yet. Use and test at your heart's desire, just don’t rely on it in production - scope & features may change.
Monitor applications from the user’s perspective
The Synthetic Monitoring add-on brings real end-to-end testing to your monitoring – from the perspective of your users and under real-world conditions. Beyond just checking availability and performance, you can actively verify whether your applications are working as expected from a functional point of view.
With the new automation features in version 2.4, setting up your test environments is now faster, easier, and more robust than ever. Upload your test robots directly through the web interface, configure them with just a few clicks, and manage all test setups centrally via a clean UI. You can clone, edit, and deploy these managed robots across your systems – whether Linux or Windows – using the Checkmk Agent Bakery.
Even isolated environments are no obstacle: Run your tests on isolated nodes without internet access, either by uploading ZIP files or via an RCC server. This ensures reliable synthetic monitoring even in sensitive offline environments.
Cloud monitoring in minutes – with Quick Setup
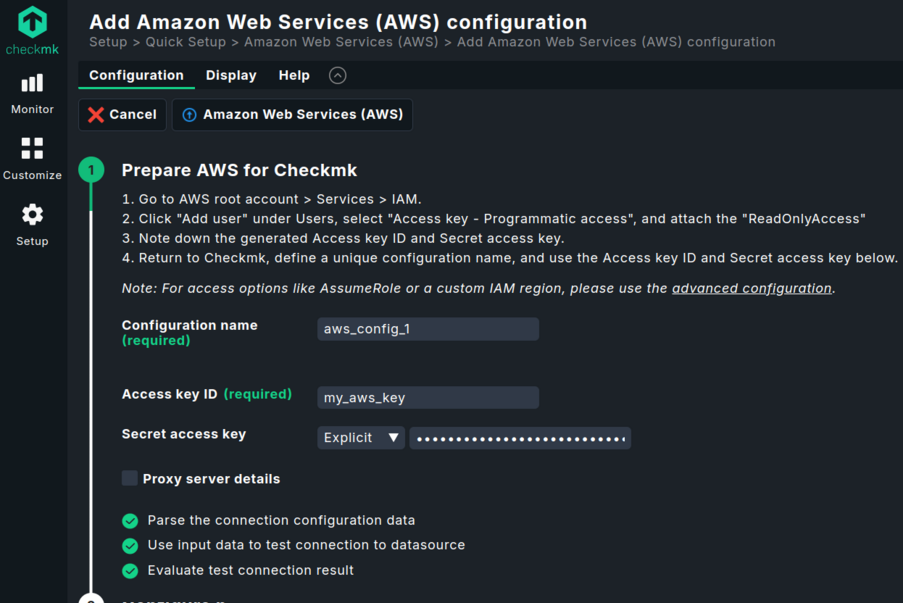
The new Quick Setup feature gets your cloud monitoring up and running in no time. In just a few steps, you can start monitoring your AWS, Azure, or GCP environments – with no need for complex manual configurations.
Whether you're using Azure SQL, serverless functions, microservices, or managed Kubernetes services like AKS, EKS, or GKE – Quick Setup walks you through everything you need and handles the complex setup for you behind the scenes.
Built-in connection tests and validations ensure that your configuration works – giving you immediate and reliable visibility into your cloud resources.
Stay in control of highly dynamic infrastructures – automatically
The new Checkmk 2.4 release makes monitoring highly dynamic IT environments even easier. With the enhanced and expanded dynamic host management, Checkmk automatically adapts to your infrastructure – no manual intervention required.
In Kubernetes environments or virtualized infrastructures, hosts often appear and vanish automatically. Checkmk detects these changes in real time: it adds new hosts to monitoring as they come online and reliably removes those that are no longer active.
The dynamic host management is designed for maximum scalability – capable of handling thousands of changes per minute. This ensures stable and reliable monitoring, even in volatile and large-scale environments.
Combined with powerful automated host and service discovery, extensive out-of-the-box monitoring for hybrid infrastructures, and a scalable, distributed architecture, Checkmk is fully equipped to efficiently monitor even the most demanding IT landscapes.


