Checkmk 2.5: Unified IT observability, simplified operations
Checkmk 2.5 introduces a host of innovations designed to bridge the gap between traditional infrastructure monitoring and modern application observability. From native OpenTelemetry support, to UX improvements and AI-driven incident analysis, this release makes your workflows faster, your monitoring insights more actionable, and your environment more secure.
1. Close the visibility gap with native OpenTelemetry support
Available in Checkmk Ultimate and Checkmk Cloud.
Stop treating your applications as "black boxes." By integrating OpenTelemetry (OTel) support and a high-performance backend, Checkmk 2.5 provides a single pane of glass across your entire stack, from legacy Java/.NET applications to cloud-native microservices.
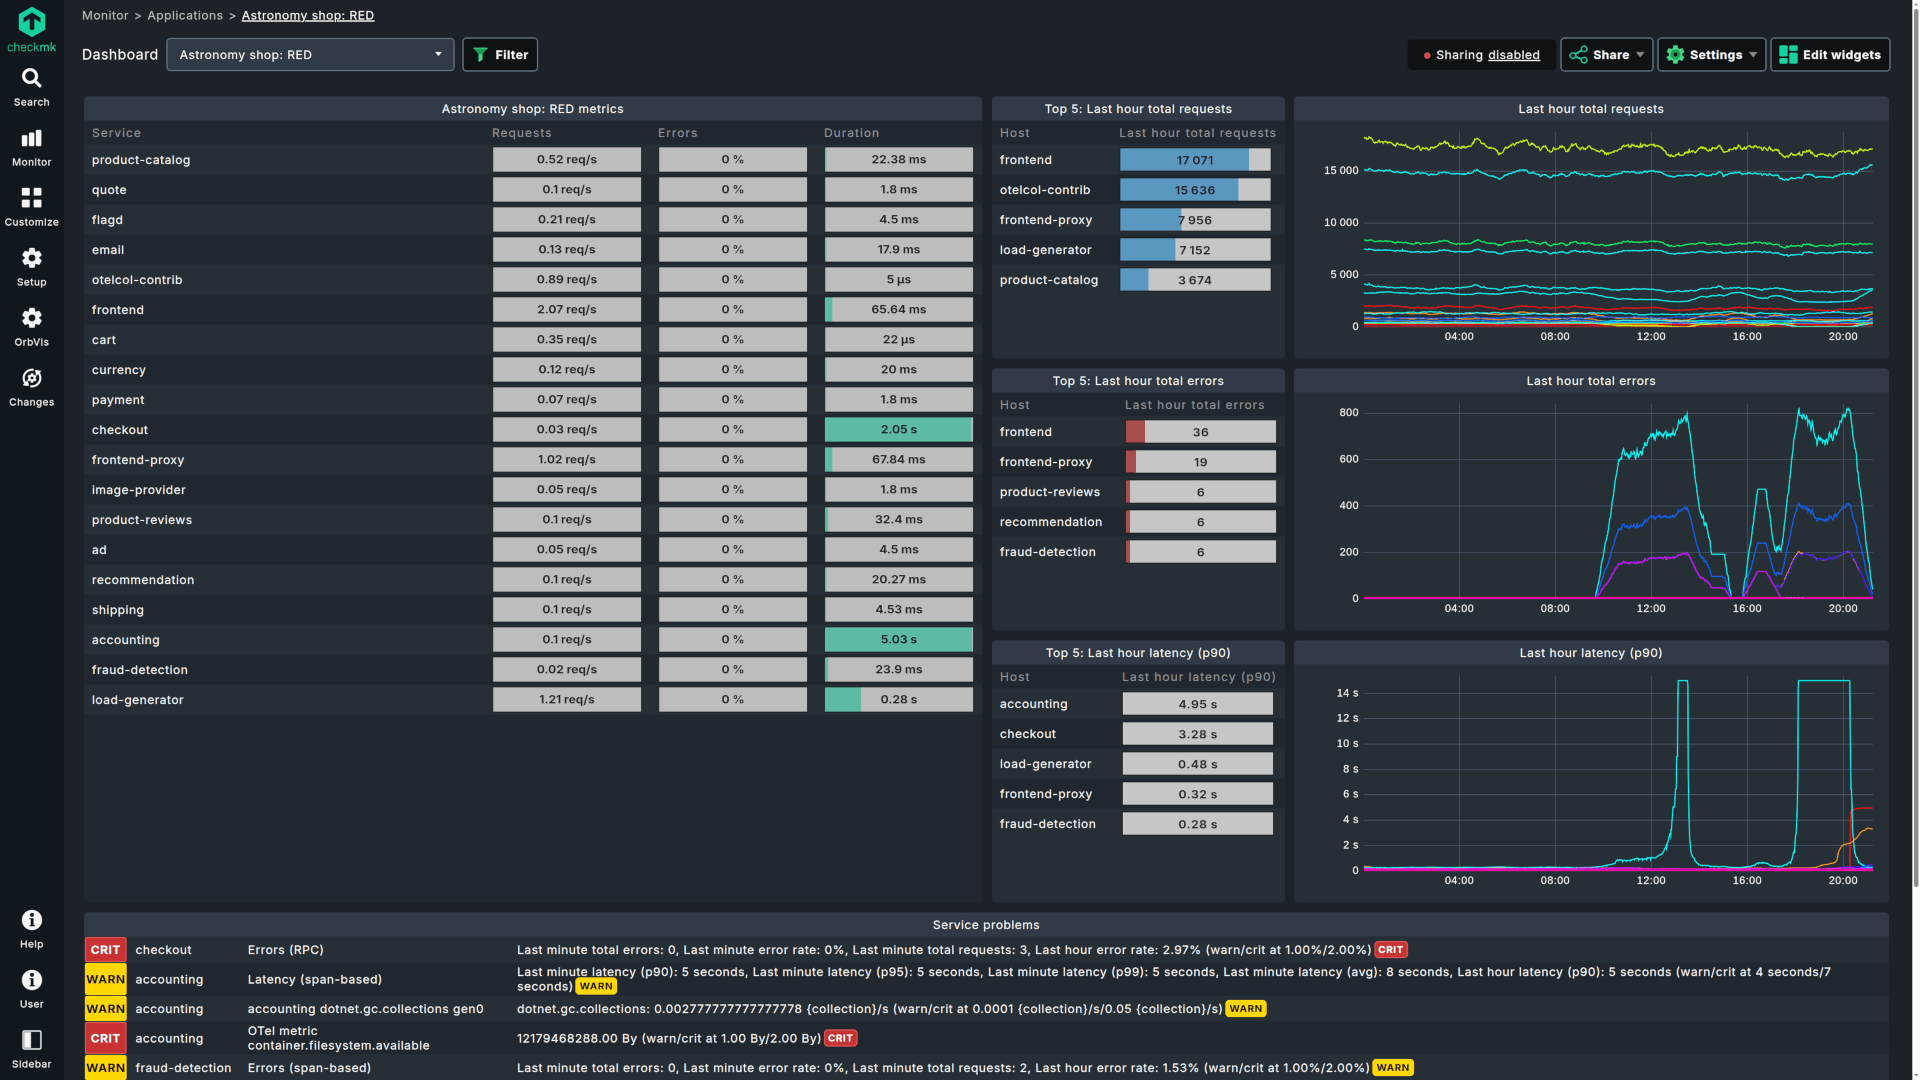
- Eliminate the "black box": Gain deep visibility into legacy software without requiring developers to touch a single line of code.
- Get granular visibility: OpenTelemetry provides deep visibility into AWS, GCP, and Azure services more than standard vendor APIs allow, giving you the control needed to guarantee uptime.
- Accelerate root-cause analysis: Instantly cross-analyze application performance dips to hardware bottlenecks using built-in dashboards for RED signals (Rate, Errors, Duration).
- Consolidate and scale: Reduce tool sprawl by pushing metrics directly via OTLP or scraping Prometheus endpoints. Manage massive data cardinality without sacrificing UI responsiveness.
2. Streamline remote monitoring with Checkmk Relay
Available in Checkmk Ultimate and Checkmk Cloud.
Monitoring segmented networks or small remote locations shouldn't require heavy infrastructure.
Checkmk Relay is a lightweight, system-agnostic container that replaces the need for full remote sites in smaller environments.
- Zero-maintenance remote monitoring: Deploy a "hands-off" container that updates itself automatically, eliminating the overhead of managing remote sites.
- Secure by design: While monitoring with zero inbound traffic was always possible with agent-based monitoring, Relay allows you to bring zero-inbound monitoring to situations where the device is not monitored by an agent. It establishes a secure, outbound, mTLS-encrypted connection to your central site, keeping your segmented networks protected.
- Expand your reach: Checkmk Cloud users can now easily monitor SNMP devices (like NAS and printers) in remote locations that were previously unreachable.
Note: The Relay and a remote site each have their trade-offs. Less complexity in maintenance comes in this case also with less functionality versus a full blown remote site.
3. Decipher complex alerts instantly with AI
Available in Checkmk Cloud.
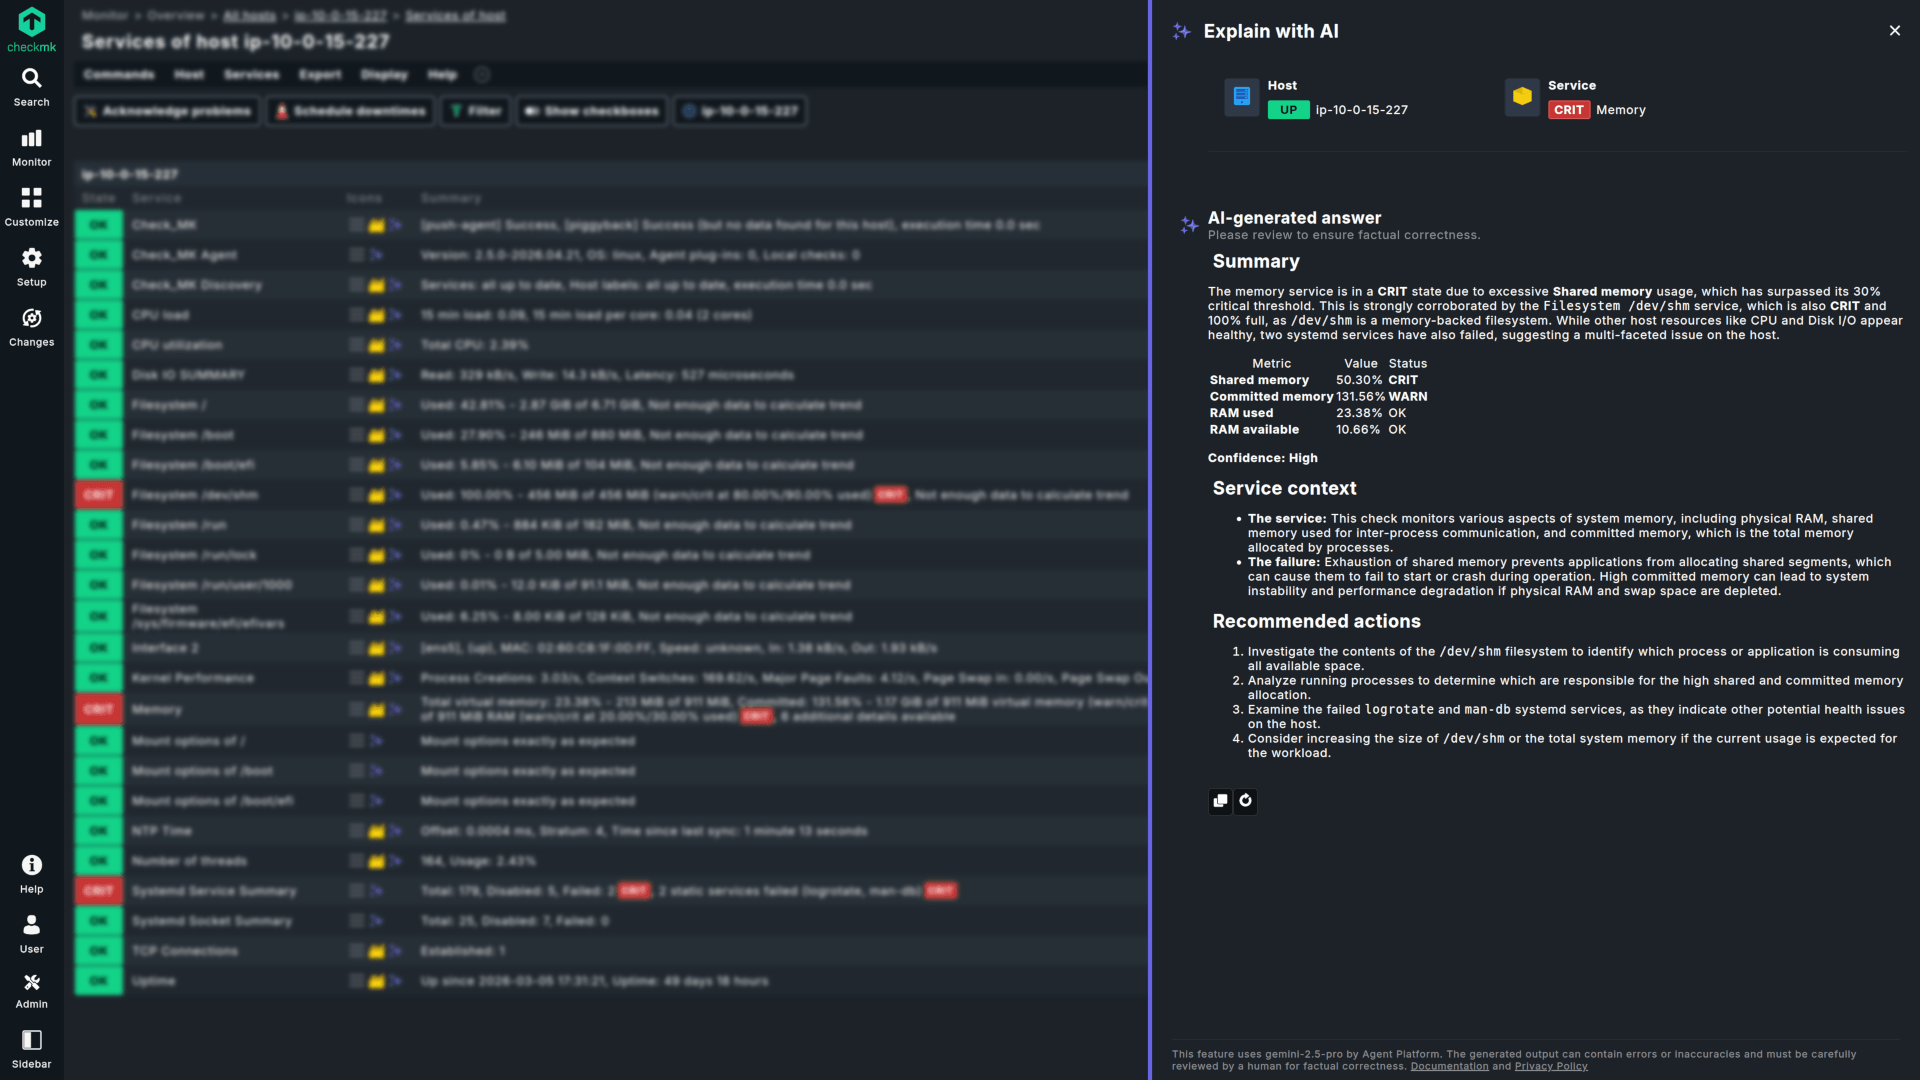
Turn complex alerts into actionable intelligence. Our new “Explain with AI” feature translates technical signals into clear root cause analysis with a single click.
- Stop decoding, start fixing: Move immediately from alerts to a clear in-depth explanation, saving critical minutes during high-pressure outages.
- Cross-analyze alerts with other issues on the system: Get context information by automatically fusing monitoring information of other services into your alert analysis.
- Bridge the expertise gap: Empower junior staff or generalist SREs to handle alerts for unfamiliar stacks.
- Streamline stakeholder updates: Generate instant, readable incident summaries to share with non-technical stakeholders for post-mortem documentation.
4. Best-in-class infrastructure monitoring: Azure, virtualization, and core feature updates
Available in all commercial editions.
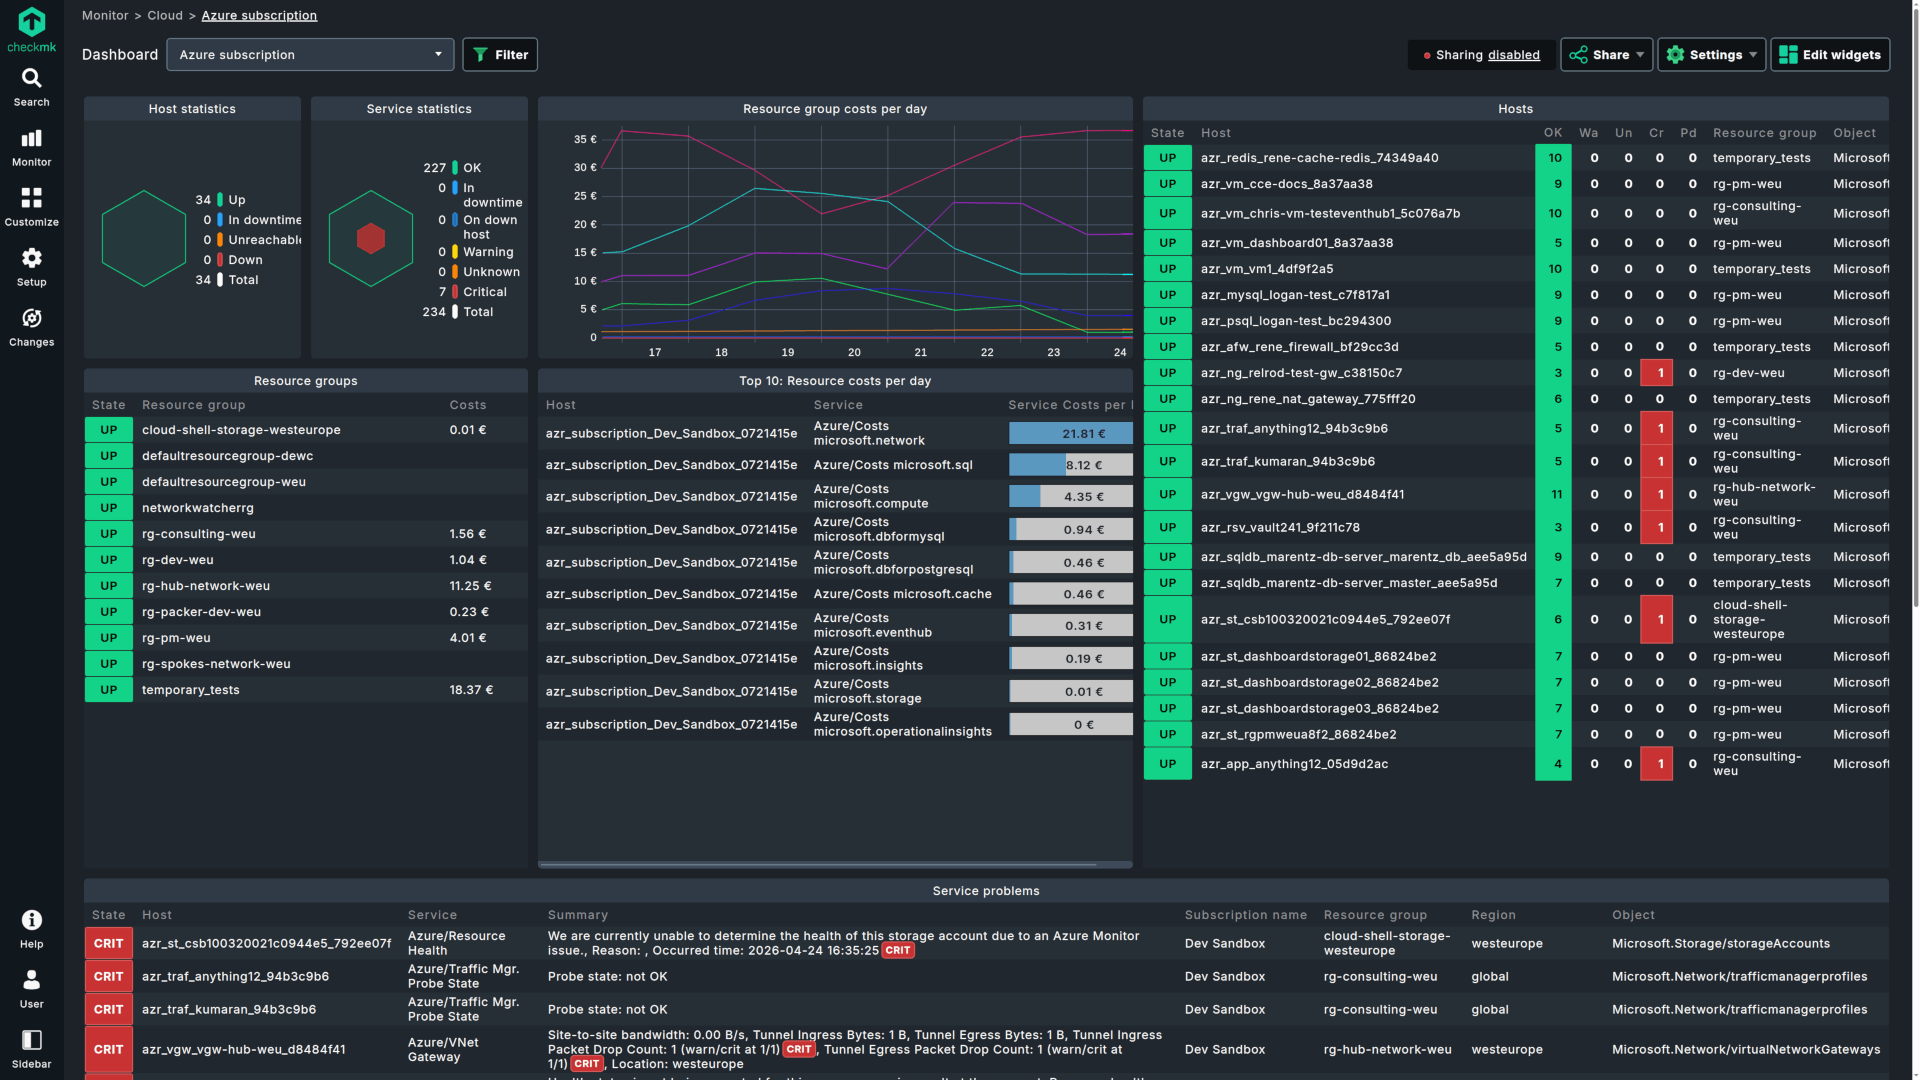
Monitoring an enterprise environment often leads to performance bottlenecks when cloud footprints grow or virtualization stacks shift. Checkmk 2.5 addresses these challenges with completely overhauled Azure monitoring, expansive virtualization support, and over 90 feature enhancements.
- Azure monitoring at scale: A redesigned architecture delivers 60% faster performance. Manage massive multi-subscription setups with a single rule and use native Azure tags for instant filtering. New drill-down dashboards with integrated Azure metadata allow you to easily navigate through your cloud infrastructure
- Adaptive virtualization support: Stay ahead of market shifts with expanded coverage for Proxmox (monitor cluster health, overcommitment, and more), Hyper-V, and Podman.
- Prevent alert storms for Windows: New agent-level Windows event log filtering allows you to set custom limits on incoming data.
- Jointly register agent updater and agent controller: The agent controller can now handle both controller and updater registration eliminating the need to run two registrations separately.
5. Visualize what matters with responsive dashboards
Available in all commercial editions.
Monitoring is only useful if it’s visible. Checkmk 2.5 makes it easier to create, customize, and share insights across the organization.
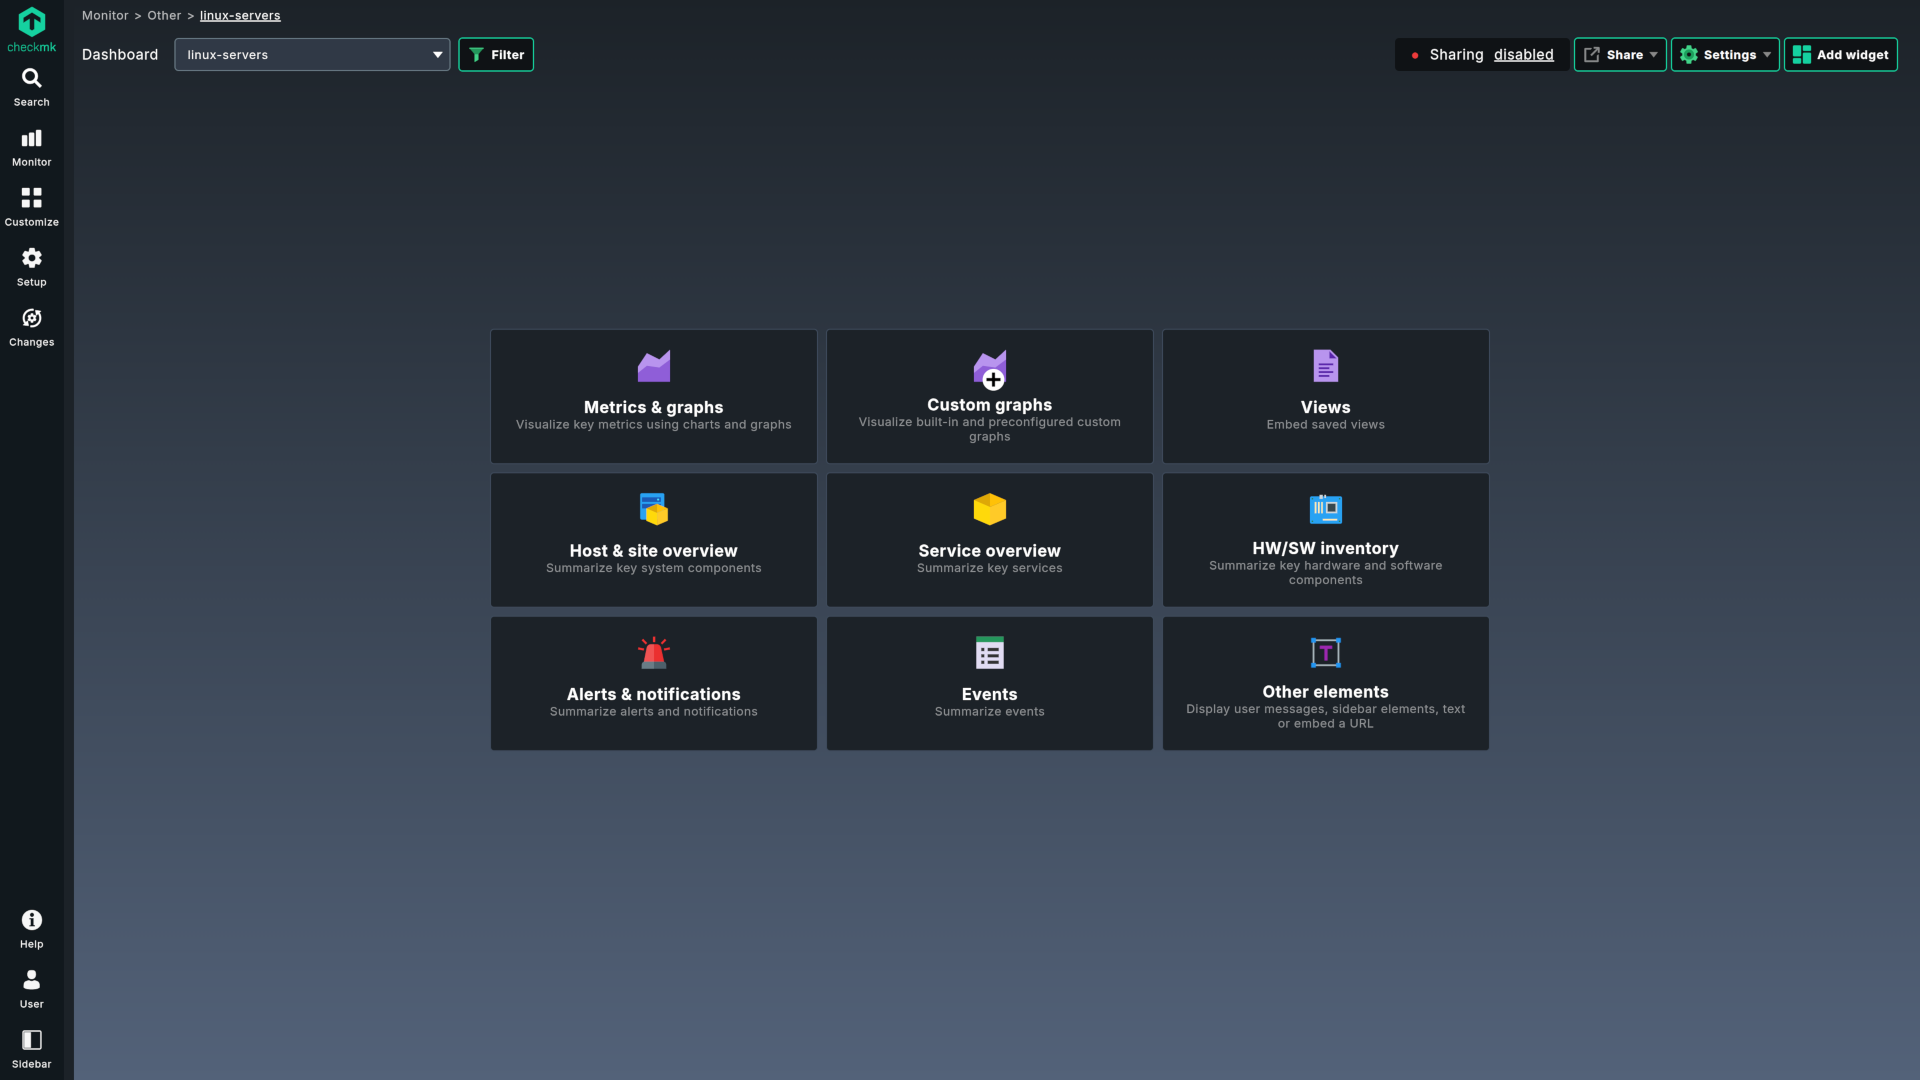
- Perfect views on any screen: New responsive layouts adapt automatically, from a mobile device to a 4K NOC wall. No manual adjustments required.
- Build without trial and error: A redesigned guided workflow and the new Widget preview let you see your data visualization before you save it.
- Extend visibility to everyone: Securely share dashboards with stakeholders who don’t have a Checkmk account via time-limited, custom invitation.
6. Work faster with a more intuitive interface
Checkmk 2.5 removes micro-frustrations and navigation lag with a more responsive and intuitive approach that makes workflows faster and learning curves significantly shorter.
- Stay oriented and reduce guesswork with instant feedback: Complex views now display structural previews, allowing you to stay oriented and ready to act while detailed metrics populate. New active loading indicators and explicit confirmations for intensive tasks (like agent baking or test notifications) ensure you always know the system is working.
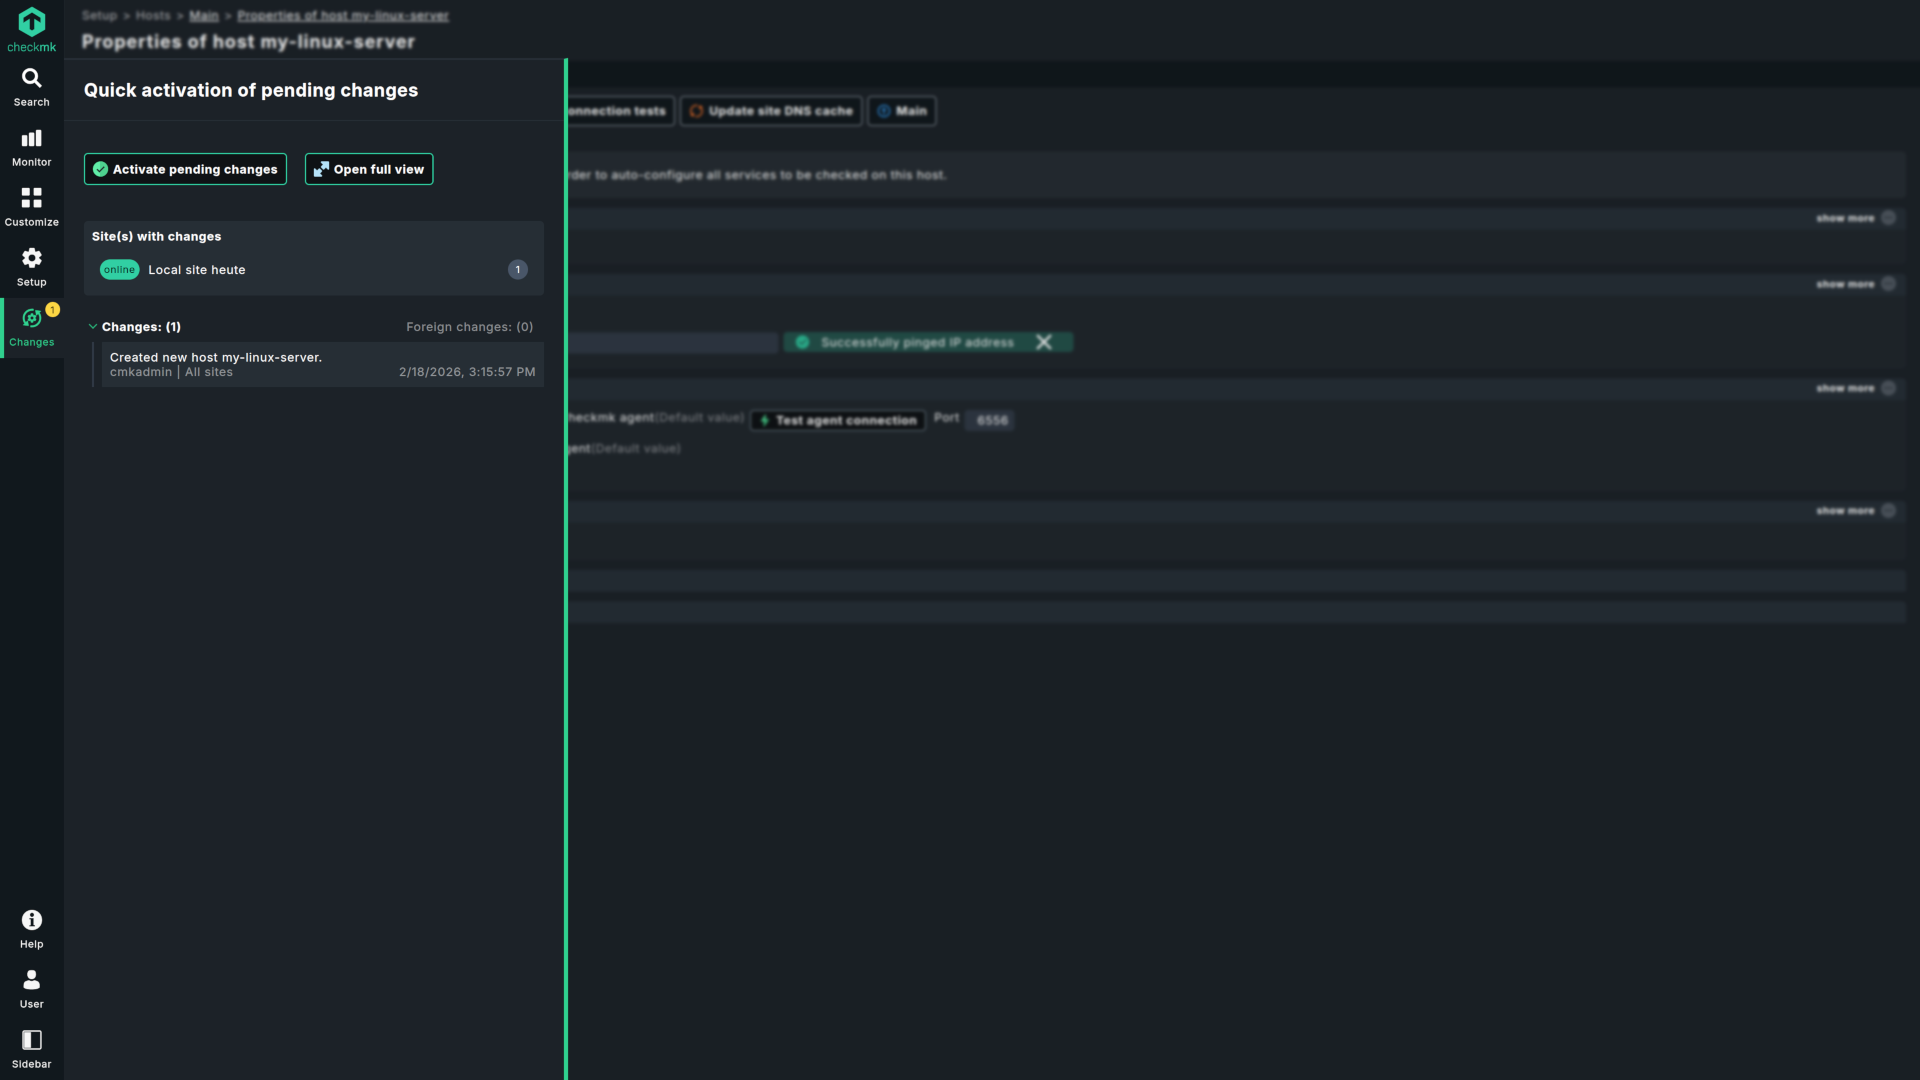
- Add new hosts just like that: Immediate DNS/Ping checks while adding a host ensure you don’t create unreachable hosts. Agent connection tests help detect non-registered hosts. Combined with a workflow to download and register hosts via one-time tokens you will not want to add hosts another way anymore.
- Apply changes without breaking your flow: Apply changes on the fly via a new slide-out, allowing you to activate configurations without switching contexts or losing your place during a critical investigation.
- Find anything instantly with unified search: You no longer need to know whether a setting lives in "Setup" or "Monitoring" thanks to an improved global search.
- Resolve configuration errors faster: Clearer, more descriptive error messages pinpoint exactly what went wrong, allowing for instant correction rather than trial-and-error troubleshooting.
7. Licensing & renaming
Checkmk got new names (werk 19391):
With Checkmk 2.5.0, all commercial editions require a valid license verified in the product. Previously, license verification was only required for Checkmk Ultimate. With this change, Pro now uses the same verification mechanism to simplify subscription management.
This enhancement replaces manual reporting tasks with an automated process and provides a clear, in-application view of license compliance. It also reduces administrative overhead and improves transparency for licensed environments.
Based on our experience with the introduction of license verification in Checkmk Ultimate, we implemented a pre-update check to ensure that only verified sites can be updated to version 2.5.0. This saves users from the risk of ending up with an unlicensed site that immediately enters a 30-day trial mode and avoids the need to troubleshoot licensing issues during a major version migration. We recognize that updates can be demanding, and our goal is to eliminate unnecessary surprises. More information can be found here: https://checkmk.atlassian.net/wiki/x/GIACIg
The relevant werks
Checkmk 2.5 includes more than 1,000 werks. This is just a curated list of the most relevant changes. For all changes, please check out all werks.
Dashboards
- 19335: New Dashboard Visualization Platform
- 19330: Dashboard: New Responsive Layout
- 19331: Dashboard: Unified Filtering Experience
- 19332: Dashboard: Integrated Widget Management
- 19333: Dashboard: Public Dashboard Sharing
- 18711: Dashboard: Integrated Dashboard Management
- 18581: Dashboard: config file format changed
User Interface & Usability
- 18928: Introduce Global Search
- 18960: Welcome page: Added onboarding guide for new Checkmk users
- 18469: Activate changes button moved to new main menu item
- 19167: Update ruleset form rendering
- 18085: New option "Save & edit" on properties of host page
- 18117: Add service state filter to quicksearch¹
- 18046: Design custom graphs: Improve usability and workflow
- 18621: Introduce filters and sorters for crash reporting
- 19615: Downtimes: include the author's username in the comment
- 18068: Master control: Toggling is now logged in audit log
- 18373: Also allow connections from Ultimate to Pro/Community editions
OpenTelemetry
- 18906: Introduce new metric backend for Checkmk
- 19133: OpenTelemetry Integration switches to Metric Backend
- 19075: Adjust DCD-based OpenTelemetry metrics monitoring to new metric backend
- 19076: Custom visualization and monitoring of OpenTelemetry metrics
- 18733: OTel: Add RED Method checks to monitor services based on OTel data
- 18053: Otel-collector: Export log messages to event console¹
Configuration & Setup
- 19036: Introduce ping validation for host creation/editing
- 19037: Introduce agent installation slideout
- 18872: New Agent connection test
- 18876: Agent connection test in service discovery
- 18272: Extend interface discovery to allow discovery of multiple service labels
- 18669: Add an analyze config check for automation users with stored passwords
- 17345: Remove automation user login via HTTP parameters
- 17459: Allow to store backups to S3 compatible providers
- 18120: Offer folder cleanup option for distributed monitoring deletion¹
- 18124: Validate dynamic host configuration on update
- 18908: check-http: Manual proxy config update
- 18289: Global Proxy: Config update
- 19070: License verification can be configured to use an HTTP proxy¹
Interfaces (REST-API, Livestatus)
- 18004: Introduction of versioning framework for REST API
- 18037: HW/SW Inventory: Add REST-API endpoint for fetching inventory trees
- 17954: REST API: Extend acknowledge endpoints¹
- 18707: Introduction of user messages acknowledge and delete endpoints
- 18212: OTel: REST API endpoint to configure Otel collector¹
- 18643: Livestatus Labels Table Has Two New Columns
- 19334: Dashboard: REST API for Dashboard Management
Plug-in APIs & developer tools
HW/SW Inventory
- 18704: Mainline network topology inventory plugins for HW/SW inventory
- 18032: HW/SW Inventory: Speed up loading trees
- 18033: HW/SW Inventory: Add script & cronjob for transforming inventory trees
- 18049: HW/SW Inventory: Rework housekeeping job¹
- 18319: HW/SW Inventory: Improve loading history entries
Synthetic Monitoring
Performance
- 18867: Improve performance of notification spooler
- 19099: Improve notification statistics livestatus query performance¹
- 19089: Improve notification rule rendering¹
- 19024: Improved Micro-core Performance On Reload¹
- 19175: Improved Livestatus Filter Performance on Aggregate Columns¹
- 18255: Improved performance on activate changes page¹
- 18222: Speed up activation for hosts without management board attribute¹
- 18110: BI: Improve performance when fetching BI data¹
- 17897: BI: improve compiler performance¹
- 17756: Improved SQLite housekeeping for event console history¹
Platform support
Site management (OMD)
- 19605: Add opt-in product usage analytics¹
- 19007: Block update to Checkmk Pro 2.5 (formerly Enterprise) if the site is unlicensed
- 18883: Omd update: Add --skeleton and --pre-flight
- 18154: Omd update: More fine-grained control over non-interactive updates
- 19034: Update Python (3.13) and Stricter Certificate Validation
- 18988: Automatic certificate rotation for "Authority Key Identifier" compliance¹
Monitoring integrations
The Checkmk Agent & more
- 19273: Register agent controller and agent updater in one command
- 19274: Agent updater runs under the agent controller user
- 19276: Report agent updater status via dedicated status plugin
- 19275: Linux agent controller now available for ARM64 (aarch64)
- 19426: Agent Bakery: Allow configuring Windows agent communication channel¹
- 19279: Agent Bakery: Log baking actions to audit log¹
- 18670: Added option to select stored passwords for authentication of agent bakery plugins
- 18930: Add bakery support for Nvidia GPU monitoring (Linux)¹
- 16908: Drop Python 2.7 agent plugin compatibility
- 17923: Add agent rule to disable AIX agent sections¹
Cloud & Virtualization
- 19467: Azure special agent v2: enhanced performance and improved monitoring structure designed for multi-subscription monitoring
- 17005: AWS tag import: Enable filtering and ignoring of tags
- 18612: Enhanced Hyper-V Monitoring with New hyperv_host.ps1 plugin
- 18231: vSphere: add initial GPU utilization check
- 17995: ESX vSphere: Opt out of template monitoring
- 18060: Citrix_state: Implemented configuration for VM Tools State
- 18724: Introduced Podman Monitoring
- 19458: Mk_podman: Add connection method configuration (API vs CLI)
- 18731: Proxmox VE: Extended monitoring and inventory
- 18726: Proxmox_ve_node_info: Improve the ruleset
- 18725: Proxmox VE: Added subscription expiration monitoring to node info service
- 17797: Proxmox_ve_vm_info: Add VM uptime
- 17800: Proxmox_ve_cpu_util: Add check to monitor VM CPU usage
- 17798: Proxmox_ve_network_throughput: Add check to monitor network in/out of VMs/CTs
- 17799: Proxmox_ve_disk_throughput: Add check to monitor disk read/write rates of VMs/CTs
Network, PDU & Hardware
- 19547: Mainline core features from Cisco Meraki MKP
- 17605: New plugins to monitor Cisco ESA Appliances
- 18877: Monitoring for Cisco Security Management Appliances (SMA)
- 18283: Add Cisco WLC Support for C9800-80-K9
- 17893: Netscaler_ha: Rework Citrix Netscaler high-availability (HA) monitoring
- 18372: Network topology: Now includes layers from all folders¹
- 18297: Implement new Host Label for SNMP devices
- 19552: Redfish: add PDU, power consumption, and power redundancy monitoring¹
- 19270: Add support for Gude 8311 PDUs
- 19562: Added New RA3S SNMP Check Plugins¹
- 18685: AudioCodes check plugins introduced
- 17767: Residual_operating_current: Added new check plugin
- 18723: Corosync_latency: Introduce new check plug-in
Applications & Databases
- 17540: Microsoft SQL Server plugin supports now Azure SQL Server monitoring¹
- 19038: Emailchecks: add option to authenticate via GraphAPI
- 18204: Bazel_cache_status: New plugin to monitor the Bazel Cache version¹
- 18236: Check_mail_loop: add subject into body
- 17739: Mk_docker.py: New option for 'Host name used for containers'
- 19165: New check plug-in: System time offset for NetApp ONTAP¹
- 18950: NetApp ONTAP: improved qtree quota fetching performance¹
Active checks
- 18050: Support for IPv6 in Smart Ping
- 18888: Check_http: Hard deprecation of old HTTP monitoring plug-in
- 18552: Check_httpv2: Add TLS compatibility mode option¹
- 18247: Certificate check: STARTTLS is now possible for SMTP
- 18248: Certificate check: Support for Postgres SSL connection
- 18623: Check_cert: introduce option to connect to servers via proxy
Operating systems & services
- 19189: Windows Event Log monitoring: Extended filtering options
- 18686: Windows Time Service (W32Time) time synchronization monitoring
- 18653: Netstat: Switch linux plugin to prefer 'ss' over deprecated 'netstat'
- 18567: Nginx_status: Prefer iproute2 (ss) over net-tools (netstat)
- 17684: Deprecation of MSOnline Powershell module in mk_msoffice.ps1¹
- 17685: Migration of the mk_inventory.vbs to the mk_inventory.ps1
- 17686: Migration of the citrix_licenses.vbs to the citrix_licenses.ps1
- 17687: Migration of the kaspersky_av_client.vbs to the kaspersky_av_client.ps1
- 17688: Migration of the mk_mysql.vbs to the mk_mysql.ps1
- 17689: Migration of the rds_licenses.vbs to the rds_licenses.ps1
- 18111: Migration of the windows_multipath.vbs to the windows_multipath.ps1
- 18112: Migration of the windows_updates.vbs to the windows_updates.ps1
Other
- 14845: Stop shipping "doc/treasures" with omd
¹ This werk has been backported to Checkmk 2.4.0.