Next generation Kubernetes monitoring
Collect all the important aspects of your Kubernetes environment instantly and get a holistic view of your nodes – no in-depth Kubernetes knowledge required.

- Monitor all the key metrics of your K8s environment and detect problematic states of your applications immediately
- Identify CPU or memory bottlenecks, instabilities, and heavy consumers
- Monitor clusters, nodes, deployments, pods, DaemonSets and StatefulSets
- Receive alerts only for real issues and benefit from accurate root cause information
- Analyze the dynamic relationships in your environment thanks to expressive visualization of your data
- Navigate through all the details of your environment, from cluster down to pod level, thanks to interconnected dashboards
- Monitor Vanilla Kubernetes or Kubernetes distributions like AKS, EKS, GKE and OpenShift
Checkmk provides all the information about the health, utilization, and performance of your K8s environment.
With query intervals of <1 min and auto-discovery capabilities, Checkmk brings everything for automatic monitoring of dynamic infrastructures.
Preconfigured and smart alerts avoid false alarms and notify you only when a problem actually occurs.
Checkmk provides all contextual information in your Kubernetes environment and shows you the precise cause of problems.
Cut the complexity of Kubernetes
Keep track of your Kubernetes environment with Checkmk. The Kubernetes monitoring software brings everything you need to monitor complex and dynamic infrastructures:
- Automatic setup via Helm Charts
- Real-time monitoring of all important aspects with query intervals of <1 min
- Auto-discovery and automatic addition and deletion of containers and pods
- Automatic creation of labels for Kubernetes objects for easy customization of monitoring via the web interface
- Automatic inventory of Kubernetes object hardware and software
- Autonomous notifications of problematic states of Kubernetes objects
Check out the Kubernetes monitoring tour on our demo server:
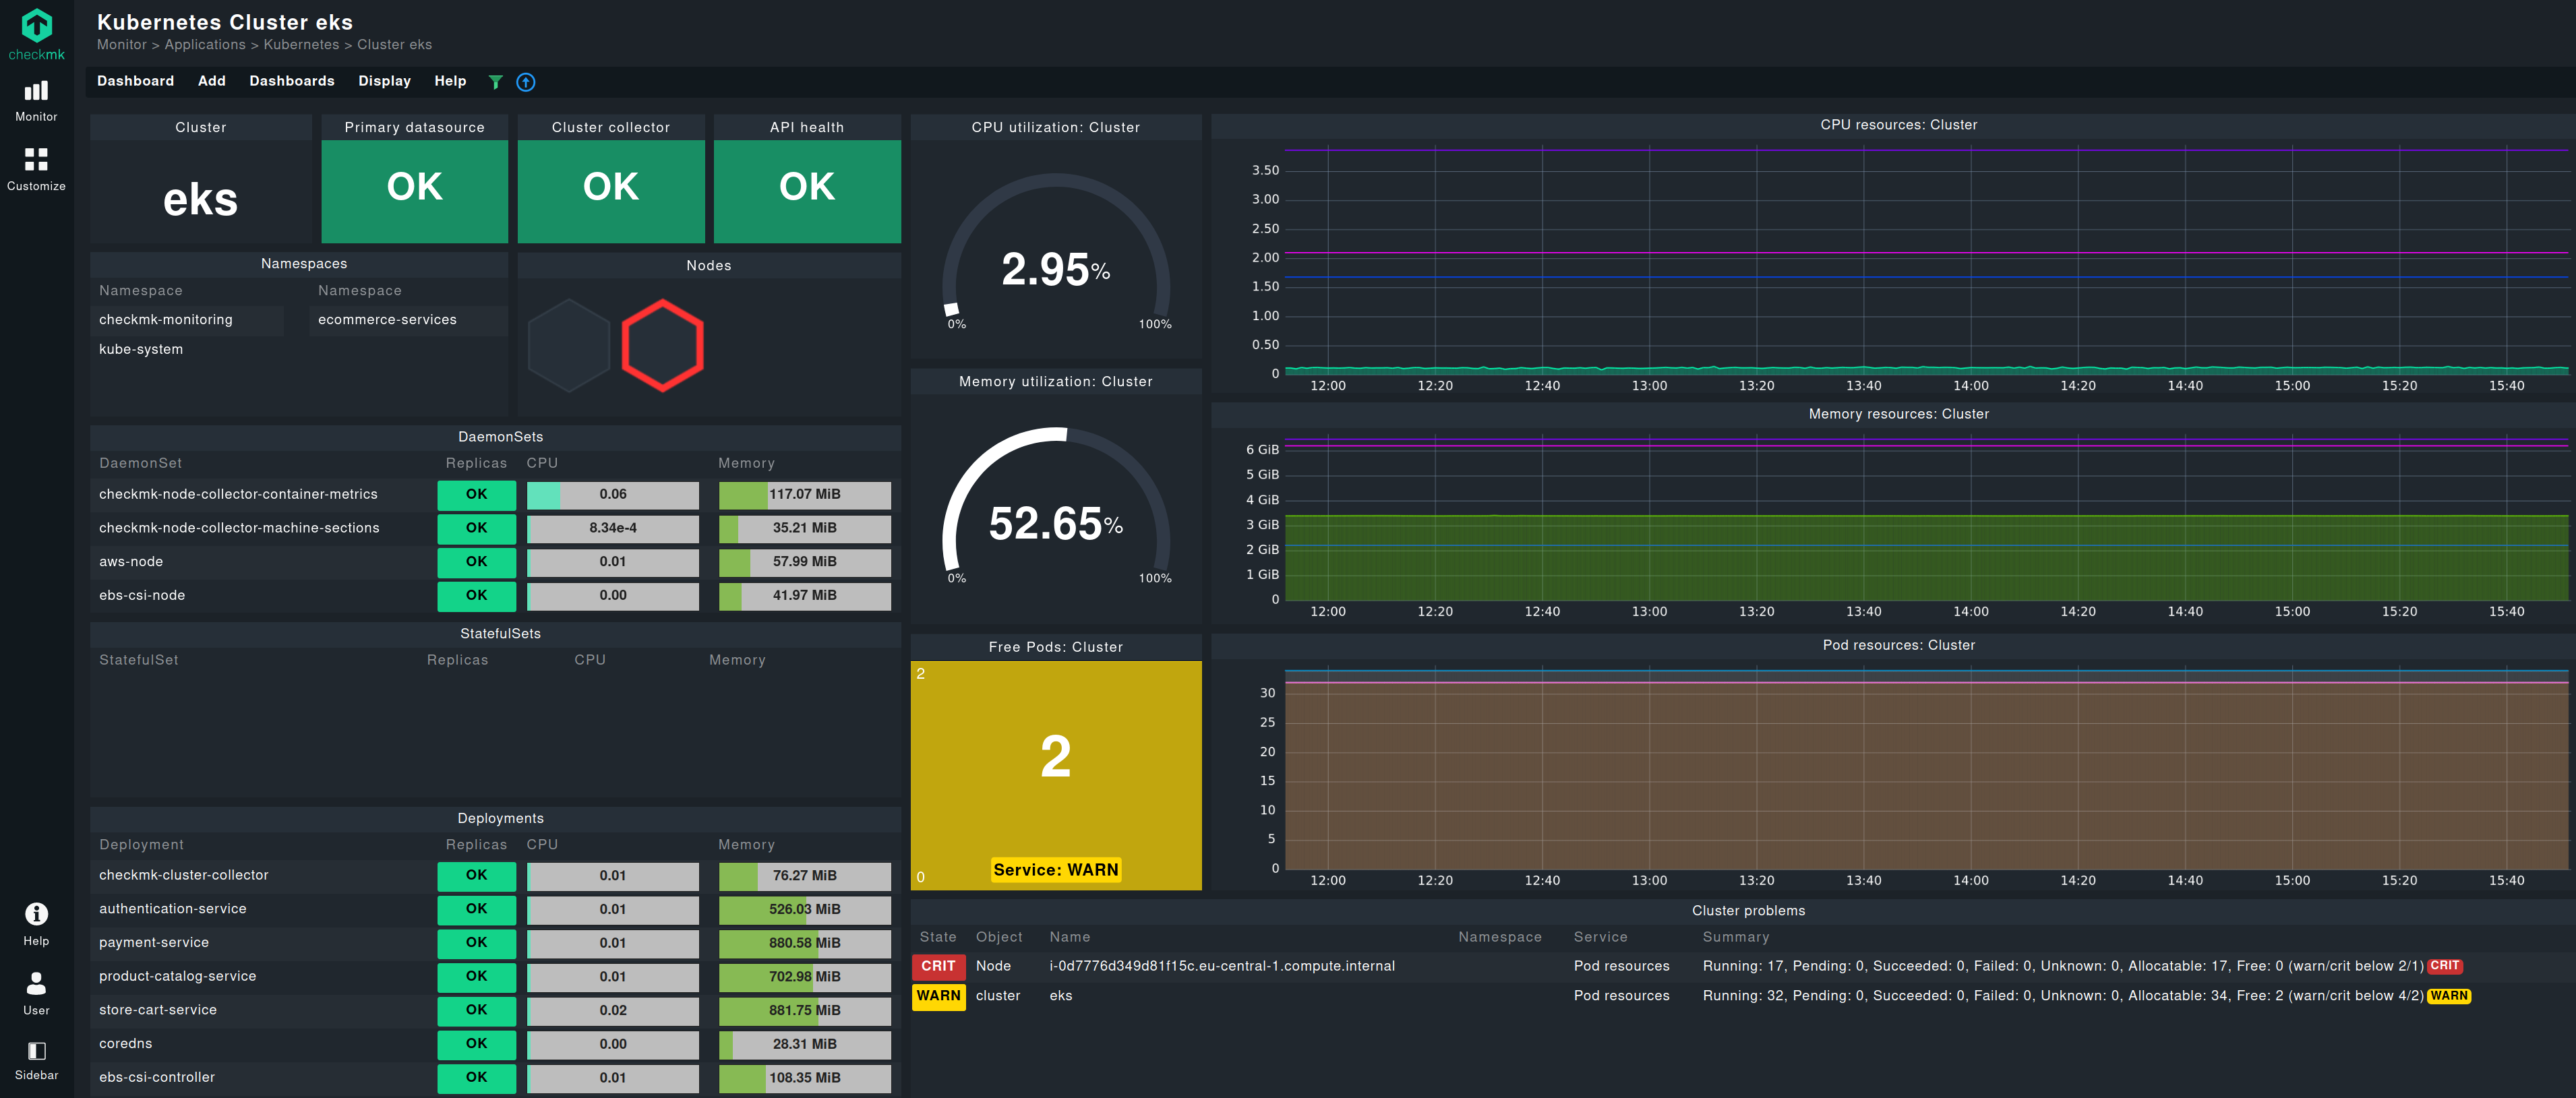
Holistic view of your K8s environment
With the Cluster Collector, Checkmk provides a holistic view of your Kubernetes environment. It gathers metrics via the API server, offering insights into the state of nodes, pods, and deployments, as well as resource consumption like CPU, memory, disk I/O, and more. By monitoring your nodes, you can also detect issues outside of Kubernetes – such as zombie processes or applications unintentionally filling up the file system.
With OpenTelemetry support in Checkmk Ultimate and Checkmk Cloud, you can now also collect custom application metrics, giving you deeper visibility into your workloads and the ability to correlate app performance with system behavior.
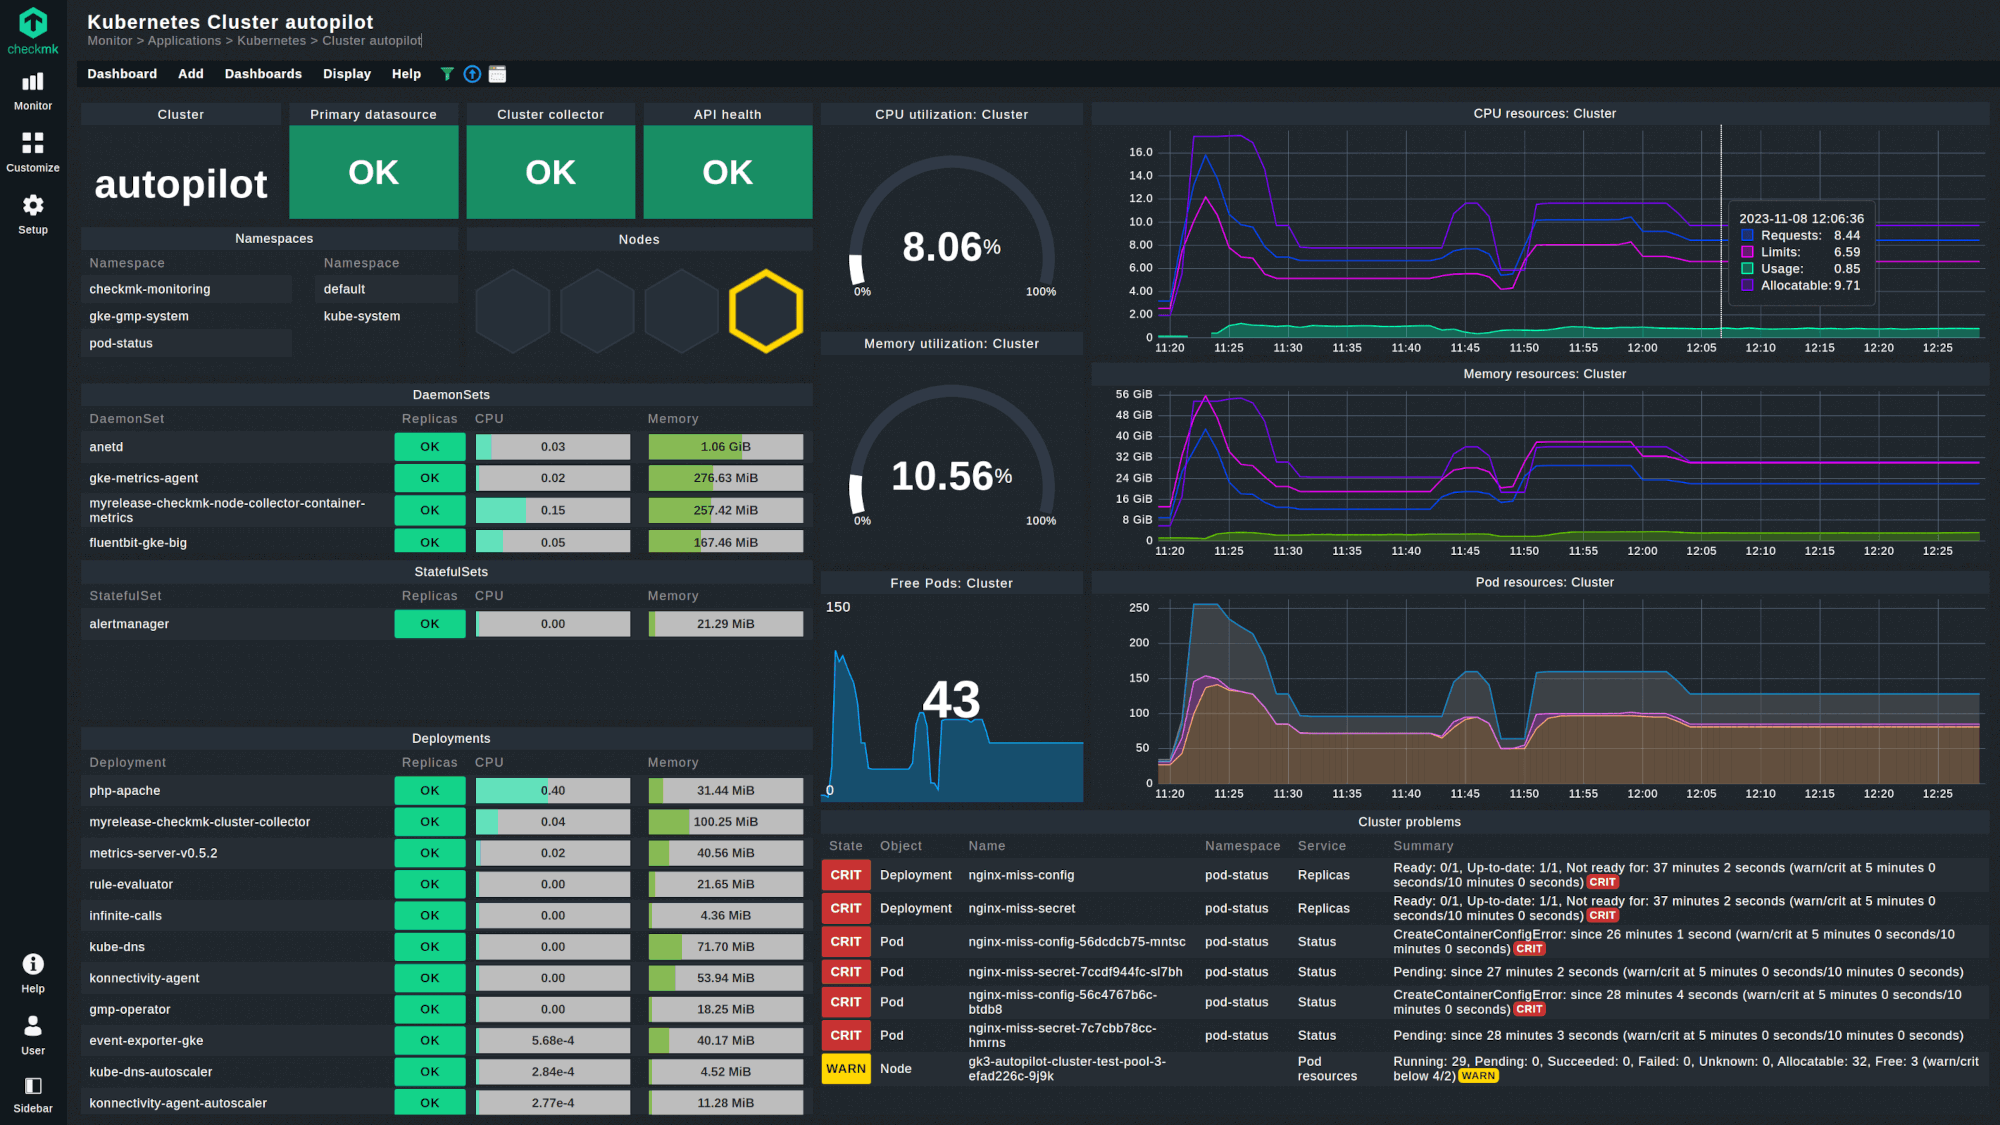
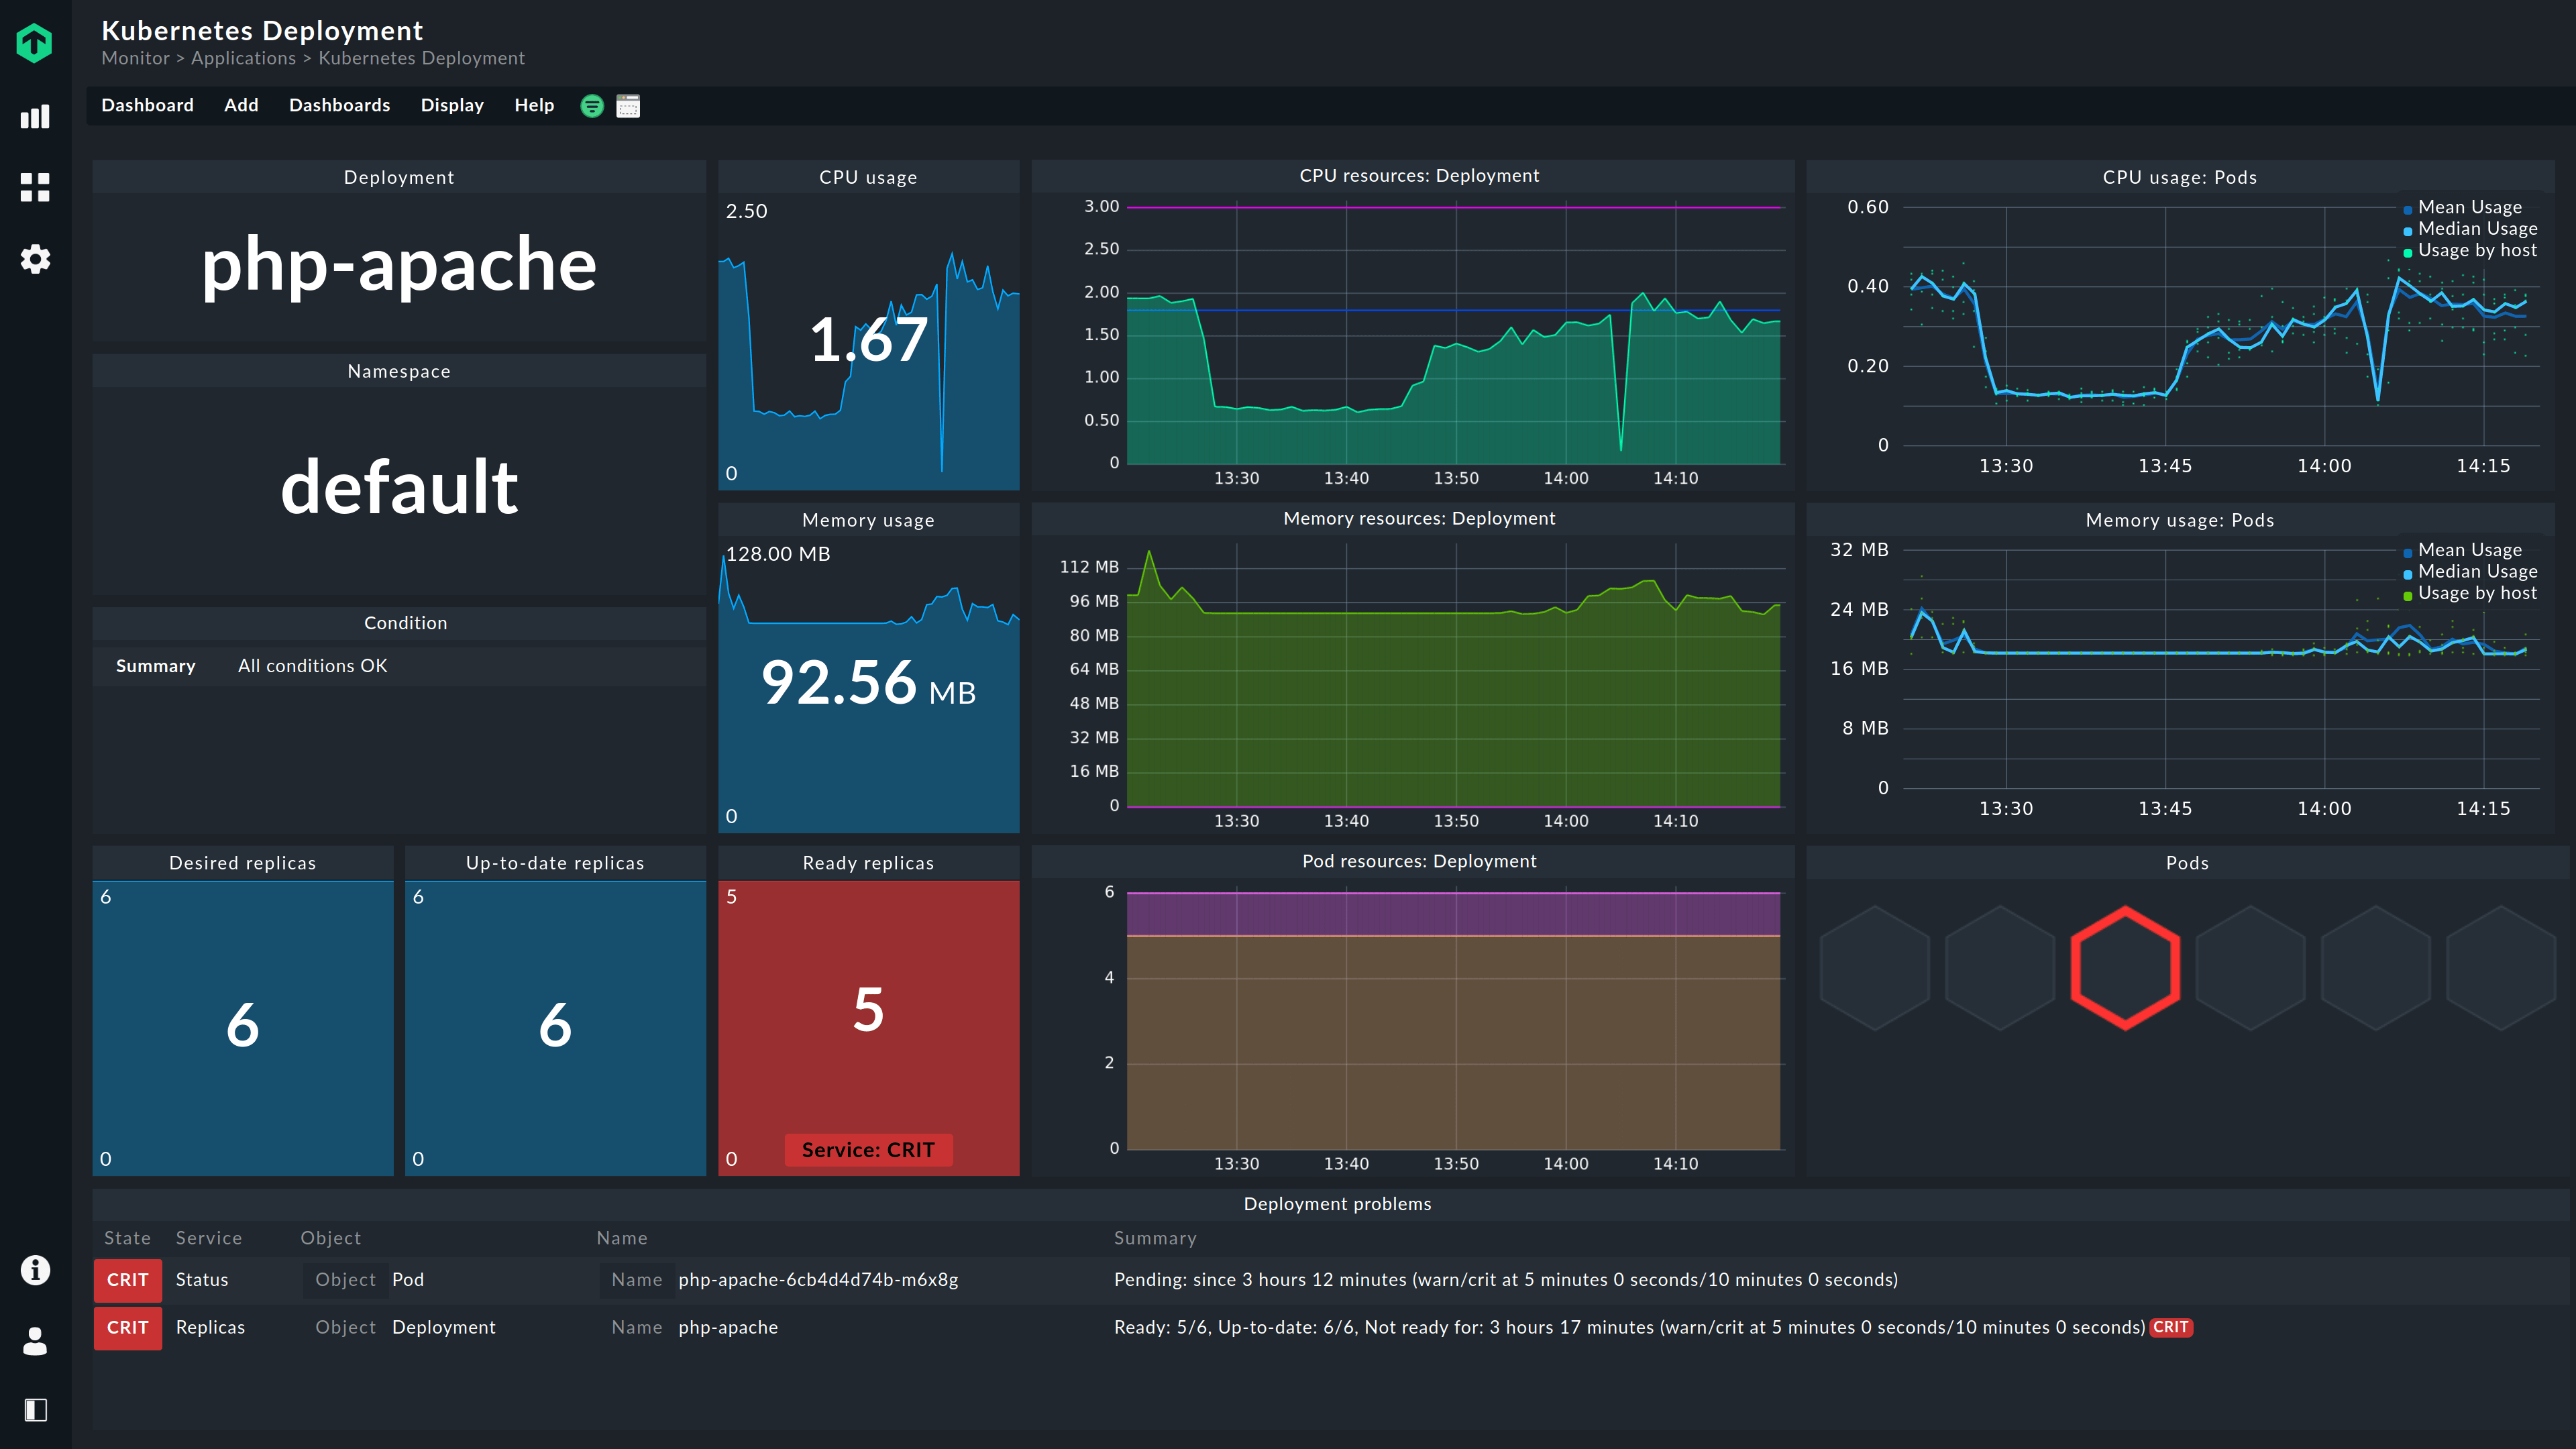
Deep insights – just a few clicks away
Checkmk comes with preconfigured and interconnected dashboards for your Kubernetes monitoring. You have all the relevant data visualized, and can access it with just a few clicks.
Let Checkmk manage the complexity of Kubernetes for you: Navigate through all the details of your clusters, nodes, and pods thanks to powerful dashboards. Identify CPU and memory bottlenecks, instabilities, or high consumers in your Kubernetes environment with one glance.
Kubernetes monitoring with Checkmk works with almost any Kubernetes setup – regardless of whether you or a provider is managing it:

Intelligent alerting for the real problems
Checkmk provides preconfigured smart alerts for each Kubernetes object, which follow a specific logic. Thanks to built-in Kubernetes expertise, Checkmk takes into account Kubernetes' self-healing and only alerts you if Kubernetes fails to repair itself within a certain period of time. This way, Checkmk avoids false alarms and only notifies you when there is an actual problem.
Thanks to the labels assigned by Checkmk, you can also customize notifications according to your needs. The labels give you maximum flexibility when adding or customizing alerts. Thus, you can easily configure alerts about CPU usage, regarding thresholds or requests.
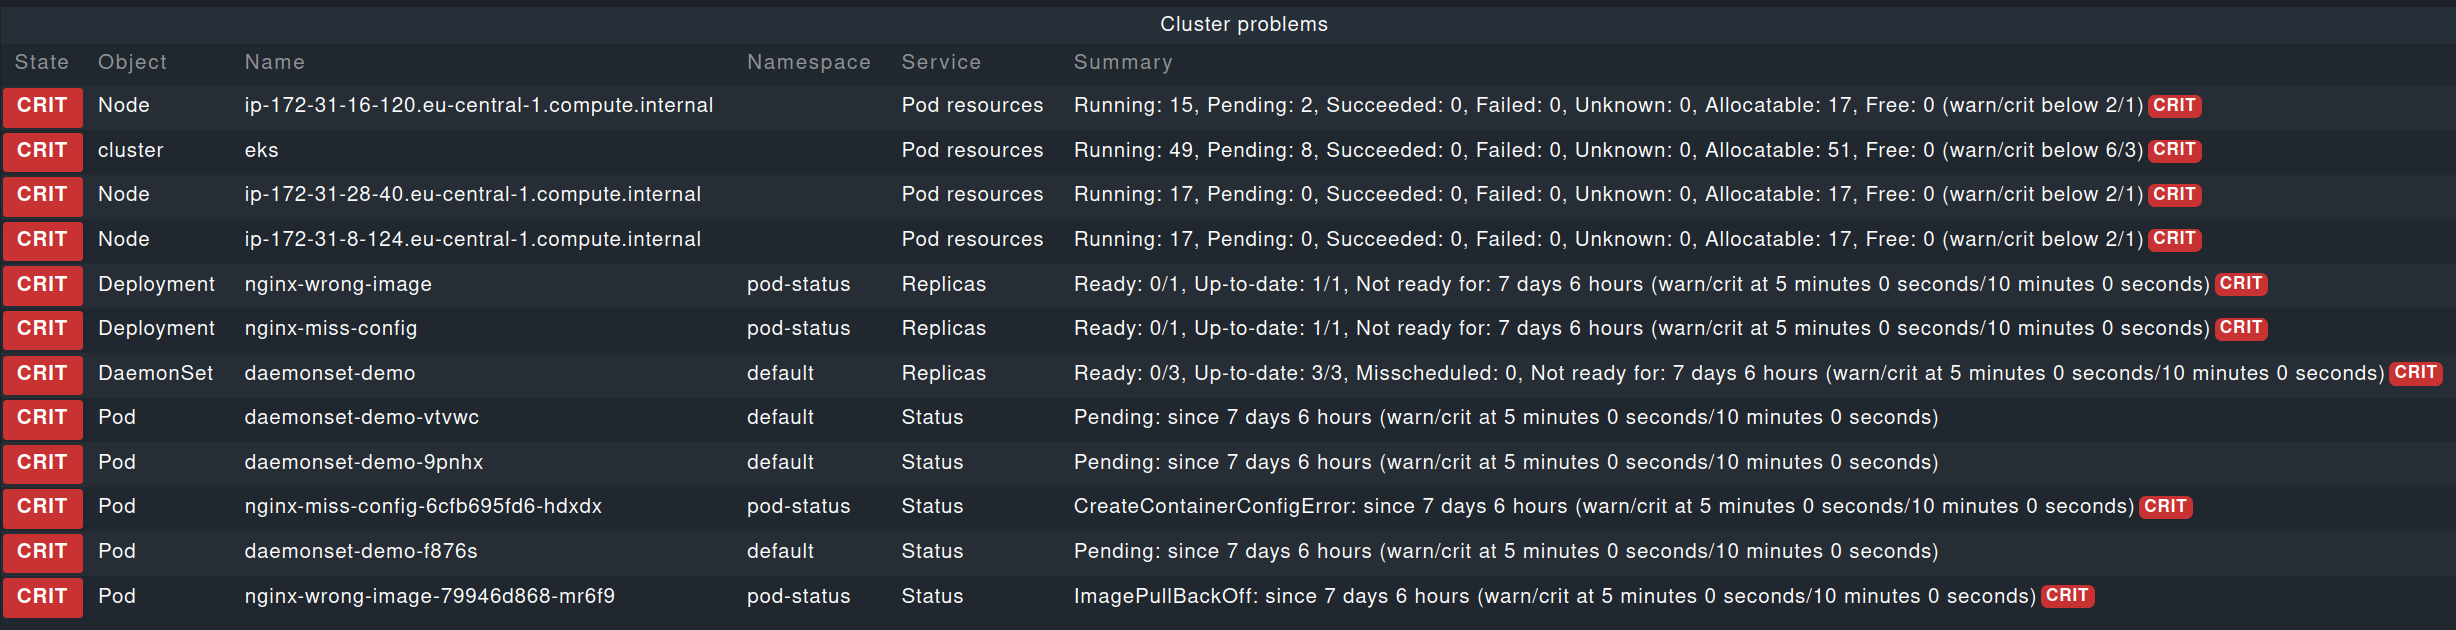
Easy root cause analysis
Checkmk combines metrics, states, and events from your Kubernetes environment in one tool. This gives you all the contextual information you need to keep your dynamic container infrastructures running smoothly. Checkmk thus not only provides you with deep insights into all aspects of your environment, but also shows you in detail where the root cause of problems lies.
For example, if a pod is not running, Checkmk knows which container is causing the problem and with which error.
Trusted by global brands and local organizations worldwide


Resources
Try it yourself
Talk to us
Learn more about Checkmk
Ready to explore the full feature set of Checkmk?
Download the free trial and see it in action.