Network Flow Monitoring
Get to know the trends, top talkers, and highlights of your network traffic. Thanks to the ntopng add-on for Checkmk it is now possible to inspect packets and network flows with one tool
Discover your network flows
Discover your top talkers, bottlenecks, and suspicious traffic with the network flow info in one single tool.
Gather deeper insight from your networks
Collect in-depth info about your network traffic to extend your monitoring coverage.
A complete network monitoring solution
Analyze how your networks are used with custom views and dashboards, for a complete network flow monitoring system.
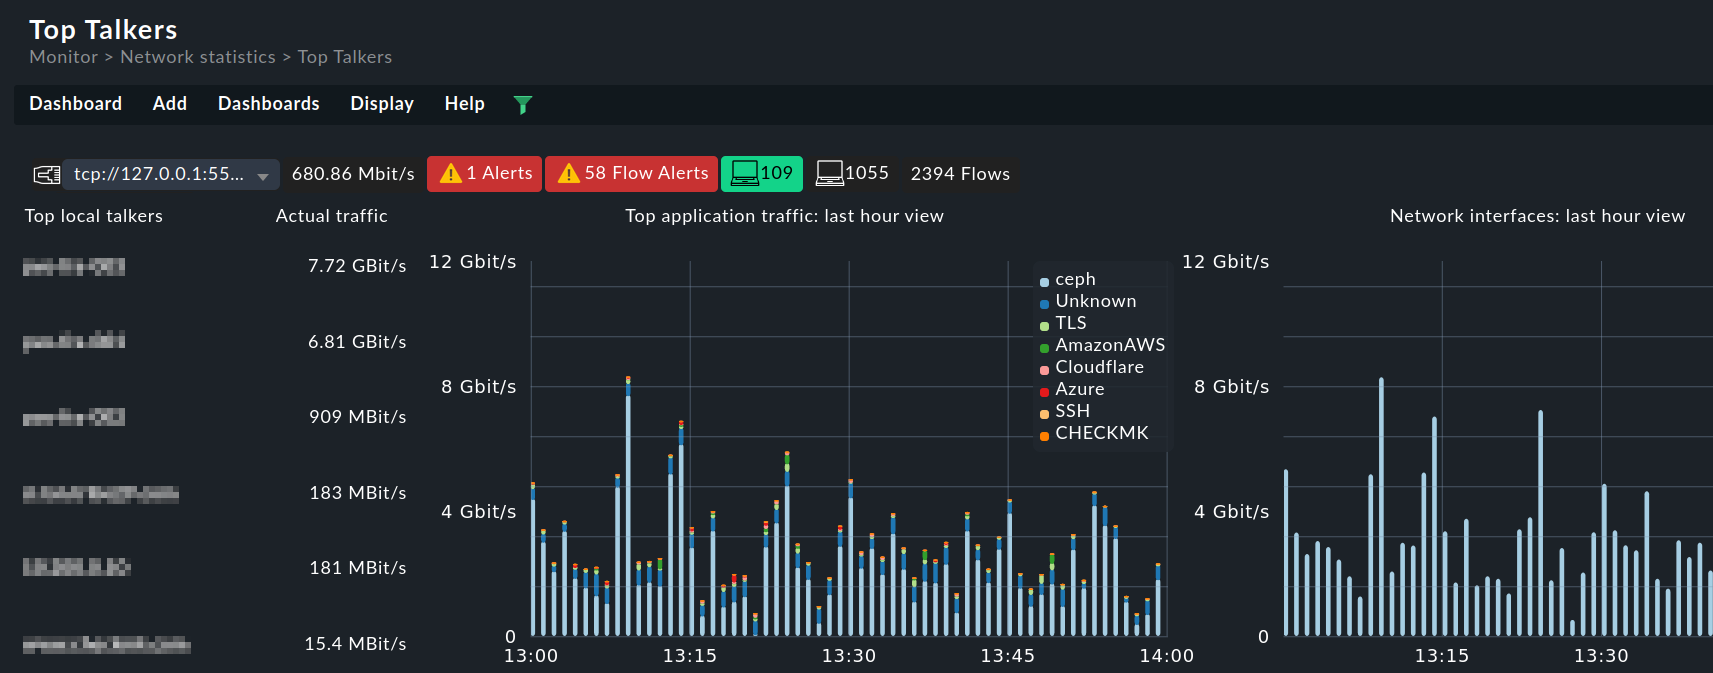
Network flow monitoring with ntopng
Discover how your network is utilized, pinpoint potential security threats, and enhance your visibility into network activities with a network flow monitoring tool. Network flows give you insights on the who, what, when, and how much of your traffic.
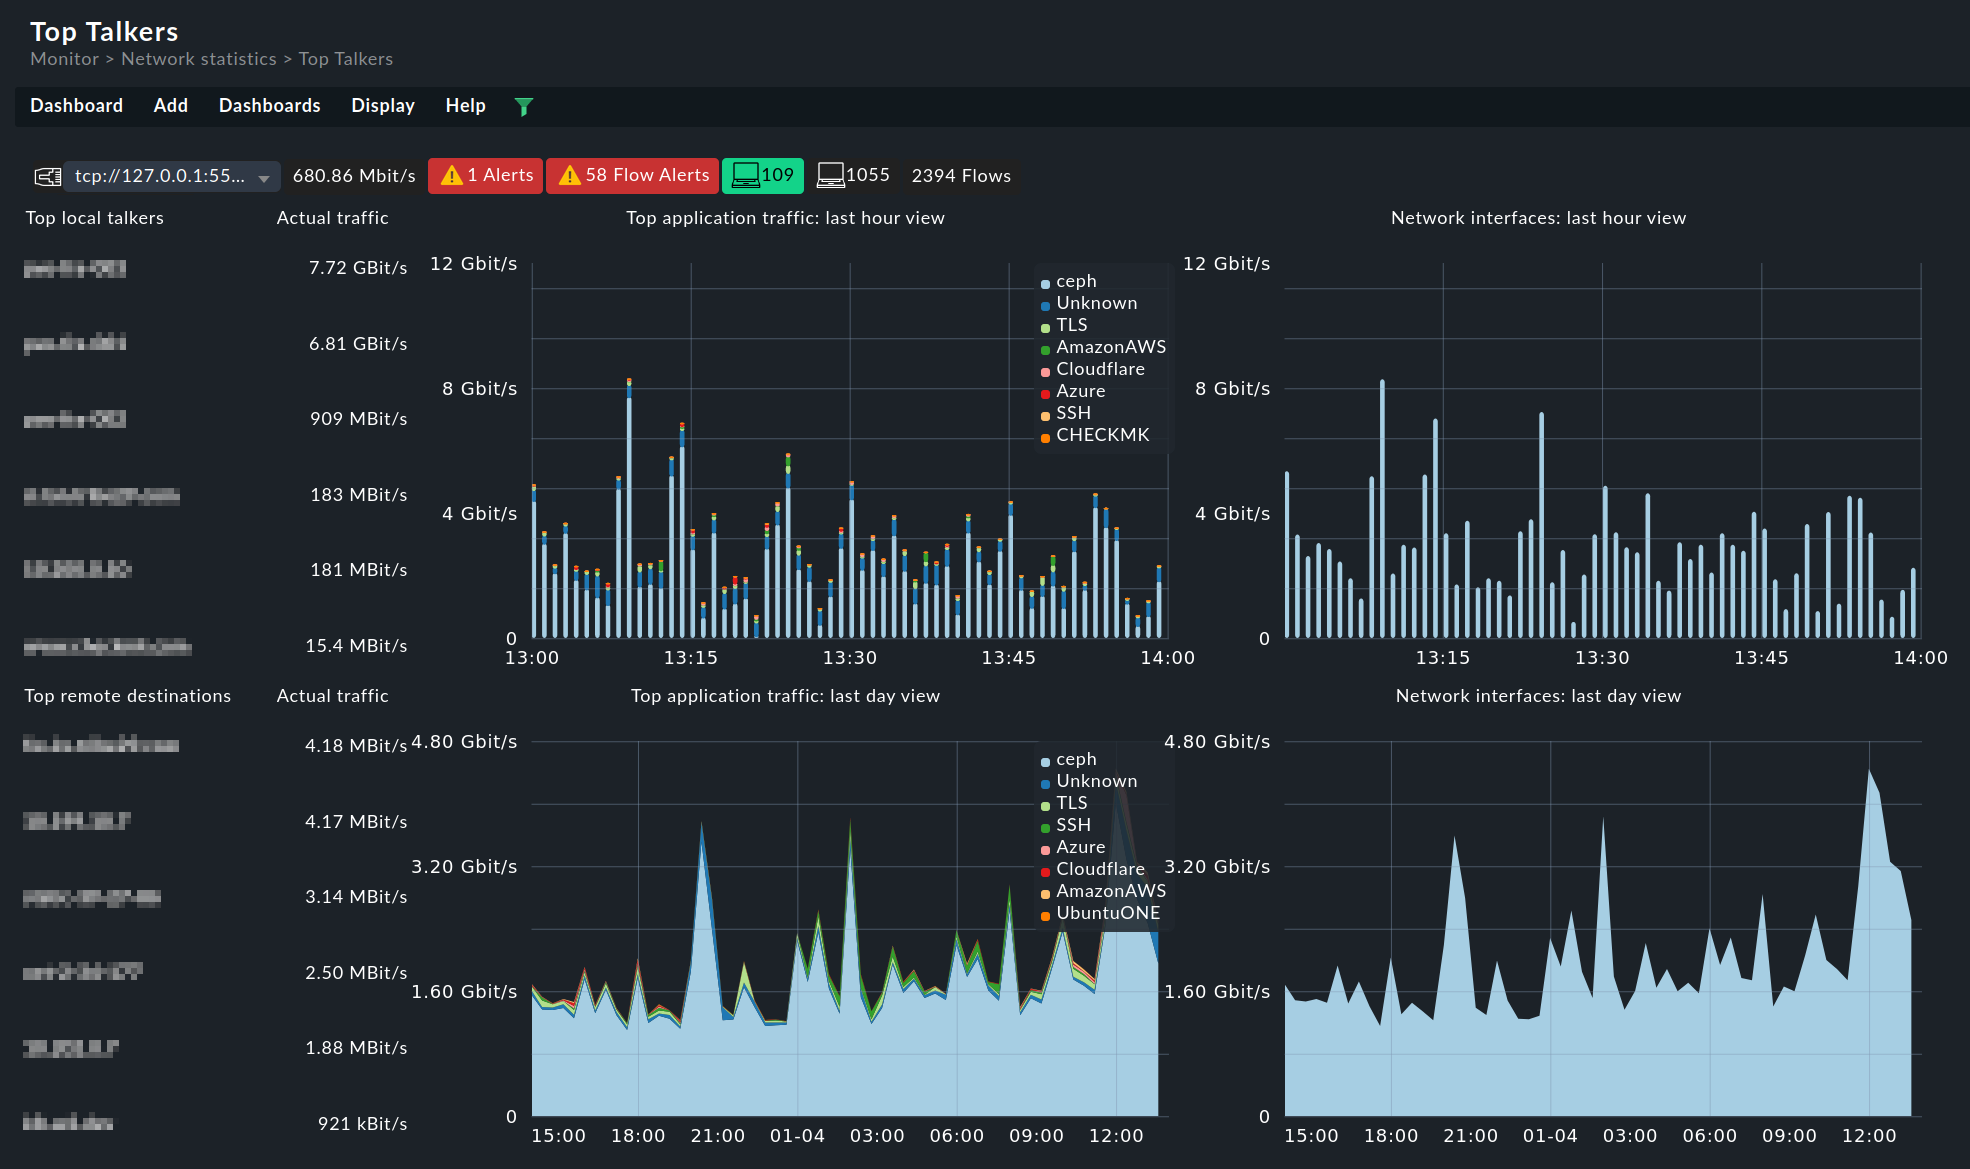
- Identify the top talkers in your network
- Spot traffic trends, and prevent network congestion
- Identify suspicious network traffic
- Detect possible bottlenecks, to prevent downtimes
- Make sure capacity is never reached with the network flow data insight
- Improve user experience by troubleshooting slowdowns, spikes, and network overuse
The ultimate network flow monitoring tool
Get the ultimate network monitoring solution, with the ntopng add-on available in Checkmk commercial editions.
- Gain insight within minutes, with most network devices already being NetFlow- or IPFIX-ready
- Allow for advanced reporting on traffic: from historical bandwidth usage to recent top services
- Heighten cybersecurity protection, easily spot anomalies and breaches
- Use deep packet inspection for more granular information
- Be alerted of any changes with the powerful Checkmk notification system

Probe into your network usage for deeper insight
Harness the network data acquisition capabilities of ntopng with its probes and collectors, all accessible through the user-friendly Checkmk UI.

- Support multiple flow protocols (NetFlow, sFlow, and IPFIX)
- Get more features thanks to plug-in extensibility
- Convert flow data between different protocols and their versions
- Get deep packet inspection with the nDPI open-source library
- Inspect over 240 types of traffic protocols
- Visualize flow data via web UI or export it elsewhere (Kafka, databases, syslog, JSON or pure text)
Interested in network flow monitoring with Checkmk?
Integrate ntopng into Checkmk and extend your network monitoring.