Deep Application Observability
Full-stack monitoring and application observability in one platform. Cross-analyze application telemetry with the infrastructure it runs on so you can troubleshoot faster and resolve incidents before they escalate.

Trusted by industry leaders worldwide
The reality of modern applications in hybrid environments
Modern applications span across microservices, Kubernetes, and managed services. Dependencies shift constantly. When something breaks, it ripples across layers.
- Impact is hard to pinpoint: Infrastructure health doesn't translate to service health, leaving teams blind to where the actual failure resides.
- Telemetry lives in silos: Disconnected monitoring stacks for infrastructure, applications, and user experience drift apart over time.
- Legacy apps are hard to observe: Legacy applications remain a mystery as teams can't risk the code changes required for manual instrumentation.
- High alert noise: Alert fatigue sets in when notifications trigger on raw metrics rather than actionable symptoms.
- Ownership gets blurry: A lack of mapping between services, signals and owners turns every incident into a chaotic search for the right on-call engineer.
Unified visibility across the application stack
Checkmk bridges the gap between raw metrics and rapid resolution by offering a single pane of glass that translates complex signals into actionable insights across the entire stack.
Connect telemetry to infrastructure
Connect application telemetry to the infrastructure it runs on — including legacy Java/.NET apps, without requiring code changes.
Unified workflows and alerting
Apply one ruleset and one notification workflow across all application and infrastructure signals.
Built for distributed environments
Drive performance with high-cardinality metrics that support fast-changing, ephemeral workloads like Kubernetes.
How application observability works
Checkmk connects application telemetry to IT operations in four steps:
- Ingest telemetry: Receive OTLP metrics from auto-instrumented apps and scrape Prometheus exporters.
- Collect at scale: Store telemetry in a performance-optimized metrics backend for fast exploration.
- Map to operations: Attach metrics to hosts and services to define ownership and routing context.
- Act from one platform: Analyze, alert, and troubleshoot from one place, all with a unified logic.
From application telemetry to actionable alerts
Telemetry creates value when it drives reliable alerts and repeatable workflows.
- Service-level alerting: Map metrics to services and hosts. Alert on industry standard performance signals.
- Centralized routing: Send alerts to the right team with clear ownership and escalation paths.
- Faster troubleshooting: Cross-analyze across the different layers of your stack instead of switching tools.
- Less overhead: Avoid building and maintaining separate stacks for metrics, alerts, and dashboards.
Explore telemetry without complex queries
Turn raw telemetry into practical, context-rich visualizations with a queryless interface.
- Queryless exploration: Build context-rich views without needing any specialized query language like PromQL.
- Rapid validation: Test hypotheses fast to spot trends and narrow the blast radius.
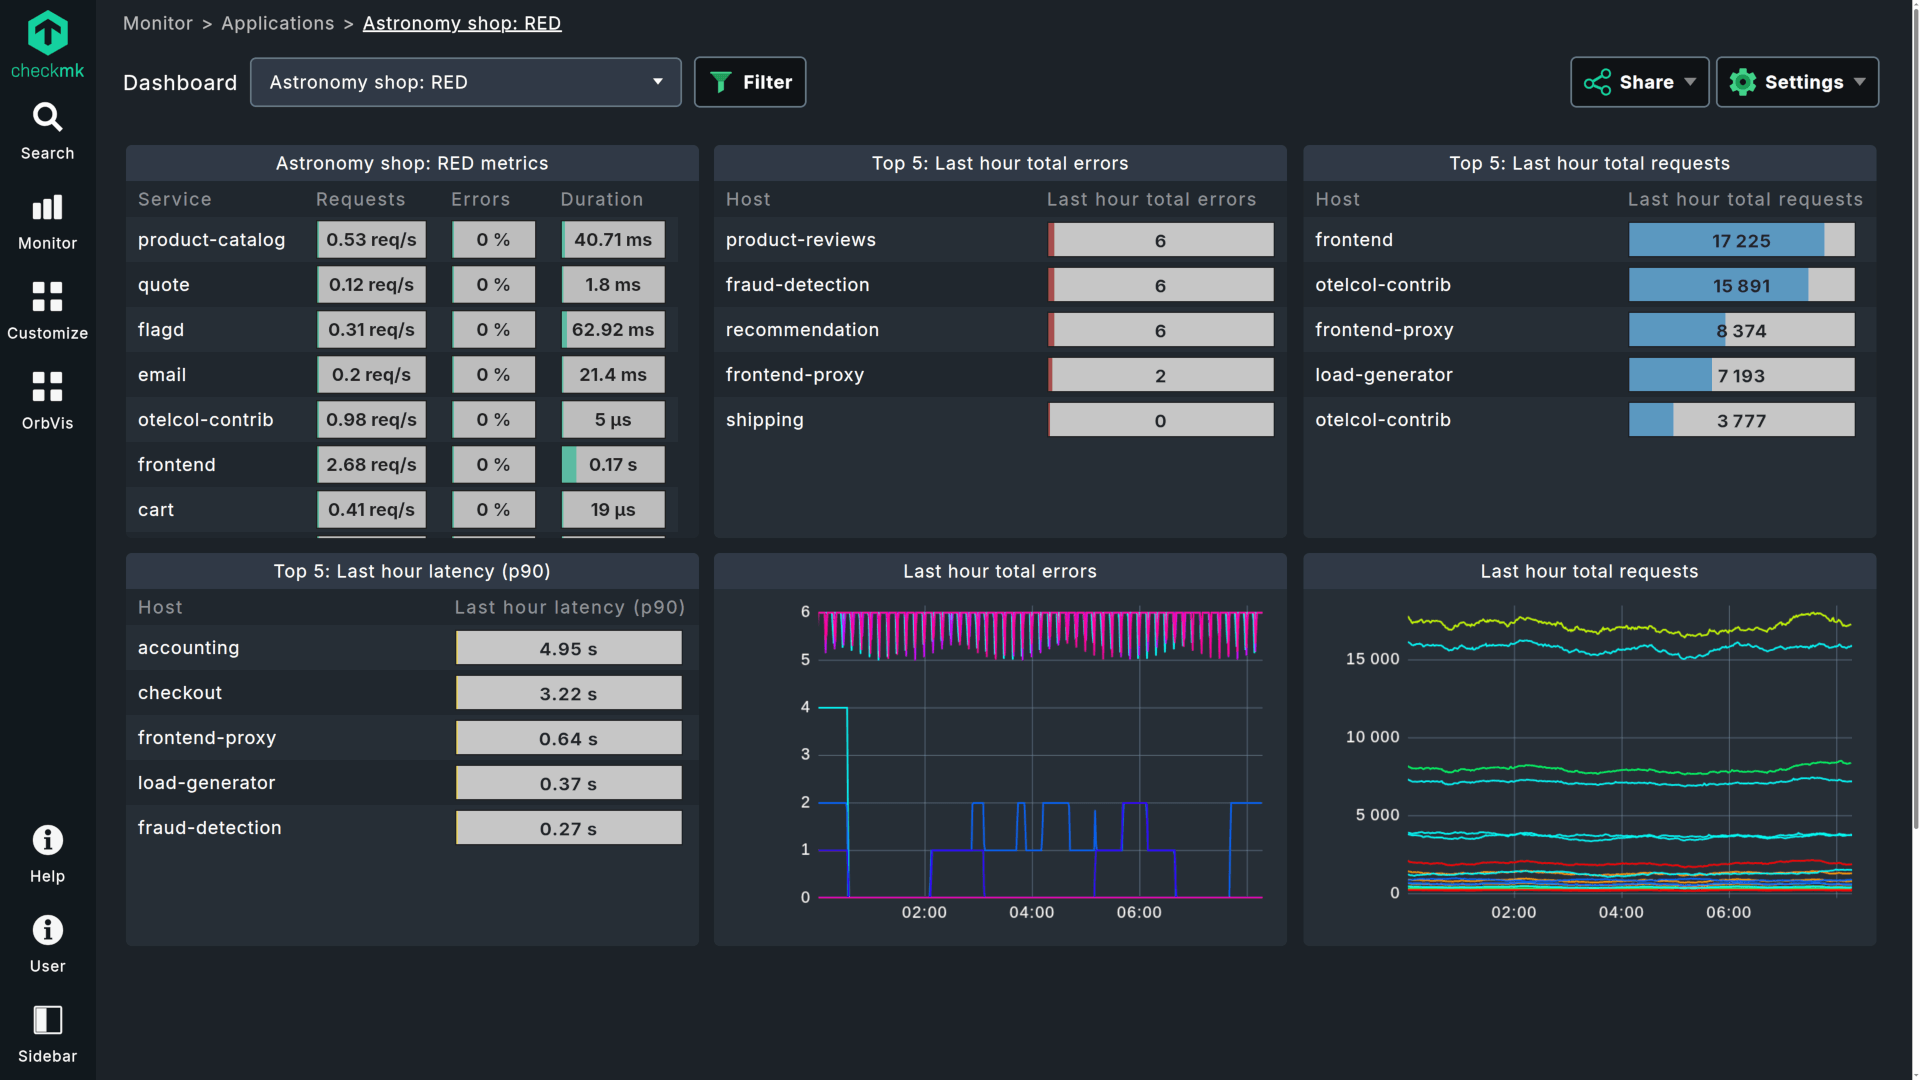
- Ready-made dashboards: Get started instantly with pre-built, customizable dashboards including for RED / golden signals.
- Accessible for operations teams: Useful for generalists. Powerful for experts.
A pragmatic alternative to APM suites and DIY stacks
APM/observability suites often...
- Optimize for deep code-level debugging and broad signal types.
- Add cost and platform complexity across teams.
- Require separate operational workflows and heavy rollout work.
DIY Prometheus/Grafana stacks often...
- Create ongoing maintenance work — storage, scaling, retention, upgrades.
- Fragment alert rules and ownership across tools.
- Make correlation with infrastructure context harder.
Checkmk instead...
- Delivers OpenTelemetry-based application observability inside the same platform.
- Uses one alerting and notification engine across the entire stack.
- Cuts setup effort and speeds up time-to-value with ready-to-use dashboards and a unified rules engine.
Built to scale for real-world IT operations
Application observability must hold up under load — across platforms, teams, and environments.
- High-performance ingestion and exploration: Ingest telemetry at scale and query metrics fast.
- High-cardinality resilience: Tags and dimensions stay usable in distributed environments.
- Service-level context at scale: Tie metrics to the right service across multiple instances.
- Automation-first operations: Onboard faster. Discover services reliably. Reduce manual work.
- Hybrid-ready coverage: Operate across on-prem, cloud, and container platforms (Kubernetes).