Checkmk 2.5 unifies monitoring and observability to speed issue resolution across hybrid environments
Share this press release over social media
Munich, April 28, 2026 – Checkmk, a leading provider of hybrid IT monitoring and observability, connects infrastructure monitoring with application observability to deliver a unified view of system and application performance with the launch of version 2.5. Metrics from both layers can now be analysed and triaged from a unified interface enabling IT teams to directly identify dependencies across the entire IT stack—from legacy systems to microservices—and resolve issues faster.
Building on this unified approach, Version 2.5 expands the platform with additional functions that enable IT teams to reduce operational effort and respond quicker to incidents. Among these key additions, Checkmk integrates Checkmk Relay for lightweight, maintenance-free monitoring of remote networks and enhances Checkmk Cloud with AI-powered alert analysis.
In today’s hybrid IT environments, applications span on-premises, cloud, and container platforms, creating blind spots and extra overhead from using multiple tools. That’s why we extended Checkmk to an integrated observability platform that provides full context into applications and infrastructure. By eliminating tool-switching, IT teams can pinpoint and resolve issues directly, reducing MTTR and lowering total cost of ownership.
Application observability with OpenTelemetry
The platform collects application metrics via OpenTelemetry (OTLP) or Prometheus and automatically links them to the corresponding infrastructure hosts for cross-analysis—without additional middleware. A powerful data backend enables near real-time analysis of high-volume metrics, letting IT teams cross-analyze issues such as rising response times with CPU, I/O, or network bottlenecks. This turns application anomalies into actionable insights for faster troubleshooting.
Visibility is not limited to modern architectures. Custom or legacy applications, including Java and .NET workloads, can be integrated via auto-instrumentation without modifying source code. OpenTelemetry also extends visibility into AWS, GCP, and Azure services beyond vendor APIs.
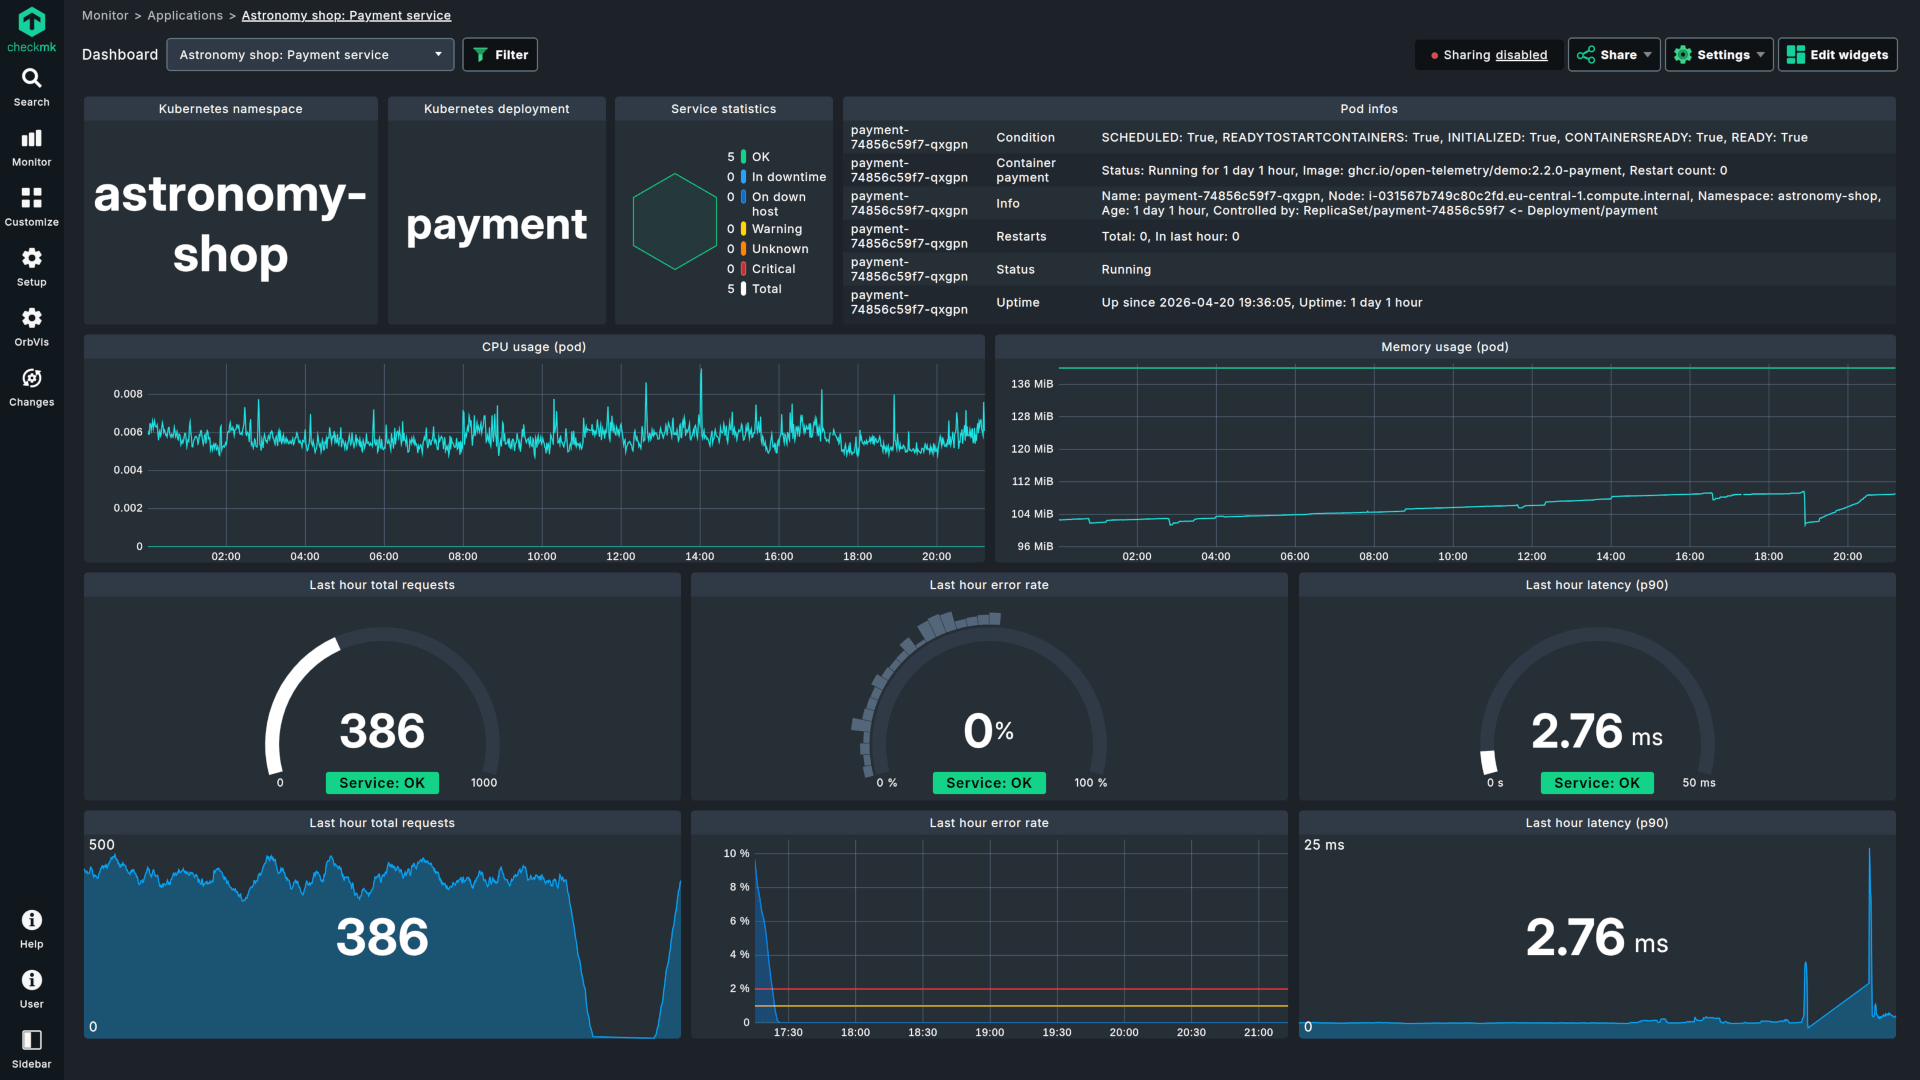
Pre-configured dashboards track key application health signals using the RED metrics: Rate (requests), Errors (failed requests), and Duration (latency). This enables faster detection of user-impacting incidents and prioritization of resolution.
Simplified remote monitoring with Checkmk Relay
Checkmk 2.5 introduces Checkmk Relay for lean and highly secure monitoring in remote offices and segmented networks. The lightweight container transmits locally collected data outbound only (Zero Inbound) and mTLS-encrypted to the central Checkmk instance, eliminating the need for inbound ports or complex firewall rules.
In smaller environments, Checkmk Relay can replace full remote sites, significantly reducing operational effort. For Checkmk Cloud users, it also extends monitoring to SNMP devices such as NAS systems and printers, enabling full-stack monitoring across hybrid IT environments.
AI-powered alert analysis
For users of the Saas edition Checkmk Cloud, the “Explain with AI” feature accelerates alert analysis by translating alerts into clear assessments of potential root causes. Administrators receive immediately actionable insights, helping them respond faster in critical situations. The function also generates readable incident summaries, improving documentation and cross-team communication.
Deep insights into Microsoft Azure and enhanced virtualization support
Checkmk 2.5 delivers enhanced visibility across Microsoft Azure environments with new dashboards powered by integrated metadata. This enables faster, more actionable insights across even highly complex cloud infrastructures. By natively mapping Azure tags into Checkmk labels, the platform provides seamless navigation across multi-subscription environments and improves data retrieval performance by up to 60%. New dedicated checks for Redis Cache, Cosmos DB, and NAT Gateways extend coverage across critical cloud services, closing critical visibility gaps and ensuring end-to-end visibility across the digital environment.
Checkmk 2.5 also enhances virtualization support. New checks for Proxmox provide visibility into CPU and memory overcommitment and cluster health via Corosync, allowing resource bottlenecks to be identified early. In Hyper-V, VM configurations and integration services can now be monitored, improving virtual machine availability. Support for Podman is also extended.
The new release further streamlines IT operations with improvements to dashboards, the user interface, synthetic monitoring, and APIs.
Media contact
Heike Link
heike.link@checkmk.com
Phone: +49 159 06546526
About Checkmk
Checkmk's mission is to enable IT infrastructures and applications to run in any organization at peak performance. That’s why we built Checkmk, the monitoring platform for every aspect of modern IT environments.
Checkmk is the platform of your open observability ecosystem. It combines enterprise-grade scalability and security with the extensibility of open source software. It integrates seamlessly with other enterprise applications and provides powerful features to automate monitoring workflows.
Tens of thousands of users in more than 50 countries rely on Checkmk to ensure high availability and best performance of their systems. With Checkmk, organizations prevent issues before they happen or trigger fast remediation actions when failures occur.