The limits of native virtualization monitoring
Virtualization monitoring isn’t limited to checking whether virtual machines are running. It requires how virtual machines, hypervisors, hosts, storage, networks, guest operating systems, and services interact across the infrastructure.
Native tools built into virtualization platforms are essential for managing virtual machines and their environments. But visibility is usually limited to that platform.
This becomes a major operational friction point when organizations deploy secondary platforms to optimize costs or isolate specific workloads. Using multiple platforms means having to rely on multiple native tools that do not talk to each other. Reliable performance monitoring for virtualized environments requires a broader layer that connects platform data with guest OS data, infrastructure metrics, historical data, and actionable alerts.
TL;DR:
- Effective monitoring requires a unified approach that correlates platform metrics, guest OS data, storage, and network performance.
- Native platform tools for VMware or Proxmox are essential for management but lack cross-platform visibility and deep guest-level insights.
- A comprehensive, unified view reduces tool silos, enables predictive capacity planning, and significantly improves operational troubleshooting across the entire virtualized infrastructure.
Virtualization makes infrastructure more flexible but it also adds abstraction
Virtual machines can be created quickly, migrated live, resized, consolidated, backed up, cloned, and removed. At the same time, virtual machines depend on shared CPU, memory, storage, network paths, hypervisors, clusters, and physical hardware.
That flexibility makes virtual infrastructure harder to monitor. A virtual machine may appear healthy in a native platform dashboard while users still report performance issues. The problem may sit inside the guest OS, on the host, in the storage layer, in the communication between VMs on the same physical host, or somewhere in the network path outside the hypervisor.
Native tools aren’t equipped to provide one operational view across the full data center. That is why virtualization monitoring needs to connect the virtual layer with the physical infrastructure beneath it — from hypervisors and hosts to storage, networks, and guest operating systems.
What effective virtualization monitoring needs to cover
Getting better visibility into virtualized environments does not require replacing your existing tools. It requires collecting the right data, mapping relationships correctly, and turning performance metrics into alerts, graphs, and trends.
Collect data from multiple layers
Effective virtualization monitoring needs visibility from the layers that affect virtual machine health and performance, including:
- Hypervisors and host servers – CPU ready time, memory utilization, memory ballooning, host swap, overcommitment, node health, and cluster health.
- Virtual machines and guest operating systems – CPU, RAM, partitions, file systems, processes, services, guest swap, logs, and OS-level network data.
- Storage – Utilization, datastore latency, disk IOPS, read/write throughput, snapshots, replication, and capacity usage.
- Network – Throughput, packet loss, latency, retransmissions, virtual switch behavior, NIC saturation, and East-West traffic between VMs on the same physical host.
This shows why VM monitoring cannot stop at the VM itself. Teams also need visibility into the hosts, storage, networks, and platform layers that influence VM health and performance.
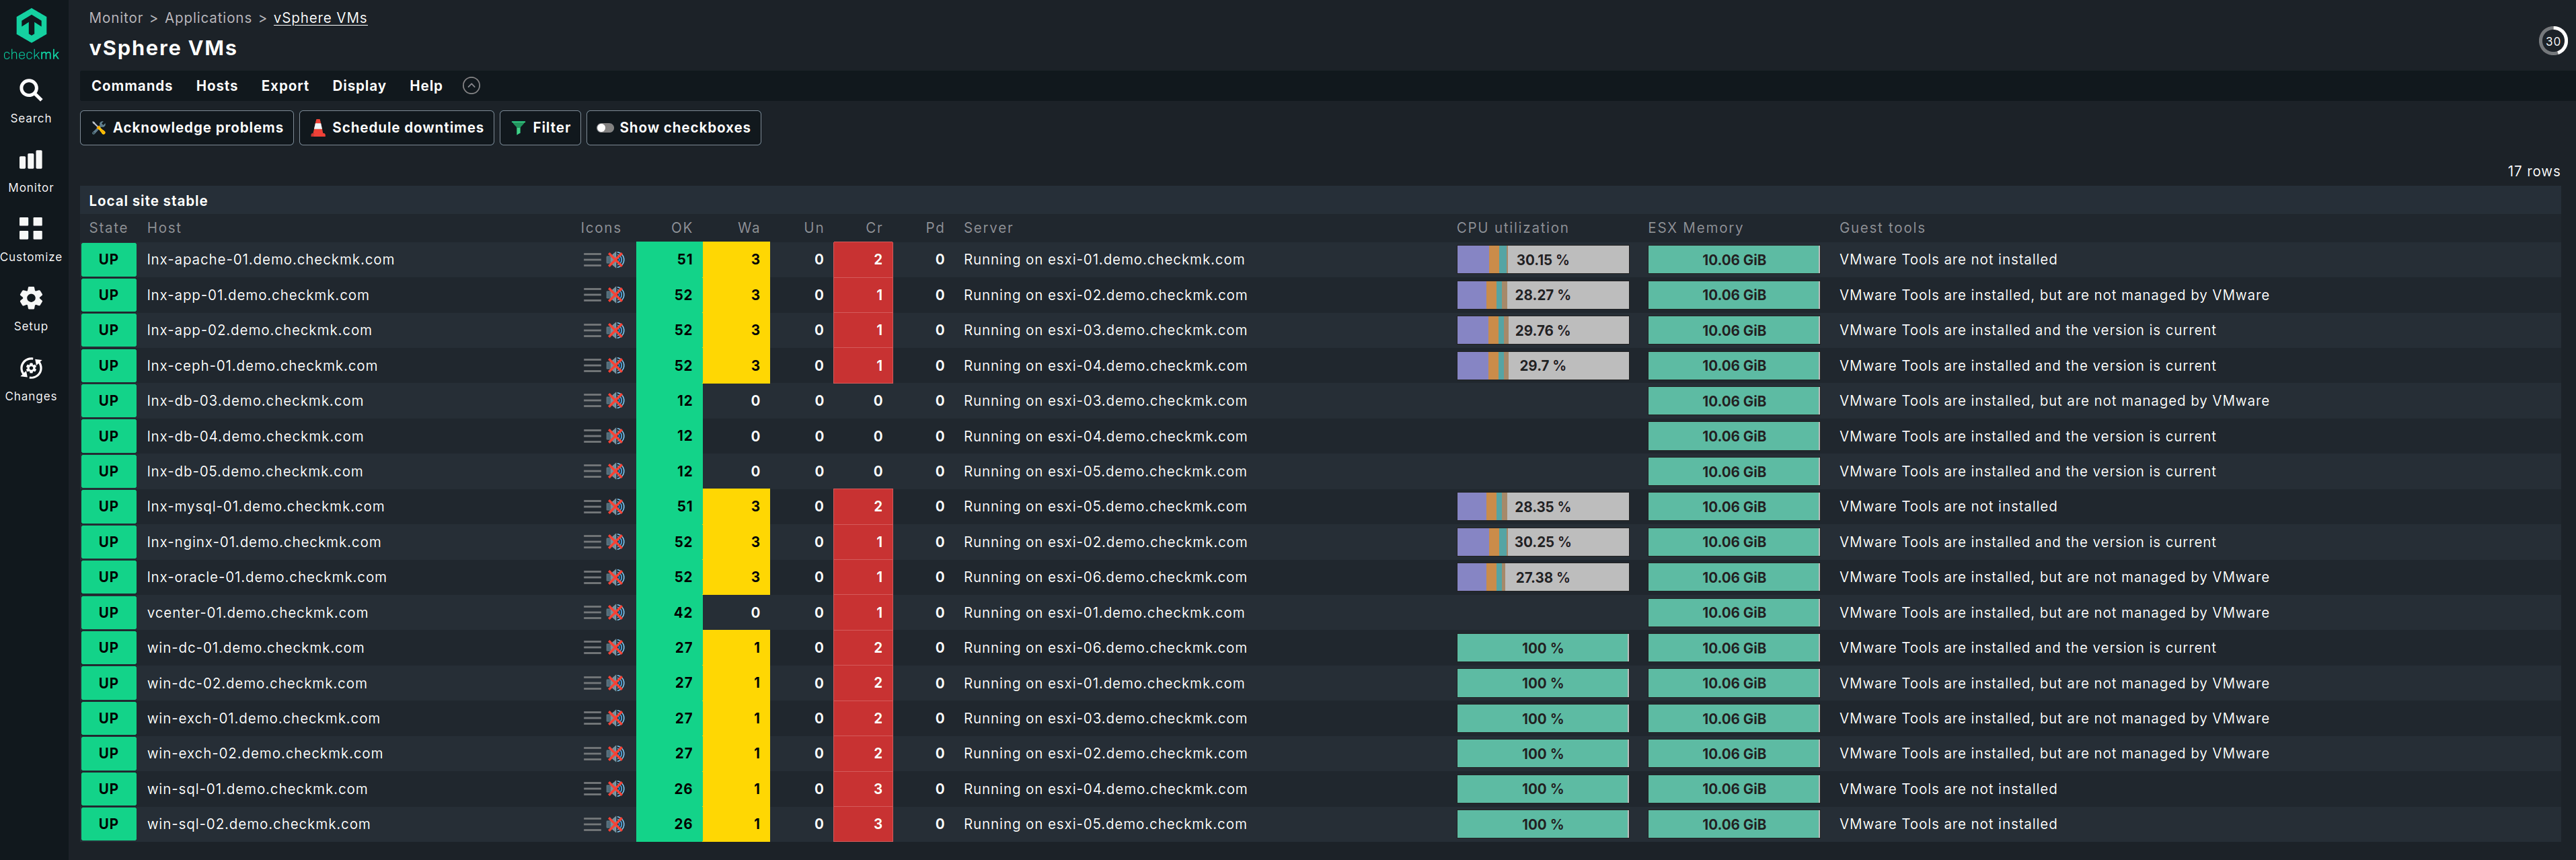
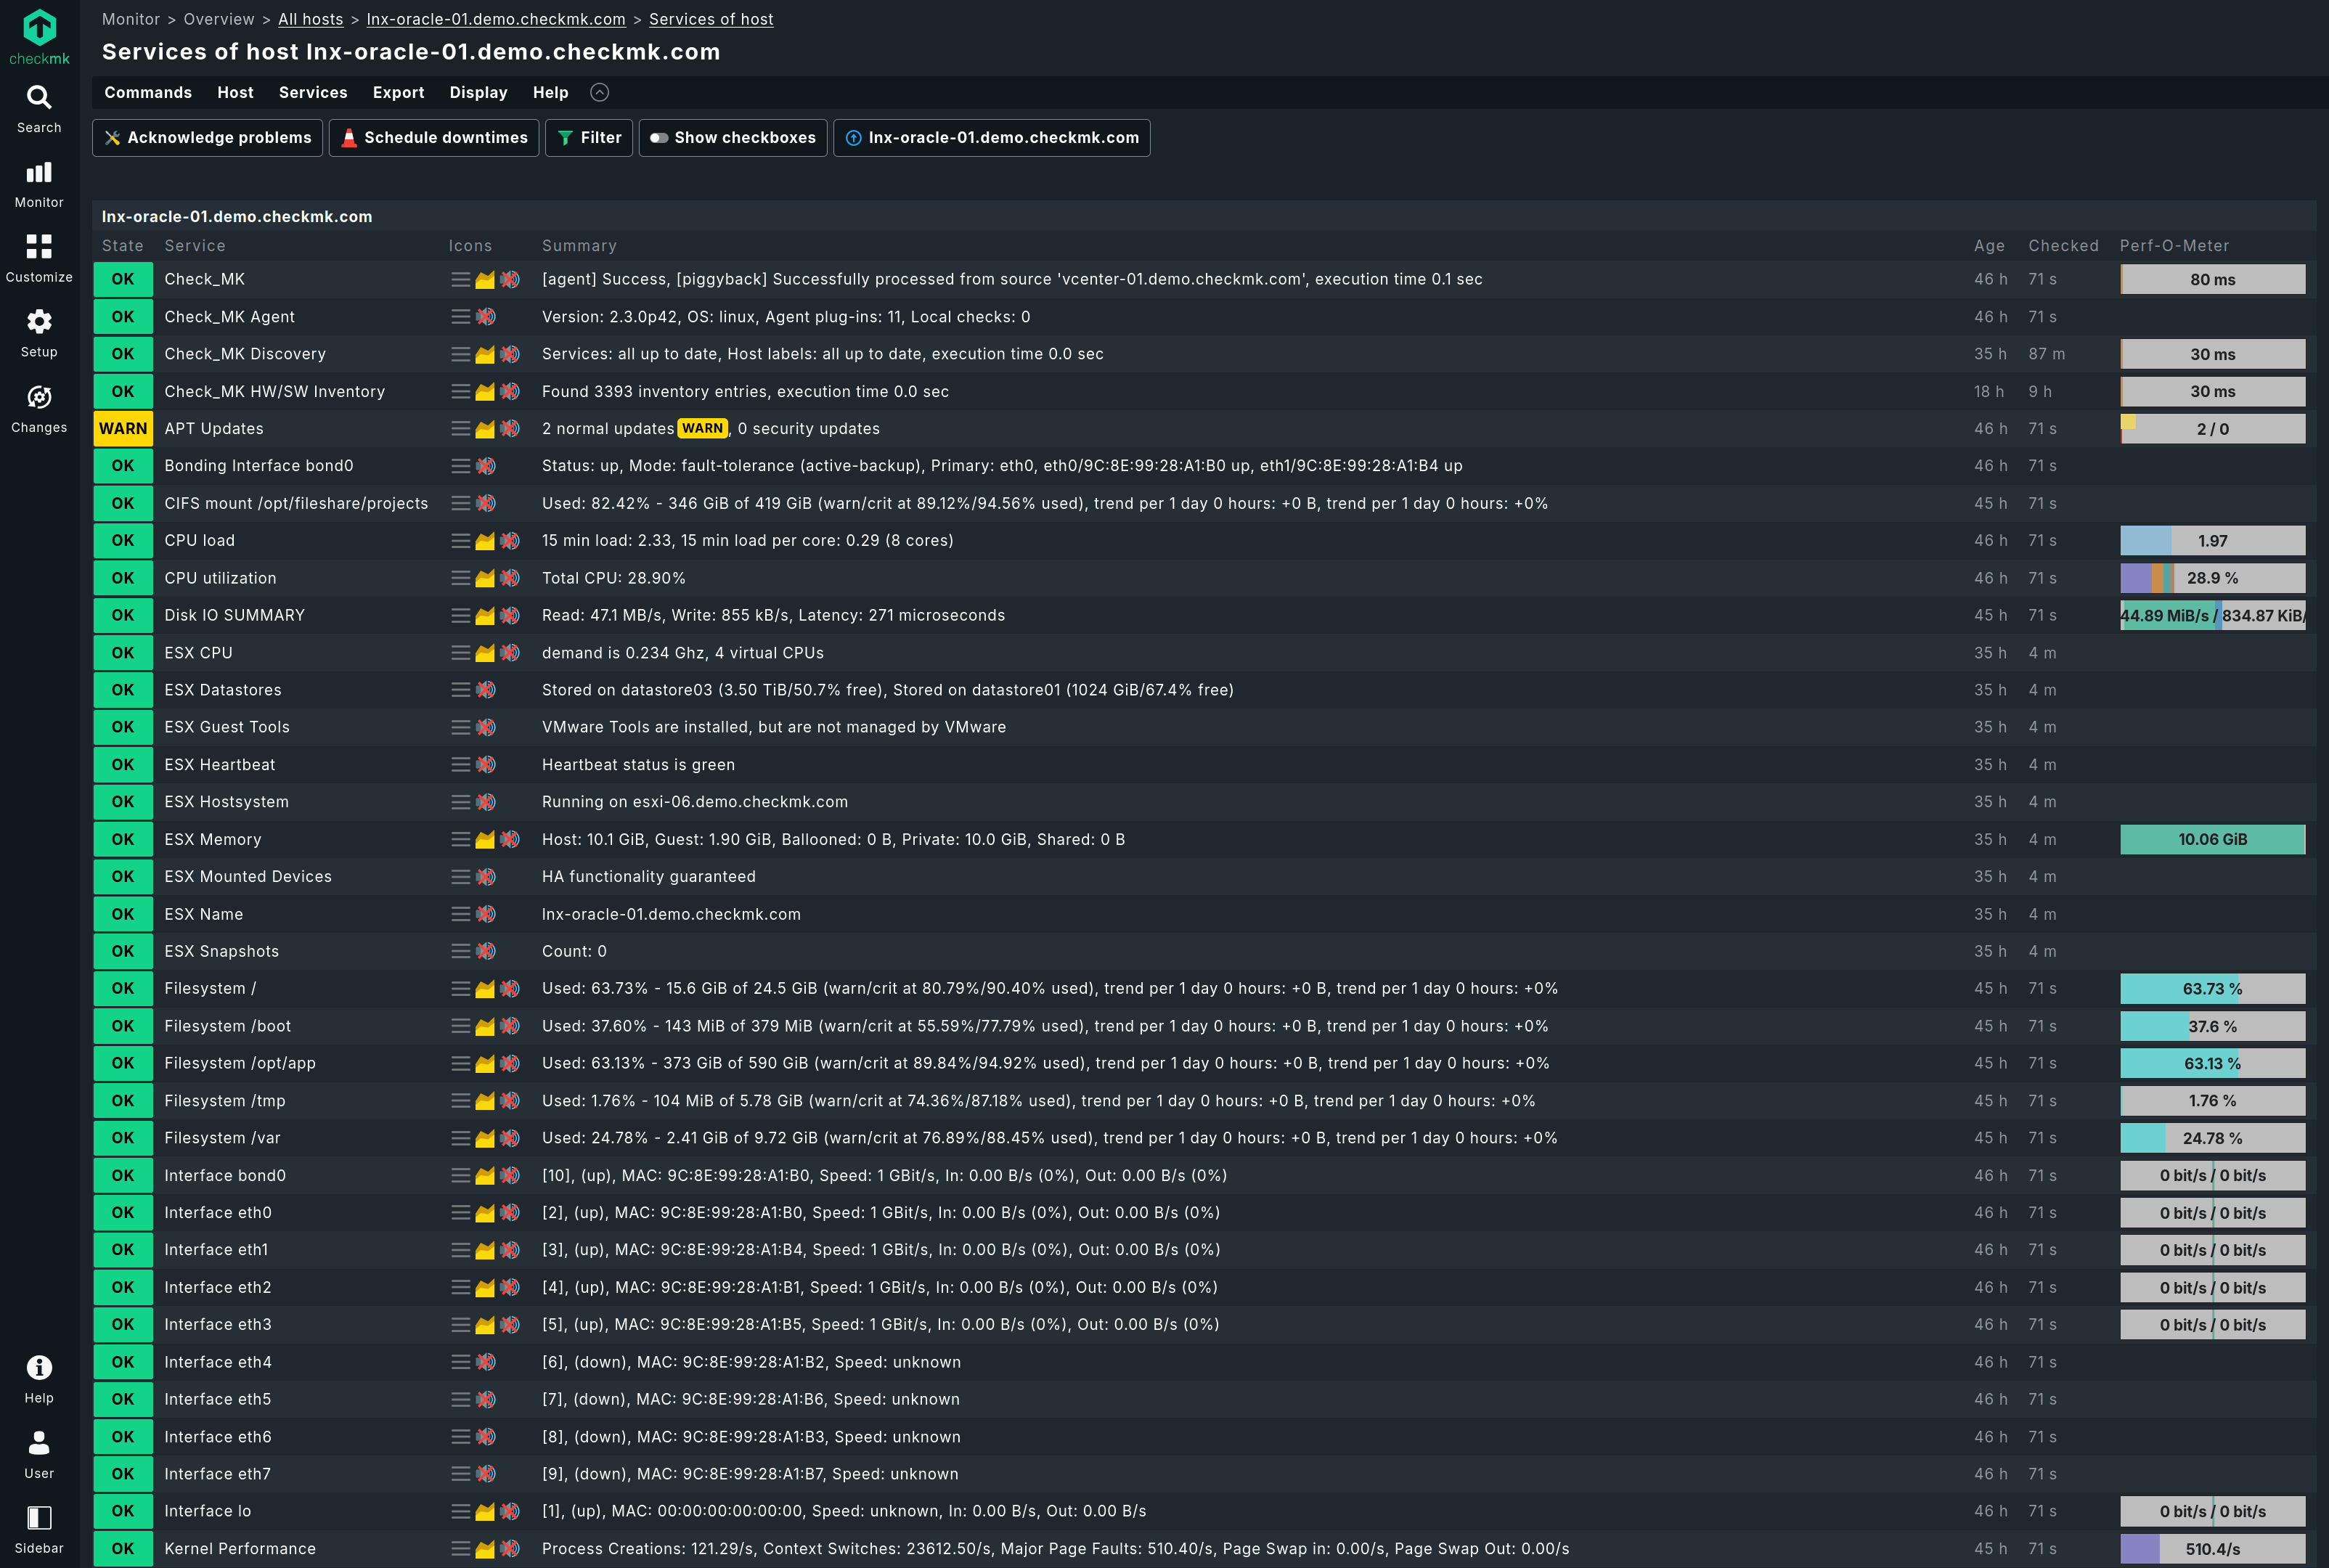
Data can come from APIs, agents, SNMP, plug-ins, integrations, and hypervisor-based sources. Checkmk, for example, can combine platform data from virtualization platforms with agent-based VM monitoring. Its piggyback mechanism assigns virtualization data to the relevant VM hosts, so data collected from a hypervisor can appear in the context of the corresponding virtual machines. This is how infrastructure monitoring can connect platform-level and guest-level perspectives instead of treating them as separate views.
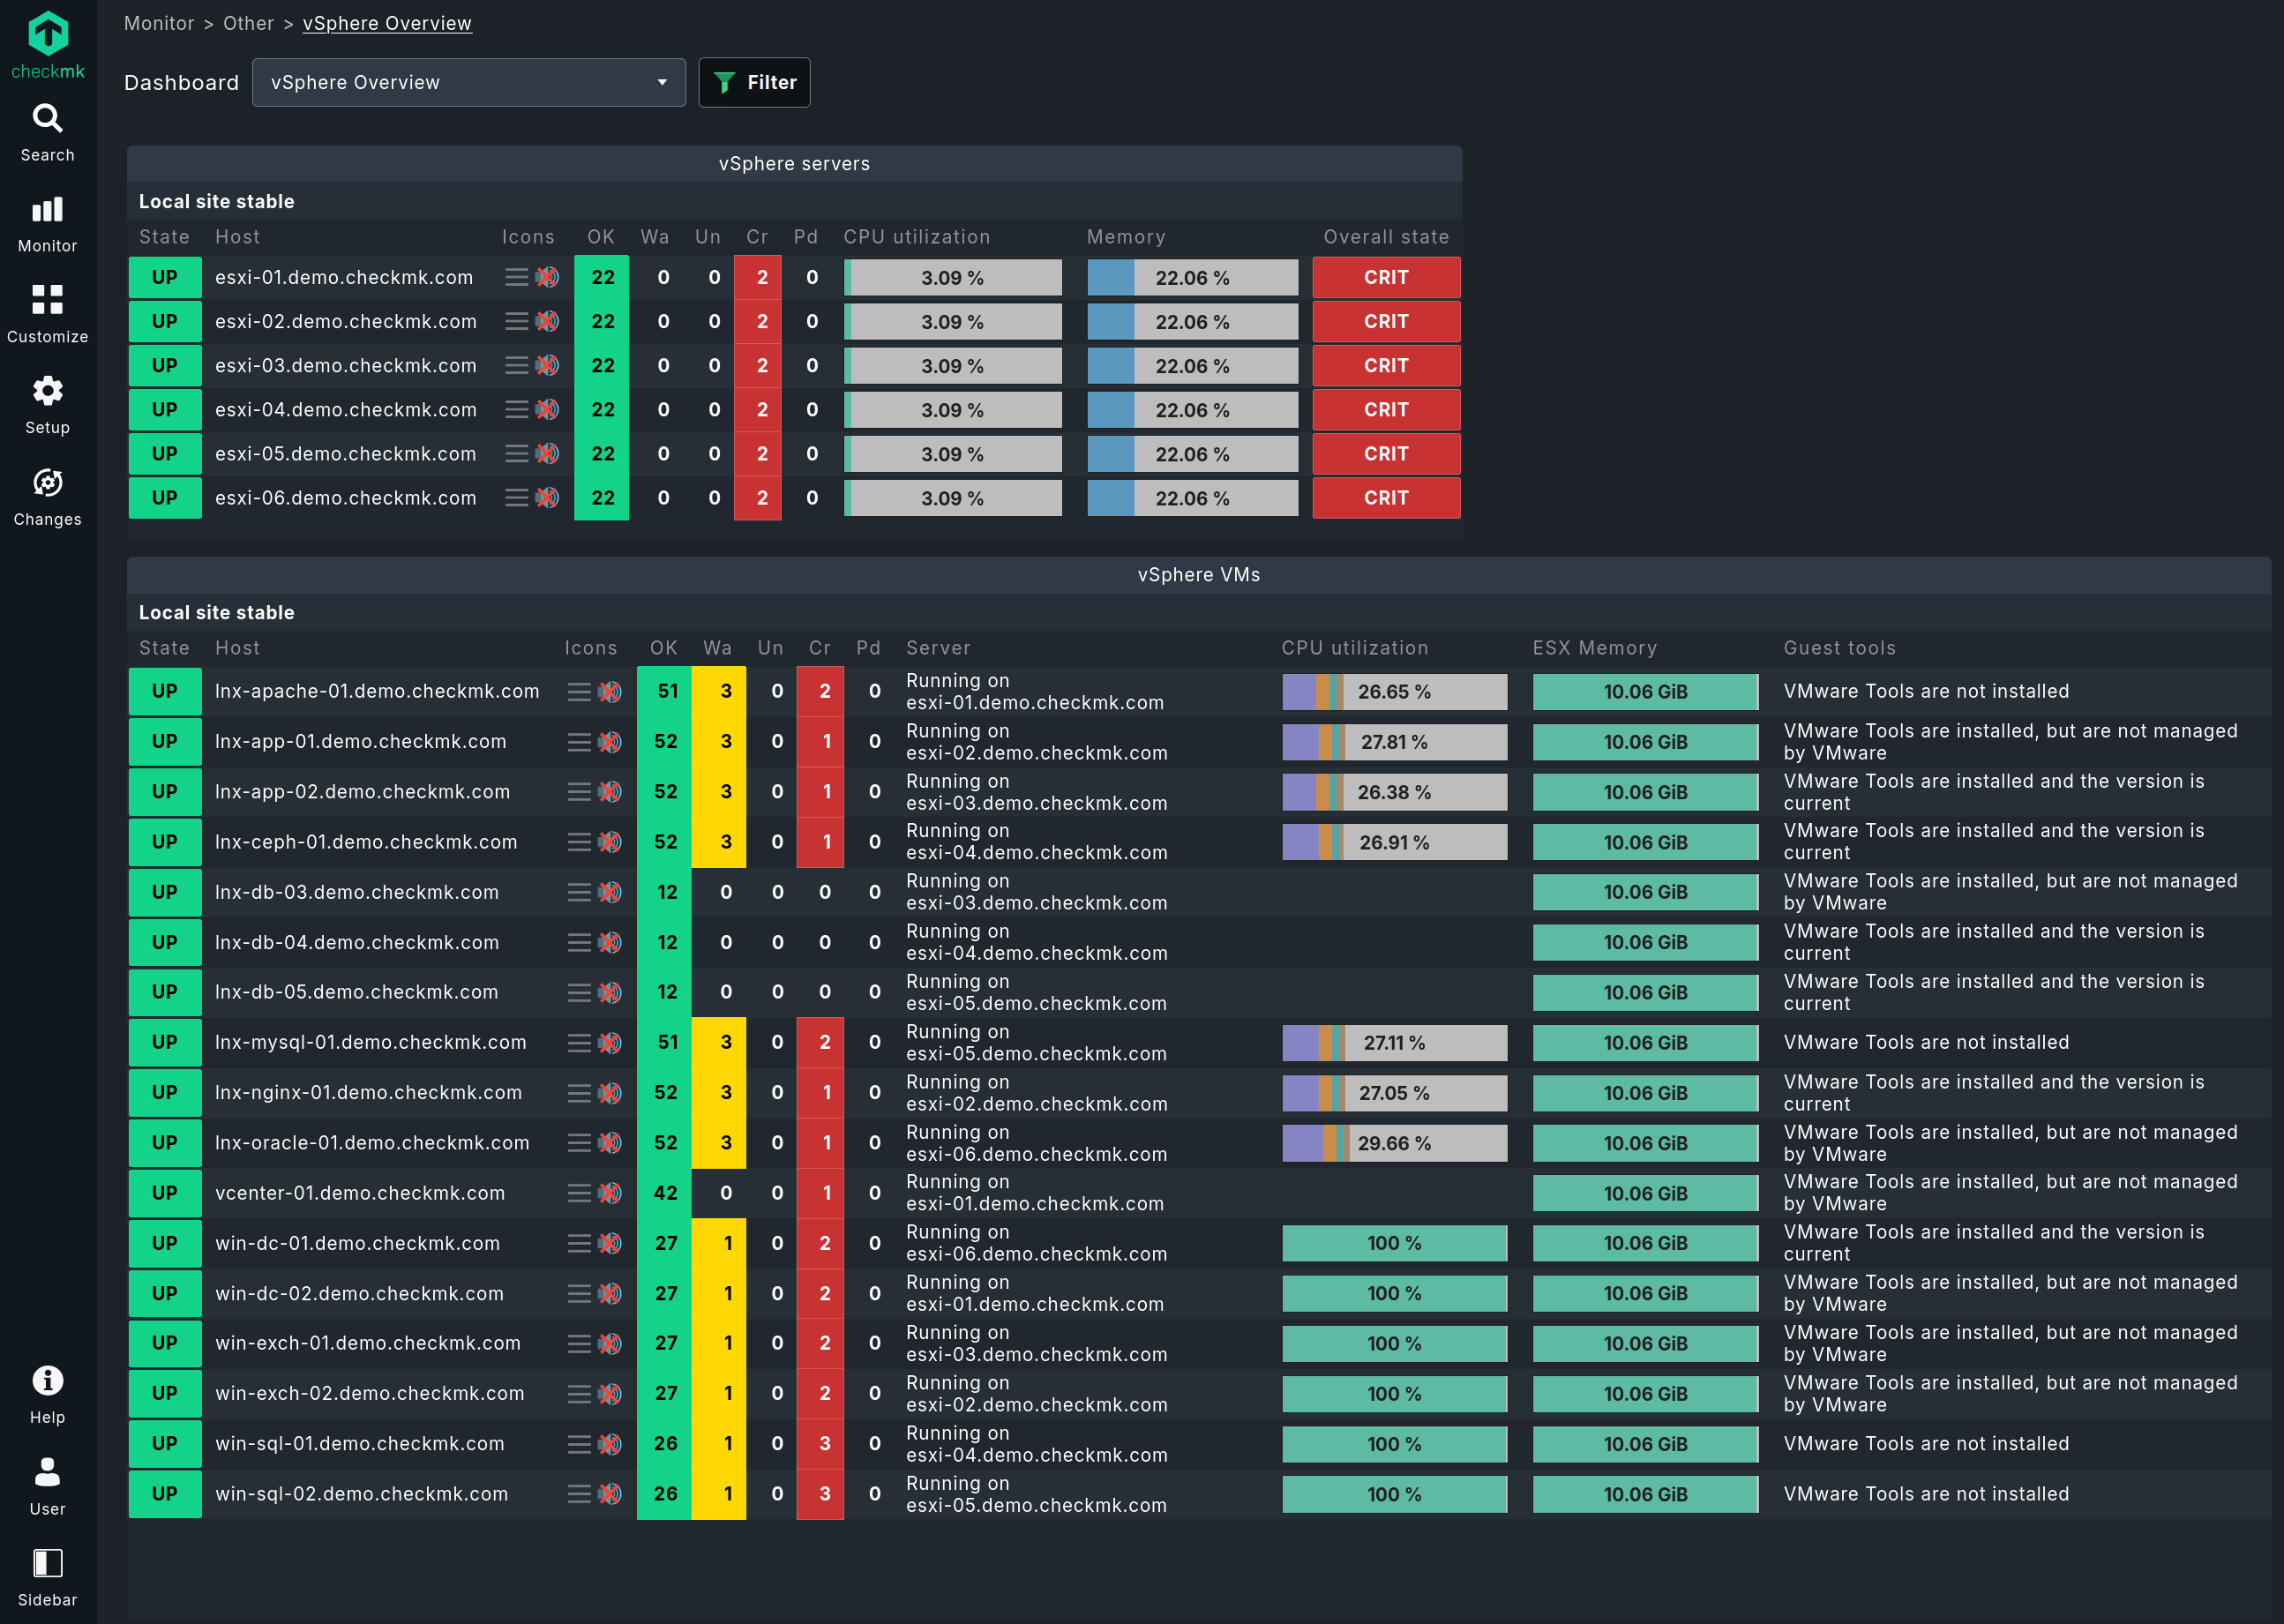
Connect platform and infrastructure contexts
Native tools are good at gathering raw metrics, but because they can’t correlate data across platforms, they can create blind spots in your monitoring infrastructure.
For instance, if an application slows down, the VM itself is only one possible source of the problem. The cause may be host load, storage latency, network errors, DNS issues, backup processes, memory pressure, or application behavior inside the guest OS. A broader monitoring view helps teams trace symptoms across layers and narrow down the likely cause faster.
Monitoring across VMware, Proxmox, and Hyper-V
This correlation matters especially in mixed environments. Proxmox, VMware vSphere/ESXi, Microsoft Hyper-V, cloud platforms, and other environments expose different metrics and use different terminology. Effective monitoring needs to map these different sources to provide a constant view into virtualized environments, considering both the virtual layer and the infrastructure beneath it.
Dynamic environments also need dynamic monitoring. Dynamic host management in monitoring tools allows for automatic addition and removal of hosts based on monitoring information, enhancing scalability and efficiency in managing virtual environments. This is important when virtual machines running today may move, be renamed, cloned, or removed tomorrow.
Turn monitoring data into operational decisions
Once data is collected and connected, monitoring becomes useful for daily IT operations.
Unified dashboards can show resource usage, allocation, storage utilization, and network behavior in one place. Real-time monitoring helps teams react quickly, while historical data helps them understand trends. This combination supports both troubleshooting and capacity planning.
Predictive analytics in virtualization tools can help forecast capacity needs by analyzing historical data and usage trends, allowing for smarter allocation of CPU, memory, and storage in virtualized environments, minimizing downtime, and avoiding overprovisioning.
The outcome is not just more data. It’s the ability to make better decisions: which virtual servers need more resources, which underutilized VMs can be rightsized, which hosts are close to saturation, which storage systems are becoming bottlenecks, and which alerts need immediate action.
Why choose a comprehensive virtualization monitoring solution?
A comprehensive monitoring solution improves over native tools in a few areas. Schematically, and succinctly, the main differences by monitoring area are:
| Layer | What native platform tools see | What comprehensive monitoring adds |
|---|---|---|
| Hypervisor & Host | Provides visibility within their own platform; manages VMs; monitors host load, CPU scheduling, and resource allocation. | Correlates platform data with guest OS/infrastructure metrics; provides predictive analytics for capacity planning and automatic host management. |
| Guest OS | Generally provides little to no visibility into the internal state of the virtual machine. | Monitors process health, file system usage, service states, logs, and internal network data for a complete view of the application. |
| Storage | Monitors storage from the platform perspective (e.g., datastores). | Correlates storage performance with VM workloads to identify bottlenecks like latency and IOPS issues that impact multiple VMs. |
| Network | Monitors network traffic at the platform level or virtual switch. | Maps full network paths; tracks traffic, packet loss, and latency across networks; correlates network errors with VM and host performance. |
The most important point to take away here is correlation. Hypervisor metrics and guest OS metrics often tell different stories. High CPU ready time indicates severe host overloading in a virtualized environment, even if the guest OS does not show a simple CPU saturation problem. Memory Ballooning, the automatic reclaiming of unused memory to the hypervisor, signals a critical memory shortage. High latency in storage indicates bottlenecks that can affect application performance, even when the corresponding virtual machines are still powered on.
Monitoring tracks CPU, memory, and storage usage to prevent overallocation and resolve the “noisy neighbor” effect in virtual environments. When one VM consumes excessive resources, monitoring detects the behavior and allows administrators to cap its usage before it affects neighboring applications.
Instead of having administrators inspect several disconnected dashboards, comprehensive monitoring gives IT teams real time and detailed insights as well as actionable recommendations across the virtualized infrastructure.
Real-world impact of comprehensive virtualization monitoring
A practical example is Proxmox monitoring with Checkmk 2.5. Checkmk has built-in Proxmox checks that bring more virtualization-specific data into the same monitoring workflow as the rest of the infrastructure. These checks include monitoring network in/out of VMs and CTs, monitoring disk read/write rates of VMs and CTs, monitoring VM CPU usage, monitoring VM uptime, node status, and monitoring Proxmox subscription expiration as part of node information.
This kind of data helps move from basic VM monitoring to operational insight. Instead of only asking, “Is this VM powered on?”, IT teams can ask:
- Which virtual machines are consuming CPU, memory, storage, and network resources?
- Is VM performance limited by host overload, storage latency, or guest OS behavior?
- Are there underutilized VMs or orphaned virtual machines wasting capacity?
- Are virtualized resources overcommitted?
- Are subscription, cluster, or node issues affecting operational health?
Without full context, administrators may need to inspect guest logs, hypervisor dashboards, network devices, storage systems, and backup tools separately. With comprehensive monitoring, performance issues can be traced across layers. If a VM reports slow writes while the hypervisor shows datastore latency and backup jobs are active, the team has a much clearer path to the root cause.
It also matters for cost control. Over provisioning is common in virtual environments because it feels safer to allocate extra CPU, memory, and storage. But unused resources still have a cost. Historical data makes it possible to identify virtual machines with consistently low resource usage, reclaim capacity, and delay unnecessary hardware purchases.
Capacity planning thus becomes more reliable. Monitoring storage growth, datastore usage, CPU ready time, memory ballooning, and network throughput helps teams plan before limits become incidents.
The result is less firefighting, fewer blind spots, and better decisions across the virtualized infrastructure. And all with a single tool instead of juggling multiple native ones.
Who needs comprehensive virtualization monitoring
The advantages seem clear by now, but who exactly needs comprehensive virtualization monitoring?
- IT teams managing mixed virtualization environments – If your organization uses Proxmox, VMware vSphere, Microsoft Hyper-V, cloud platforms, or other virtualization platforms, one monitoring layer helps reduce fragmented visibility. Even if only a couple of those are in use, a single layer is much clearer and rapid to understand.
- Organizations with unclear VM performance issues – If users report slow applications while the VM looks healthy in the native platform, the bottleneck may be storage, network, host load, backup processes, or the guest OS.
- Companies that need better capacity planning – If resource allocation decisions are based on current snapshots, historical data and predictive analytics can provide more reliable planning.
- Teams trying to reduce tool silos – A single console with consistent alerting workflows helps IT operations avoid switching between multiple dashboards during incidents.
- Environments with compliance or uptime requirements – Monitoring provides the visibility needed to prevent downtime, allocate resources efficiently, and secure data.
All the above points are especially important in environments where live migrations, changing resource demands, backup windows, and shifting virtualized resources can make yesterday’s assumptions inaccurate today.
Furthermore, comprehensive monitoring also supports security and compliance. Many industries require strict data isolation, and monitoring tools generate audit trails demonstrating compliance. Tracking of hypervisor logs for unauthorized configuration changes or access attempts is one key effort to identify possible security risks. Monitoring tools can also detect unusual network traffic or unauthorized access attempts within virtual environments. Furthermore, highlighting unpatched operating systems and hypervisor vulnerabilities is fundamental to protect your environments from known security issues. A virtualized environment introduces unique security risks that traditional physical security tools are typically not designed to detect.
Implementation considerations for virtualization monitoring
Before adding or expanding virtualization monitoring, start with your current gaps.
Do you collect both hypervisor metrics and guest OS metrics? Can you see CPU ready time, memory ballooning, host swap, datastore latency, network errors, and guest-level service states in one place? Can your monitoring tools map virtual machines to the host servers, clusters, storage, and network paths they depend on?
An effective virtualization monitoring system begins with comprehensive visibility. It must bridge the gap between hypervisor-level data and the operating system inside each virtual machine, while integrating with your specific platform mix—whether that involves Proxmox, VMware, Microsoft Hyper-V, or cloud environments. Crucially, it should employ mechanisms like piggyback agents to assign host-level data to the correct virtual machines, ensuring you maintain a clear view of performance and dependencies across layers.
Virtual environments are highly fluid, requiring monitoring that adapts to constant motion. The system must support dynamic discovery to automatically detect and track virtual machines as they are created, migrated, resized, or removed. This ensures that your monitoring configuration remains accurate without requiring manual intervention every time your infrastructure shifts.
Beyond simple collection, effective monitoring must translate metrics into actionable intelligence. This requires defining meaningful alert logic and thresholds across CPU, memory, storage, and network metrics. Additionally, the system must retain sufficient historical data to facilitate trend analysis and predictive analytics for capacity planning, while enforcing strict storage reserves to prevent potential infrastructure failures.
Finally, the monitoring architecture must be both secure and scalable. It should actively track hypervisor logs, configuration changes, and potential access attempts to maintain compliance and detect vulnerabilities. Simultaneously, the platform must handle the polling, retention, and visualization of large data volumes across your infrastructure without introducing significant performance overhead.
Evaluate your current blind spots
Check whether your monitoring covers virtual machines, hypervisors, guest operating systems, storage, network components, host servers, and services in one workflow. Look for gaps between what native platform tools show and what IT operations need to maintain performance.
If you want to explore how Checkmk supports virtualization monitoring, review the available Checkmk integrations and the Checkmk product overview. For platform-specific setup guidance, use the Checkmk documentation for environments such as VMware monitoring, Proxmox monitoring, running Hyper-V via the appliance and other virtualization integrations.
Native virtualization tools remain essential for managing virtualization platforms. Comprehensive monitoring adds the broader visibility needed to understand operational health across the full infrastructure.
FAQ
Why are hypervisor metrics not enough for VM monitoring?
Hypervisor metrics are necessary, but they do not show everything. They tell you what the virtualization platform sees: host load, resource allocation, CPU ready time, memory ballooning, storage latency, and network throughput. They do not always show what is happening inside the guest operating system, such as process problems, file system usage, application errors, service failures, or guest-level memory pressure.
Virtual machine monitoring is strongest when hypervisor data and guest OS data are combined. Native tools show what the virtualization platform sees. A dedicated monitoring platform can show both what is happening inside the VM and around it.
What is the difference between hypervisor and guest monitoring?
Hypervisor monitoring focuses on the infrastructure layer, tracking host health, CPU scheduling, storage paths, and resource allocation, to reveal how the virtual environment supports your workloads. Guest monitoring focuses on the operating system inside the virtual machine, tracking internal metrics like process health, service status, and memory usage, to reveal what the application actually experiences.
Why is VM monitoring different from virtualization platform monitoring?
The difference between VM monitoring and virtualization platform monitoring lies in the scope and perspective of the data collected. Virtualization platform monitoring focuses on the hypervisor and host servers, tracking metrics such as CPU scheduling, memory utilization, storage latency, network throughput, and resource allocation at the platform level. It provides visibility into the operational status of the virtual infrastructure from the hypervisor’s viewpoint.
In contrast, VM monitoring looks inside the guest operating system of each virtual machine. It observes CPU and memory usage, file systems, running processes, services, logs, and application behavior within the VM. This guest-level monitoring reveals issues that may not be visible at the hypervisor level, such as service failures, application errors, or memory pressure inside the VM.
What are VMware monitoring best practices for large environments?
For large environments, effective VMware monitoring requires a comprehensive, unified approach. Key best practices are the ability to correlate data across layers (as in hypervisor metrics and internal guest OS health metrics), implement automation features, and centralize operations into a single monitoring platform for streamlined handling of the large data volumes generated in large environments.
What metrics matter for virtualization monitoring?
Virtualization monitoring depends on detailed information about the health and performance of virtual systems that can be obtained through these key metrics:
- Hypervisor and Host Metrics: These include CPU ready time, co-stop, memory utilization, memory ballooning, host swap, over commitment levels, node and cluster health, and virtual resource allocation.
- Virtual Machine and Guest OS Metrics: Monitoring CPU usage, RAM consumption, disk I/O, file system health, running processes, service states, guest swap, logs, and network data inside the guest OS.
- Storage Metrics: Tracking storage utilization, datastore latency, disk IOPS, read/write throughput, queue depth, snapshot status, replication health, and capacity usage.
- Network Metrics: Measuring throughput, packet loss, latency, retransmissions, virtual switch behavior, NIC saturation, and traffic between VMs on the same physical host.
- Security and Configuration Metrics: Observing hypervisor logs for unauthorized configuration changes or access attempts, unpatched operating systems, and hypervisor vulnerabilities.
How can I detect capacity issues in virtualized environments?
Key indicators of capacity issues in virtualized environments include CPU ready time, memory ballooning, datastore latency, and network saturation. Monitoring tools that provide visibility into these metrics can identify hosts or clusters approaching capacity limits before they impact performance.
Predictive analytics enhance this process by forecasting future resource demands based on historical data, enabling IT teams to scale efficiently and plan resource allocation proactively. Additionally, tracking underutilized or overprovisioned virtual machines helps optimize resource usage and avoid unnecessary hardware investments.
Comprehensive monitoring platforms integrate data from hypervisors, guest operating systems, storage, and network components to provide unified views. This unified view allows teams to detect bottlenecks early, maintain peak performance, and improve it through informed capacity management decisions.
Why do VM performance problems often come from storage or network issues?
Virtual machines depend heavily on underlying storage and network infrastructure, making these areas common sources of performance problems. Storage latency, for example, can create bottlenecks that slow down disk read/write operations, affecting application responsiveness inside the VM. Network congestion or packet loss can degrade communication between VMs, hosts, and external services, leading to timeouts or slow data transfer.
Additionally, shared storage and network resources mean that one VM's heavy usage can impact others, a phenomenon known as the "noisy neighbor" effect. Monitoring tools that track CPU, memory, storage, and network utilization across all layers can detect such issues early and help administrators cap resource usage to prevent cascading performance degradation.
Background processes, like a backup routine or other maintenance tasks, may also consume both storage and network bandwidth, indirectly affecting VM performance. By correlating storage and network metrics with hypervisor and guest OS data, dedicated virtualization monitoring platforms provide the operational context needed to pinpoint and resolve performance problems effectively.
Do I need monitoring in addition to vCenter or Proxmox?
Yes, if you need operational visibility across the full IT infrastructure. VMware vCenter, Proxmox VE, and Hyper-V Manager are essential management tools for their own platforms. They help configure, operate, and inspect virtualized environments.
But monitoring requires a broader view. A dedicated monitoring platform such as Checkmk complements native tools by combining virtualization platform data with guest OS monitoring, storage monitoring, network monitoring, alerting, dashboards, graphs, and historical data.
Which monitoring solutions provide native support for both VMware and Proxmox virtualization?
Checkmk is a monitoring solution that provides integrated support for both VMware (ESXi/vSphere) and Proxmox, along with other platforms like Hyper-V and, unofficially, Nutanix. It allows you to monitor these heterogeneous environments centrally, correlating platform-level data with guest-level metrics to provide a unified view of your infrastructure.
Which tools are best for Proxmox and VMware virtualization monitoring?
Comprehensive monitoring solutions like Checkmk are ideal because they provide integrated, native support for both Proxmox and VMware (ESXi/vSphere), as well as Hyper-V. Nutanix is also supported in practice, but not yet officially. A centralized monitoring solution is best as it can easily correlate platform-level data with guest-level metrics to offer a unified, consistent view of your infrastructure's health.
How can comprehensive monitoring help with capacity planning?
Capacity planning depends on trends, not snapshots. Native dashboards can show current resource usage, but capacity planning tools need historical data across hosts, clusters, storage, network, and workloads.
Using historical trends to predict future resource needs can help prevent overprovisioning in virtual environments. Predictive analytics in virtualization tools can forecast capacity needs and alert users to potential storage shortages. This helps teams allocate CPU, memory, and storage more intelligently, identify underutilized VMs, and avoid unnecessary expansion.
How can I monitor Proxmox, vSphere and Hyper-V centrally?
A comprehensive monitoring solution collects key metrics from each hypervisor and their virtual machines, including CPU, memory, storage, and network usage. It also integrates guest OS monitoring to capture operating system and application-level data inside each VM. By correlating these layers, the monitoring system can identify performance bottlenecks that originate outside the VM, such as storage latency or network congestion.
Native monitoring tools such as Proxmox VE, VMware vCenter, and Hyper-V Manager provide crucial insights into their respective environments but do not offer a consolidated view across platforms or the underlying infrastructure. Thus they are not able to monitor all the environments centrally, from a single platform, but need integration and customization, or a third-party solution that bridges them.
Centralized monitoring platforms instead support heterogeneous environments by normalizing data from Proxmox, vSphere, and Hyper-V into a single dashboard with consistent alerting and reporting. For example, Checkmk combines Proxmox, VMware, and Hyper-V monitoring into one workflow, using built-in checks, agent-based VM monitoring, and piggyback mechanisms to associate data correctly.
How can I monitor Proxmox more deeply?
Monitoring Proxmox more deeply requires extending beyond its native management interface to gain comprehensive operational insights. While Proxmox VE provides essential platform-specific metrics such as VM status, node health, and cluster performance, it does not cover the full spectrum of infrastructure dependencies and guest OS-level details that impact virtual machine performance.
A dedicated monitoring solution collects detailed data from multiple layers: hypervisor metrics like CPU usage, memory ballooning, and storage latency; guest operating system metrics including CPU, RAM, disk I/O, and running services; as well as network throughput and error rates. This holistic approach helps identify bottlenecks that may not be visible within Proxmox alone, such as storage contention, network congestion, or overloaded hosts.
For example, Checkmk 2.5 introduces built-in Proxmox checks that monitor VM and container network traffic, disk read/write rates, CPU usage, uptime, and subscription status. These checks integrate Proxmox data into a unified monitoring workflow alongside other infrastructure components. This enables IT teams to move from basic VM status monitoring to actionable operational insights, such as detecting overcommitted resources, pinpointing performance issues caused by storage latency, and tracking underutilized or orphaned VMs.
To sum it up, deeper Proxmox monitoring is achieved by combining native platform data with guest OS and infrastructure metrics, providing a comprehensive view that supports troubleshooting, capacity planning, and proactive management beyond the capabilities of Proxmox’s native tools.