Key highlights from Checkmk 2.5
 on Apr 28, 2026
We're excited to announce the release of Checkmk Version 2.5. With this new release, we've delivered significant enhancements to monitoring and observability by simplifying workflows for improved usability, introducing AI-powered insights to bring clarity to alerts, and boosting the overall robustness across all Checkmk editions.
Speaking of which, we've also refreshed our edition lineup with new names that make it easier to find your best fit. Read all about the changes in this article.
Back to Checkmk 2.5, it delivers improvements across three areas: Full-stack monitoring and observability, UI/UX, and infrastructure monitoring. Let’s get into it.
Close the Visibility Gap with Native OpenTelemetry Support
Available in Checkmk Ultimate and Cloud
With native OpenTelemetry (OTel) support and a high-performance data backend, Checkmk 2.5 gives you a single pane of glass across your entire stack, from legacy Java/.NET applications to cloud-native microservices.
Legacy applications no longer have to be blind spots. Checkmk 2.5 lets you instrument Java, .NET, and other legacy workloads with OpenTelemetry auto-instrumentation, giving you full application-level visibility without requiring developers to change a single line of code.
Standard vendor APIs only go so far. With native OpenTelemetry support, Checkmk 2.5 captures telemetry from AWS, GCP, and Azure services at a level of detail that goes beyond what standard monitoring tools typically expose, so you can spot issues before they affect performance.
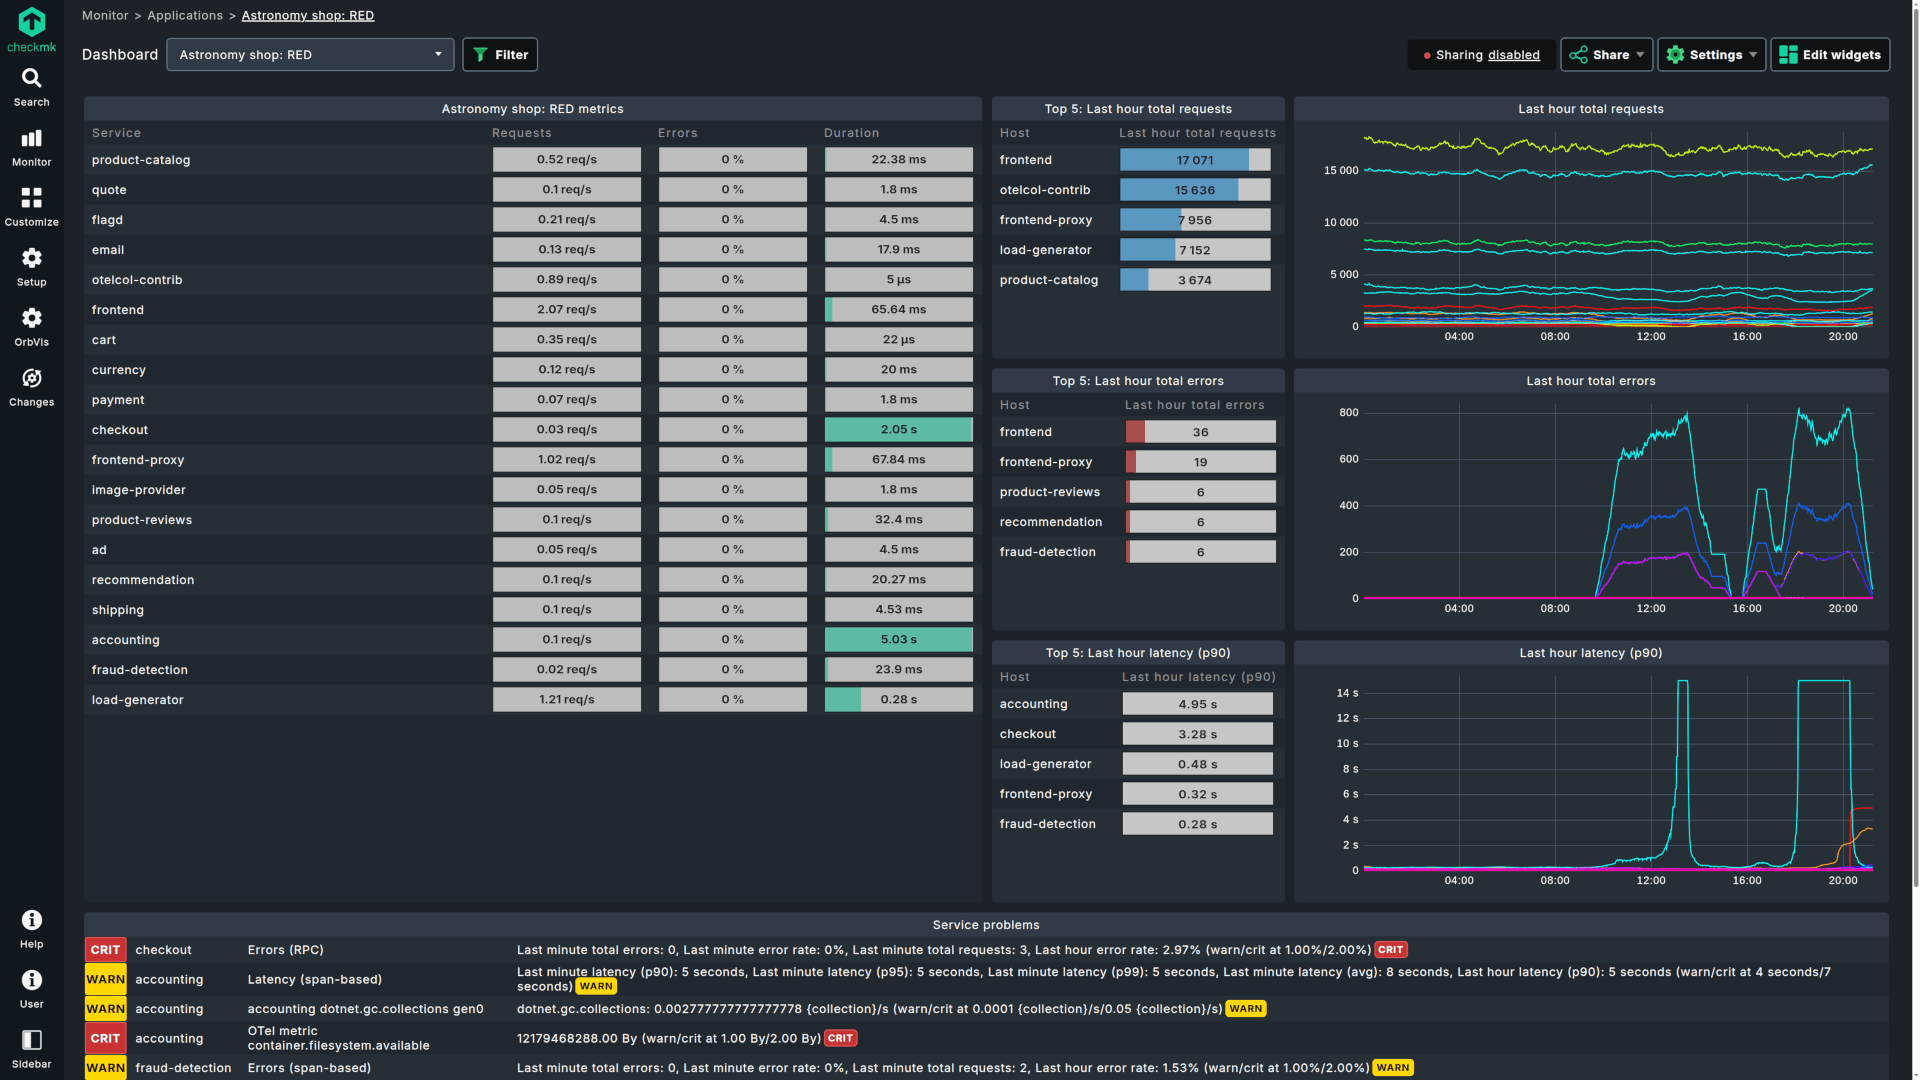
When application performance dips, the cause often lives somewhere in the underlying infrastructure. Built-in dashboards for RED signals (Rate, Errors, Duration) let you instantly trace a slow service back to a hardware bottleneck, cutting your mean time to resolution.
Instead of stitching together separate tools for metrics collection, Checkmk 2.5 ingests data directly via OTLP and scrapes Prometheus endpoints natively. The result is fewer tools to manage and a backend built to handle high data cardinality without slowing down the UI.
Streamline Remote Monitoring with Checkmk Relay
Available in Checkmk Ultimate and Cloud
Monitoring segmented networks or small remote locations shouldn't require heavy infrastructure. Checkmk Relay is a lightweight, system-agnostic container that replaces the need for full remote sites in smaller environments.
Relay is designed to be completely hands-off. Once deployed, the container updates itself automatically, eliminating the operational overhead of maintaining full remote site installations.
Security is built into the architecture. While zero-inbound monitoring was always possible with agent-based setups, Relay extends this to situations where devices aren't monitored by an agent. It establishes a secure, outbound, mTLS-encrypted connection to your central site, keeping segmented networks protected.
Checkmk Cloud users will also benefit from expanded reach. SNMP devices in remote locations, like NAS and printers, that were previously unreachable can now be monitored without standing up additional infrastructure.
Decipher Complex Alerts Instantly with AI
Available in Checkmk Cloud
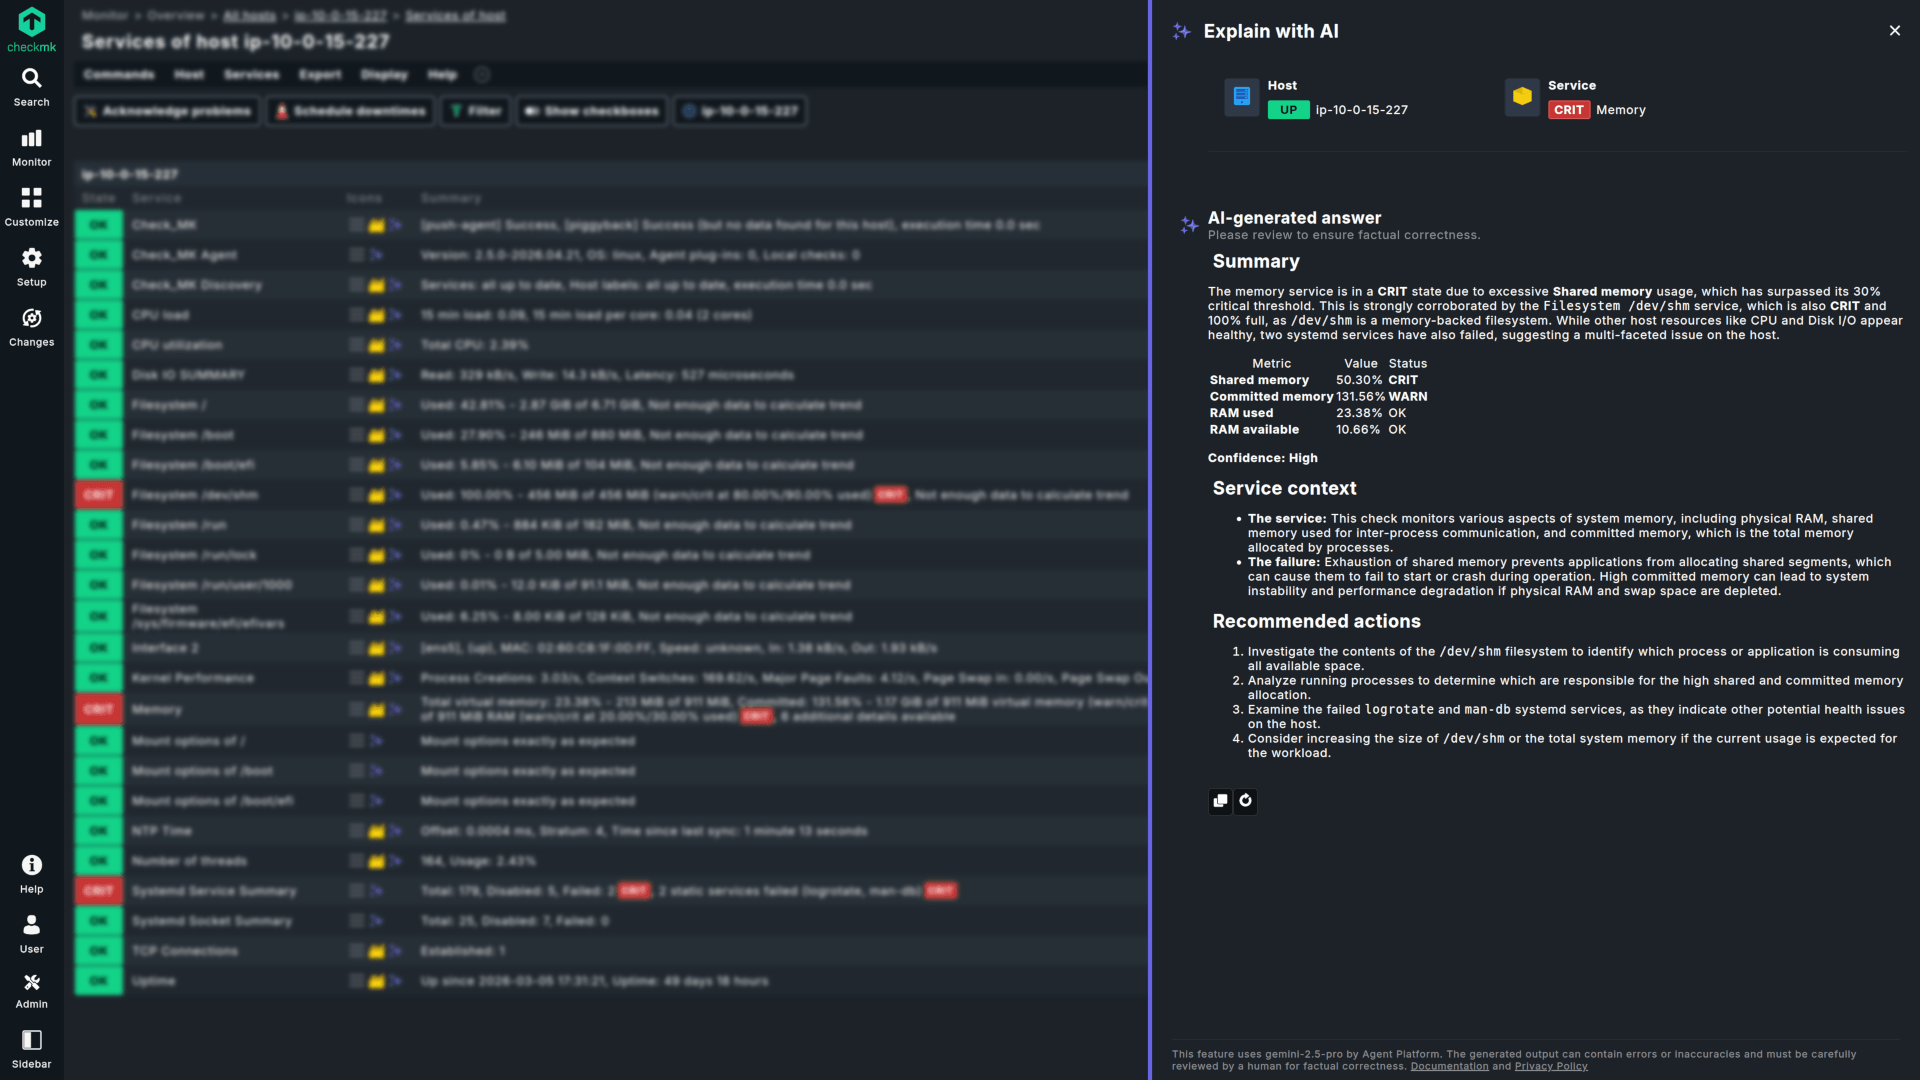
Turn complex alerts into actionable intelligence. The new "Explain with AI" feature translates technical signals into clear root-cause analysis with a single click.
Instead of manually decoding cryptic alert output, you get explanations in natural language on what went wrong and why, saving critical minutes during high-pressure outages.
This is especially valuable for junior staff or generalists who may not have deep familiarity with every stack in the environment. Rather than diving through logs to understand an unfamiliar alert, they can act on it immediately.
The same AI-generated summaries also serve as ready-made incident reports that can be shared directly with non-technical stakeholders or used as a starting point for post-mortem documentation.
Best-in-Class Infrastructure Monitoring: Azure, Virtualization, and More
Available in all commercial editions
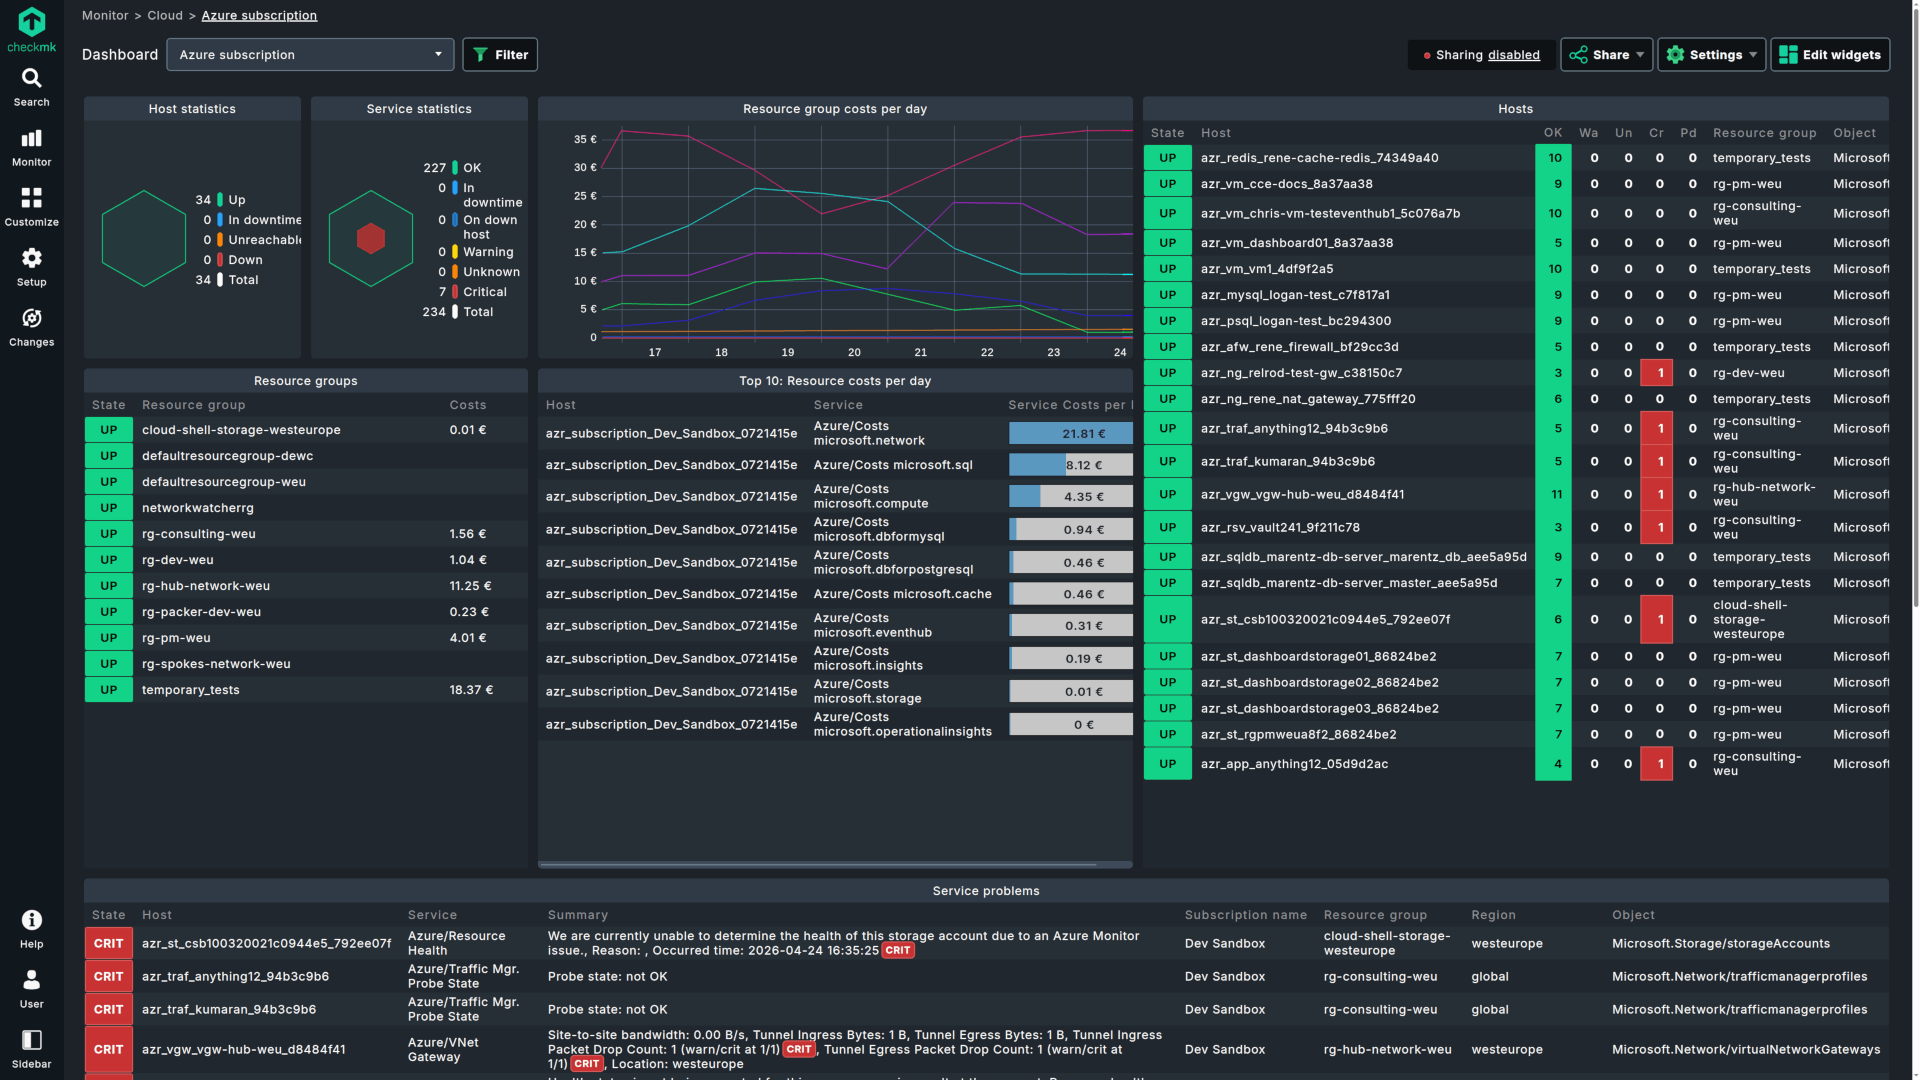
Checkmk 2.5 tackles the performance bottlenecks that come with growing cloud footprints and shifting virtualization stacks, with a completely overhauled Azure integration, expanded virtualization support, and over 90 feature enhancements.
The Azure integration has been rebuilt from the ground up, delivering 60% faster performance. You can now manage massive multi-subscription setups with a single rule and use native Azure tags for instant filtering, making large-scale Azure environments far more manageable.
On the virtualization side, Checkmk 2.5 expands coverage to keep pace with market shifts. This includes support for Proxmox (cluster health, overcommitment, and more), Hyper-V, and Podman, so you're covered regardless of which platforms your organization runs.
Windows environments get a targeted improvement as well. New agent-level event log filtering lets you set custom limits on incoming data, helping you prevent alert storms before they overwhelm your monitoring.
Checkmk 2.5 also strengthens the platform's security posture with a hardened Livestatus API that is now injection-safe, along with proactive security release pre-announcements to give your team time to prepare for critical updates.
Visualize What Matters with Responsive Dashboards
Available in all commercial editions
Monitoring is only useful if it's visible. Checkmk 2.5 makes it easier to create, customize, and share insights across the organization.
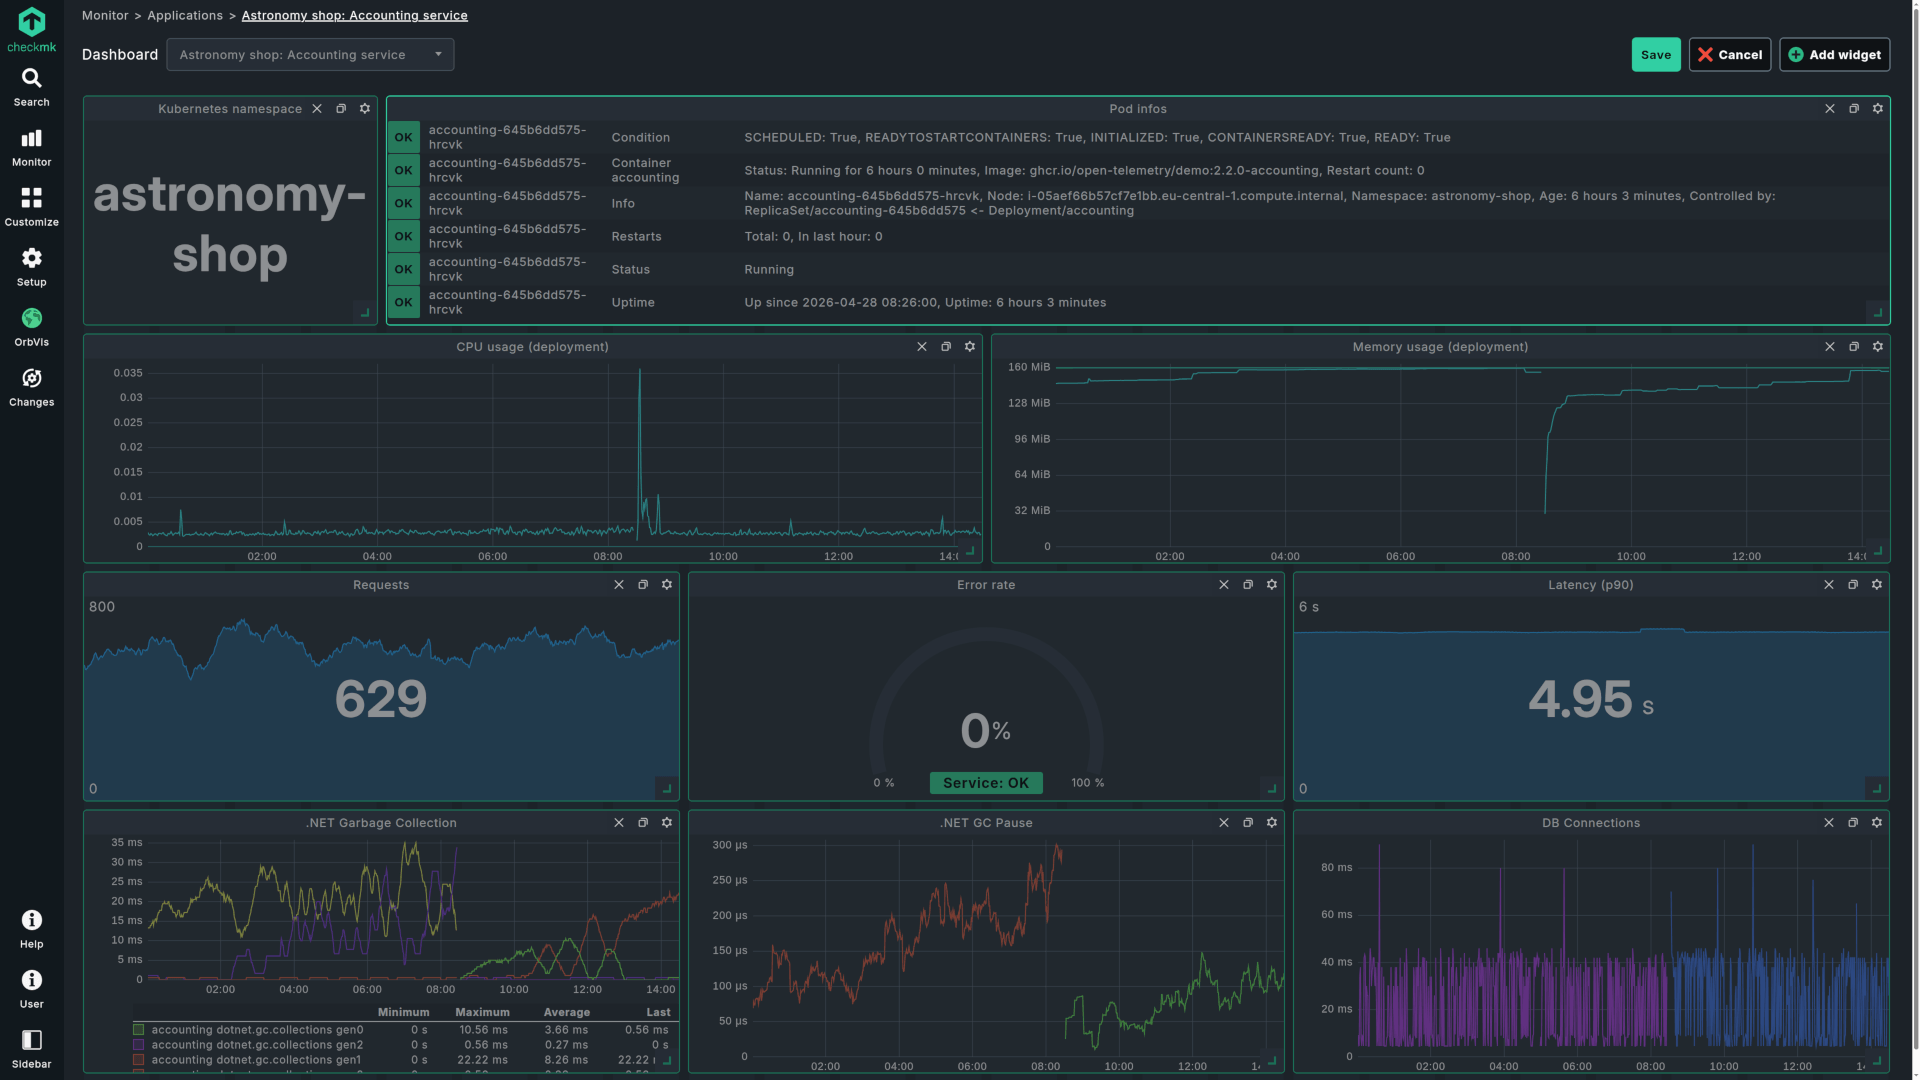
Dashboard layouts are now fully responsive, adapting automatically to any screen size from a mobile device to a 4K NOC wall. No manual adjustments required.
Building dashboards is also more intuitive. A redesigned guided workflow and the new widget preview let you see exactly how your data visualization will look before you save it, removing the guesswork from dashboard creation.
You can now share dashboards with stakeholders who don't have a Checkmk account through time-limited, custom invitations, making it easy to extend monitoring visibility beyond the ops team.
Work Faster with a More Intuitive Interface
Checkmk 2.5 removes micro-frustrations and navigation lag with a more responsive, intuitive experience that makes workflows faster and learning curves shorter.
Complex views now display structural previews so you can stay oriented while detailed metrics load in the background. Active loading indicators and explicit confirmations for intensive tasks like agent baking or test notifications ensure you always know the system is working, rather than wondering if something stalled.
Multi-step operations are now guided end-to-end. Whether you're baking agents or adding new hosts, Checkmk walks you through each step with real-time verification of key actions like resolving a hostname. You can even activate changes without leaving the rule configuration, keeping your workflow uninterrupted.
Finding settings is no longer a scavenger hunt. An improved global search removes the need to remember whether a setting lives in "Setup" or "Monitoring," surfacing results across the entire interface from one place.
Error messages have also been overhauled. Clearer, more descriptive output pinpoints exactly what went wrong, so you can correct configuration issues instantly instead of troubleshooting by trial and error.
Get Started with Checkmk 2.5
Ready to try it? Download Checkmk 2.5 or start a free trial to experience the full platform. For the full list of changes, check out the release notes.
