Enterprise-grade container monitoring for DevOps and IT Operations
Checkmk provides fast and reliable insights across all of your container and container orchestration platforms. Get an in-depth view into Docker, native Kubernetes and OpenShift Kubernetes performance and resource usage.

- Analyze performance and resource usage
- Detect potential performance issues early on and fix them in real-time
- Connect container performance insights with other critical IT services' KPIs
- Get easy visibility via Checkmk’s built-in graphing or its Grafana integration
- Auto-discover and automatically add / delete containers and pods which can have life-times of only a few seconds
- Auto-discover and include labels from containers and orchestration platforms
Supported cloud platforms and vendors


Enterprise-grade container monitoring for containerized applications

Your IT environment is constantly evolving, and so is Checkmk. Combine the monitoring of more static on-premises infrastructure for server, networks and applications with the monitoring of the new, dynamic, and often cloud-based IT stacks – all in one place.
Checkmk enables you to keep track of your container environments in real-time and at scale:
- Get all the relevant data, both in centralized and highly distributed environments
- Combine metrics measurements, status-based monitoring and event-analysis in one place
- Address performance issues quickly by setting up custom alerts and rules

Unified insights
Get rid of monitoring tool fragmentation. Checkmk can monitor all of your infrastructure and applications in a single place.

Unified insights
Benefit from the unique combination of metrics, events, and status-based monitoring to identify problems and solve root causes early on.

Dynamic Alerting
Send proactive and dynamic alerts to your standard communications and ITSM tools, such as Slack, PagerDuty or ServiceNow.
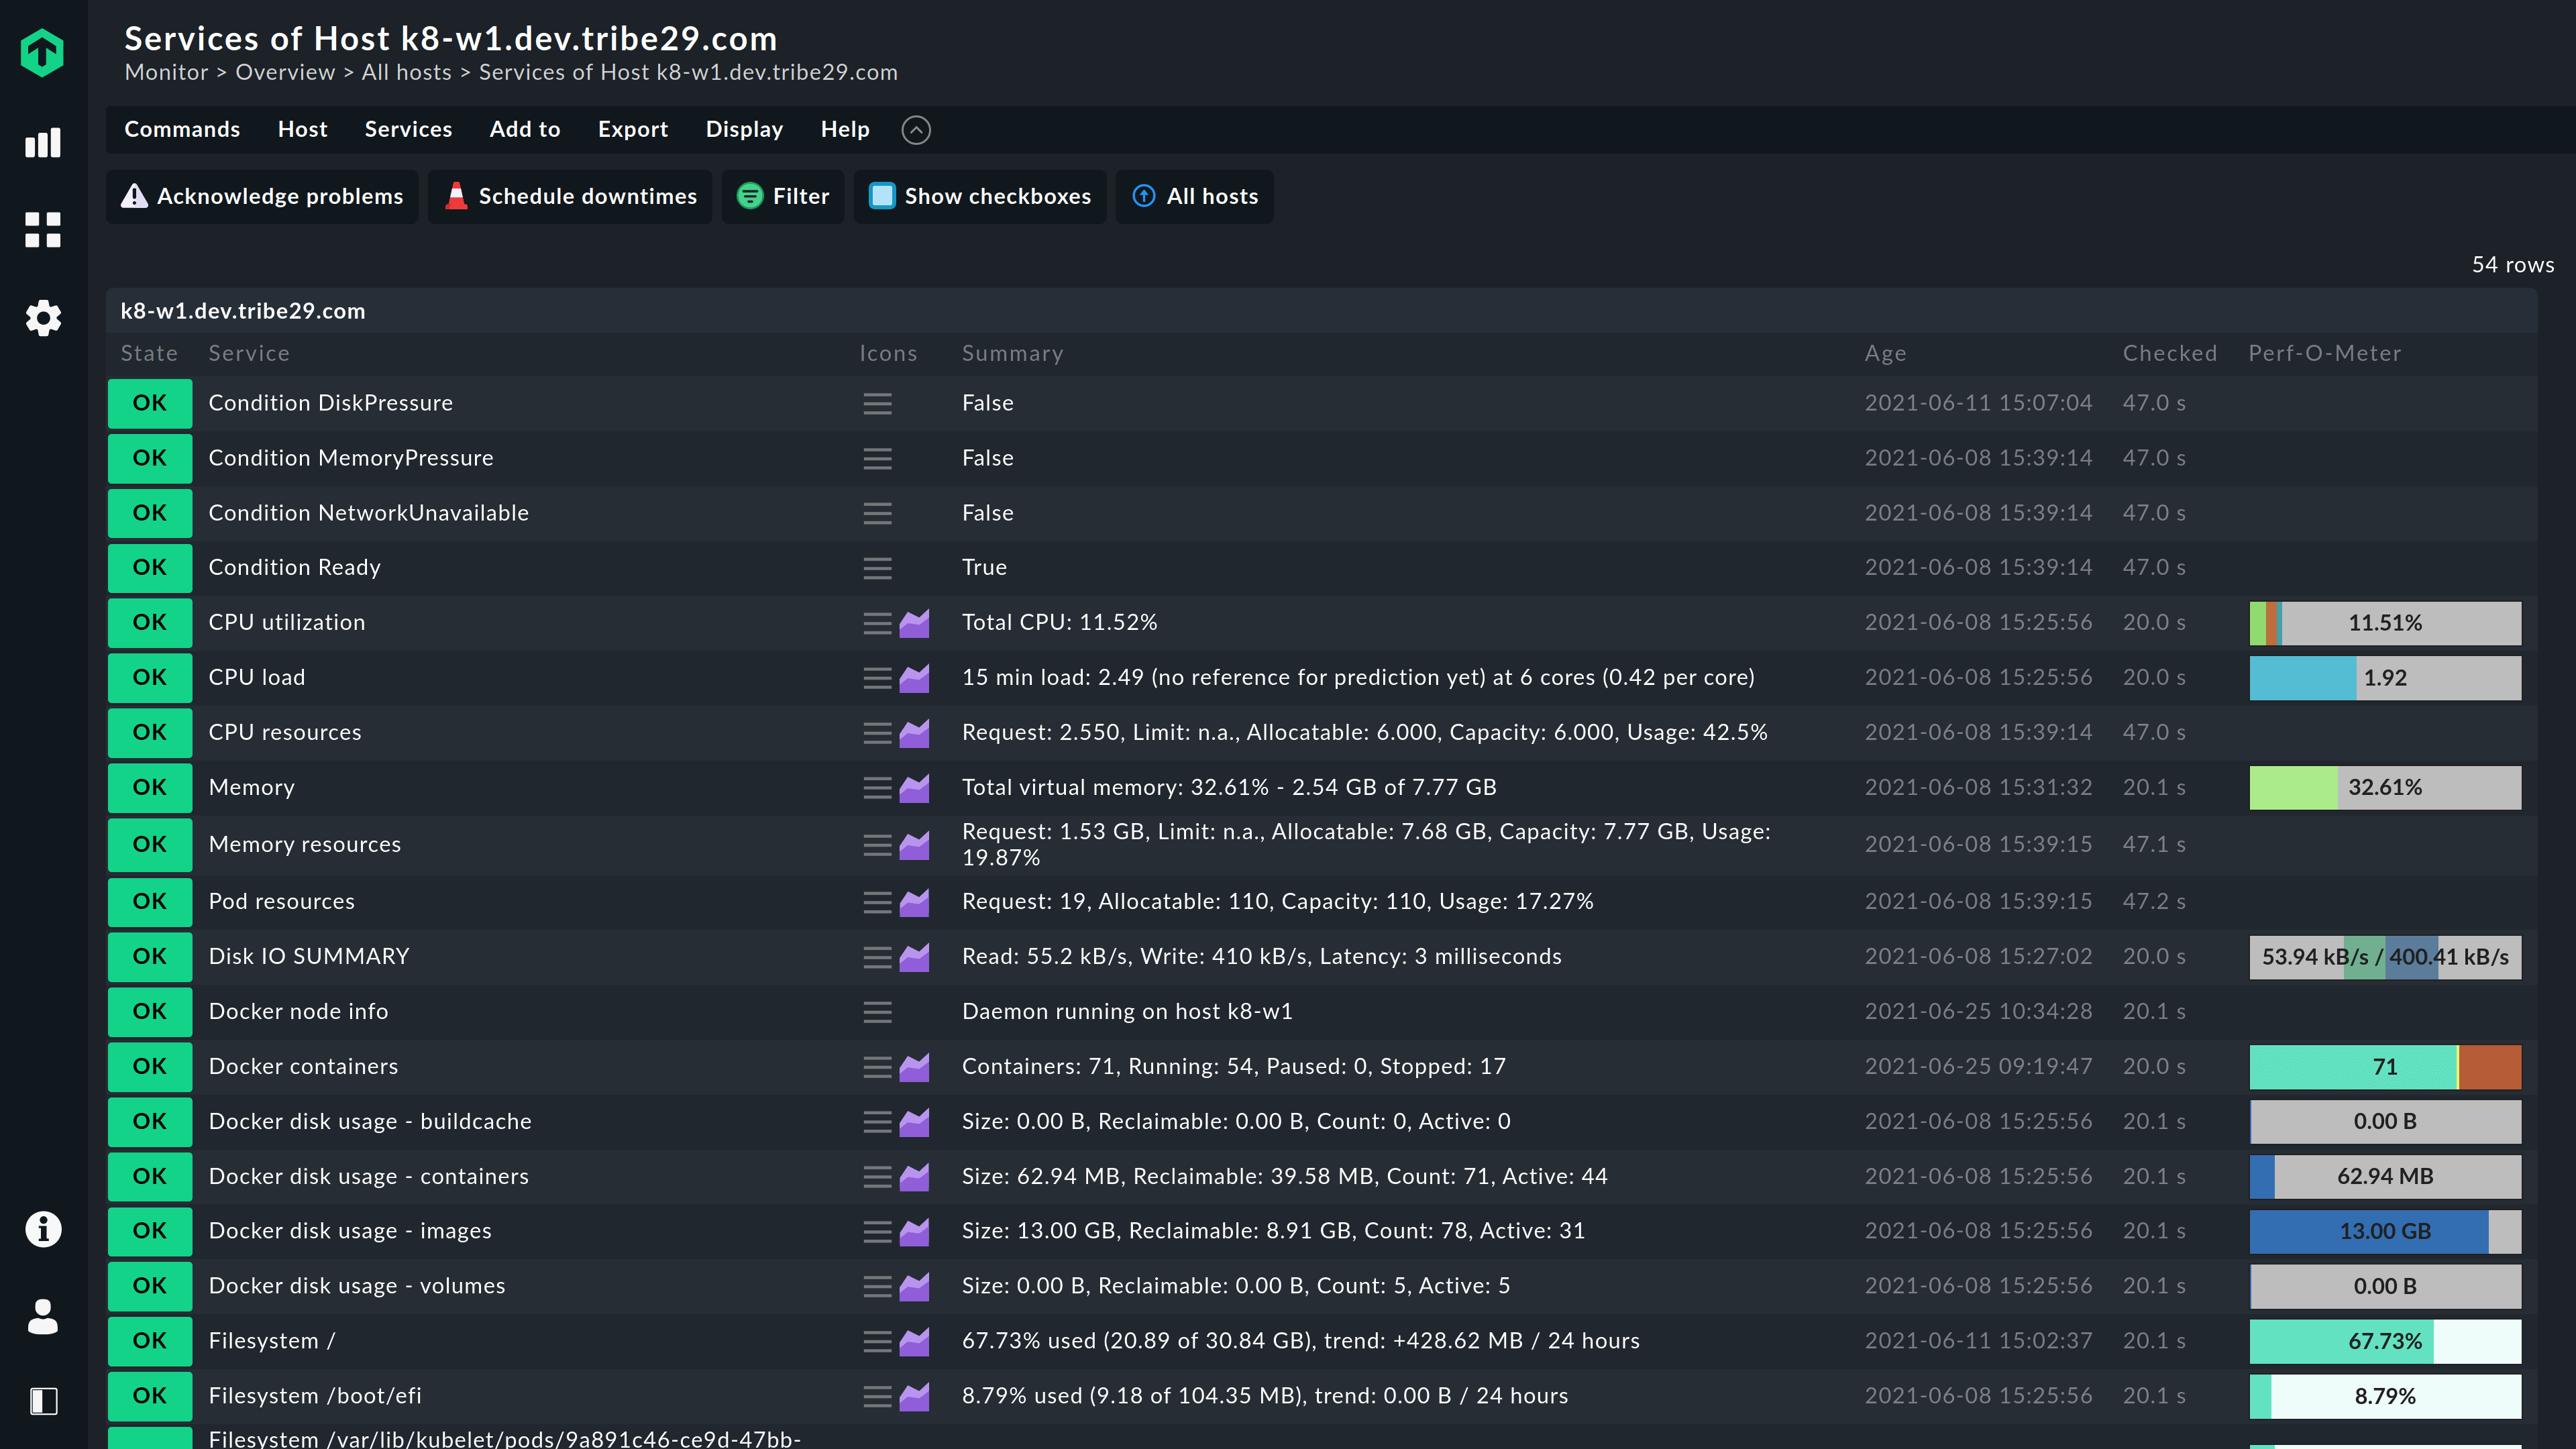
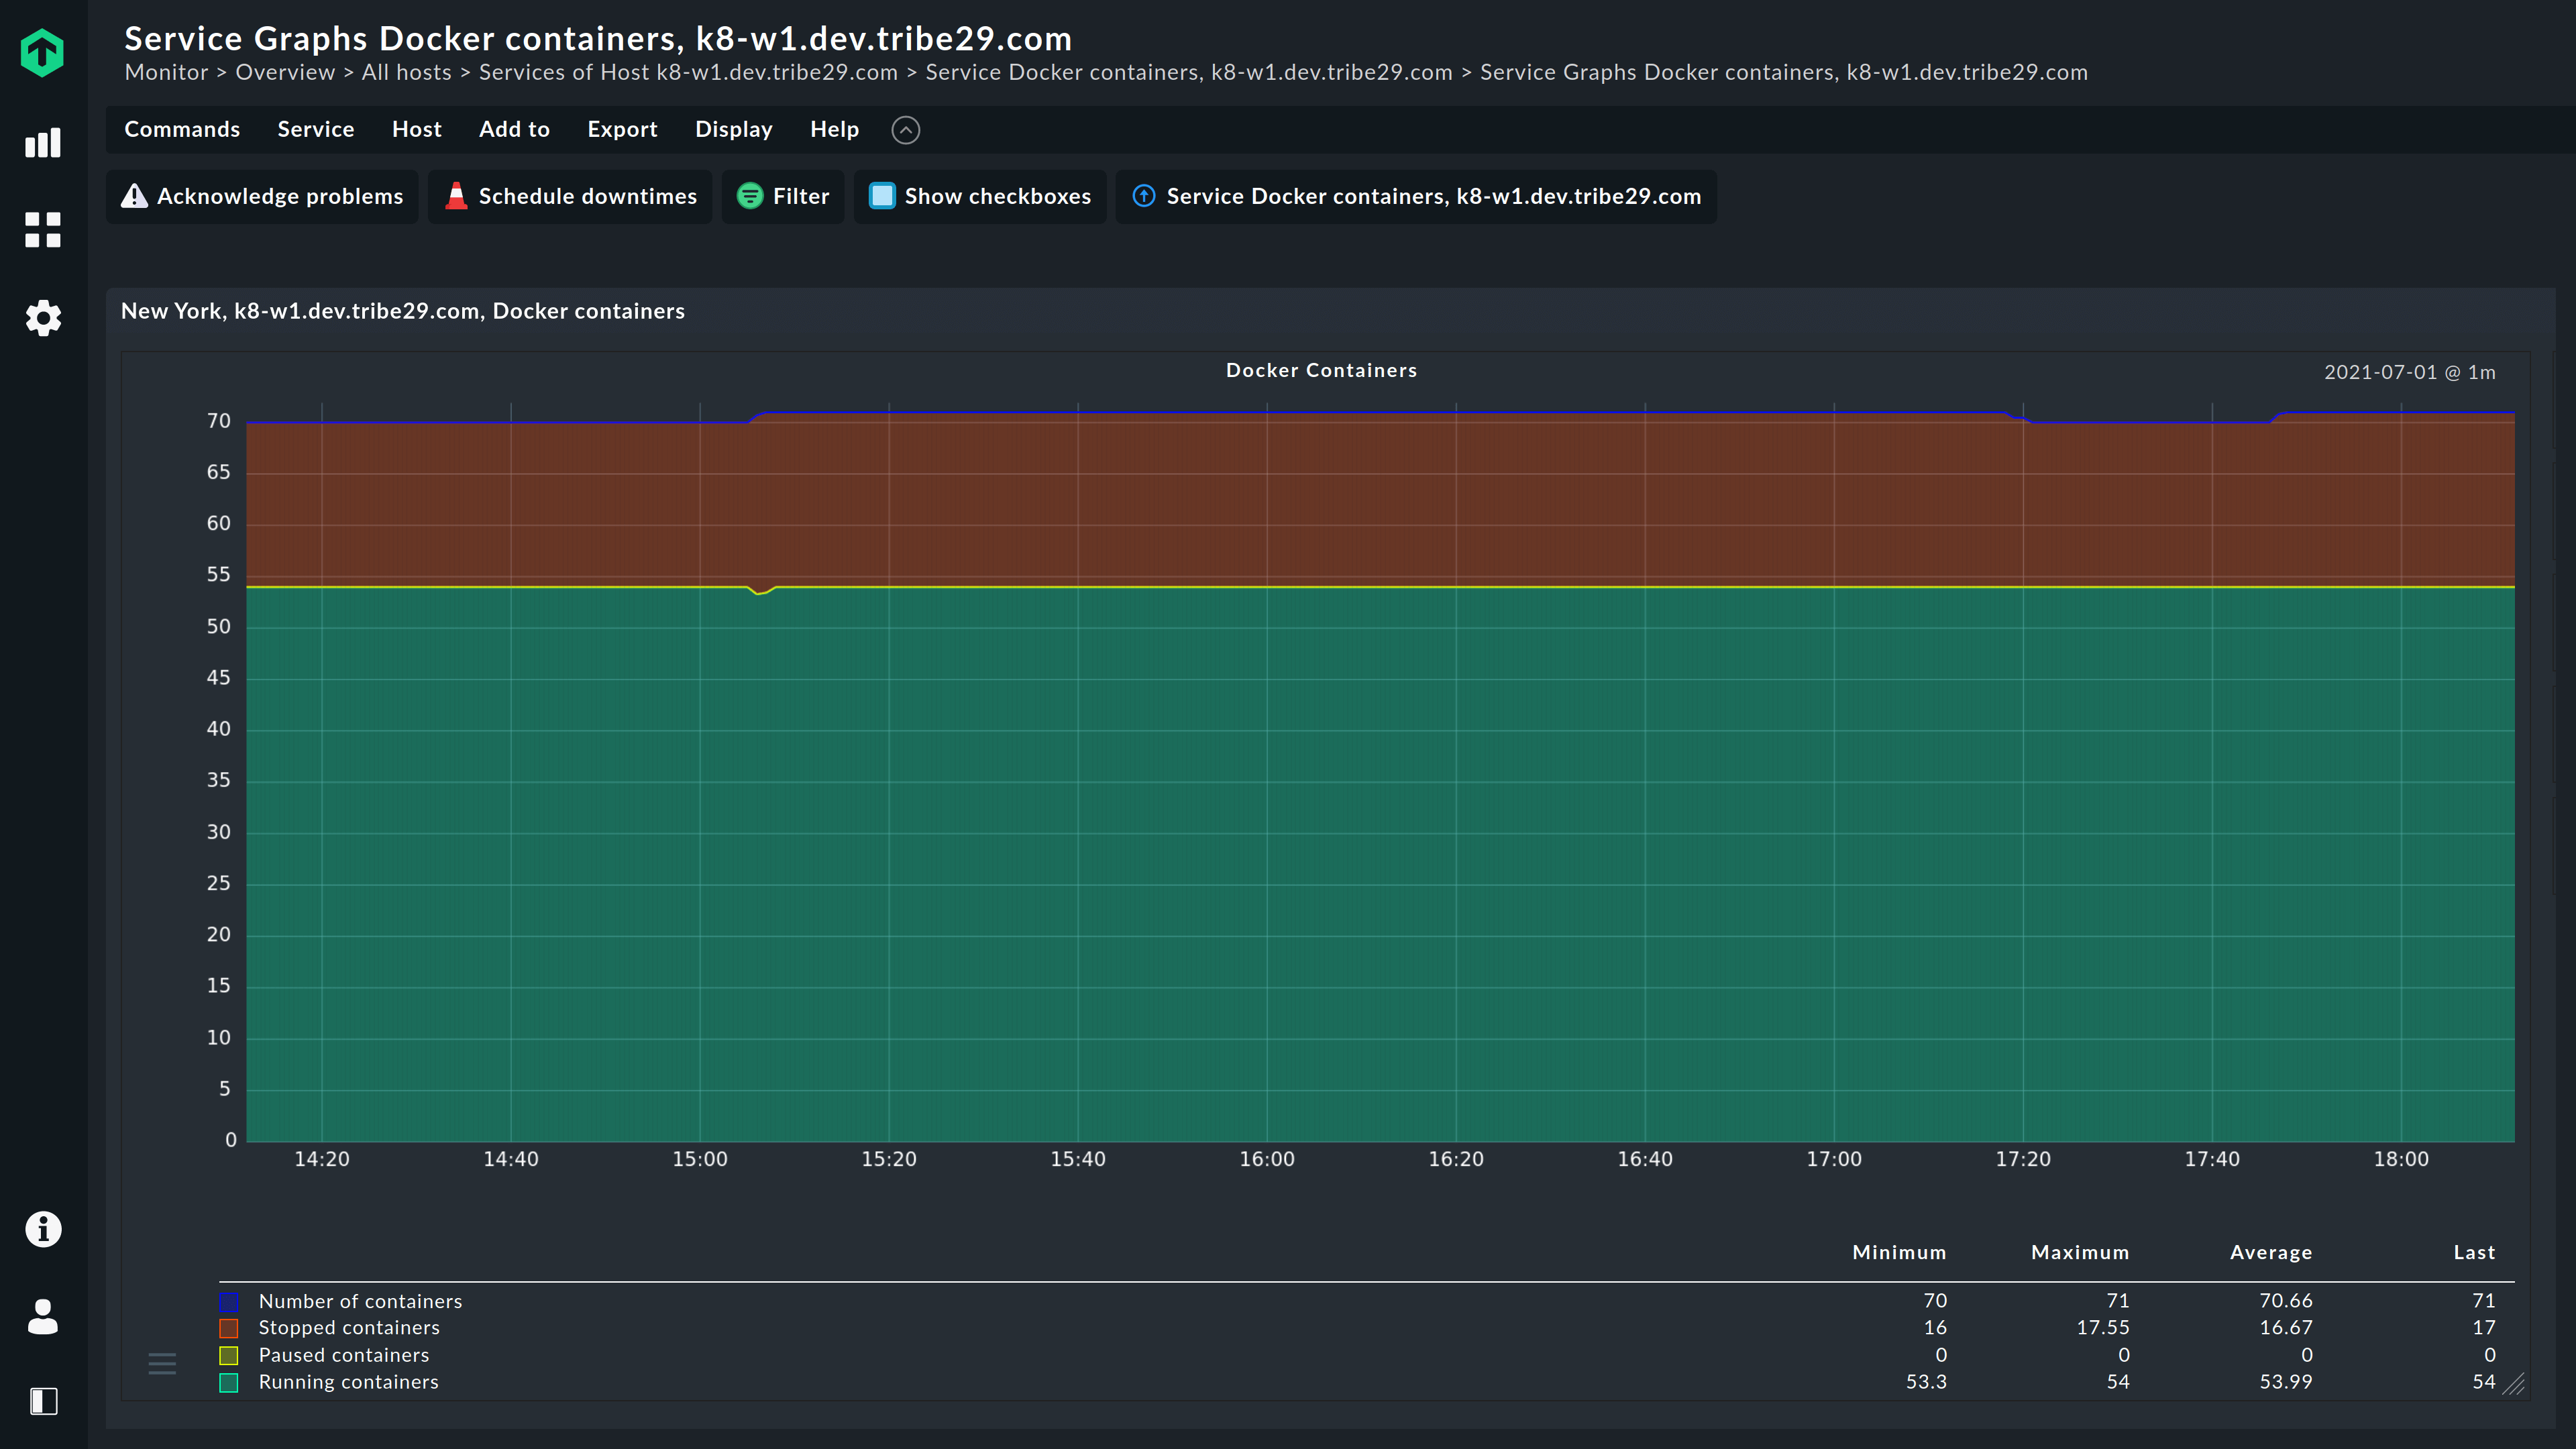
Monitor dynamic Docker environments
Easily track Docker containers and gain fully visibility into their real-time status and performance across Docker environments.
Leverage the new Docker monitoring plugin (mk_docker.py) using Docker's Python-API to:
- Analyze Docker nodes, containers, and images and get detailed information about critical resource and performance metrics
- Build custom dashboards or use the Grafana integration to visualize key insights quickly
- Use root-cause analysis to reduce costly false alarms and address complex Docker problems
- Use historical data to understand how the changes in Docker topology, status and attributes impact system performance
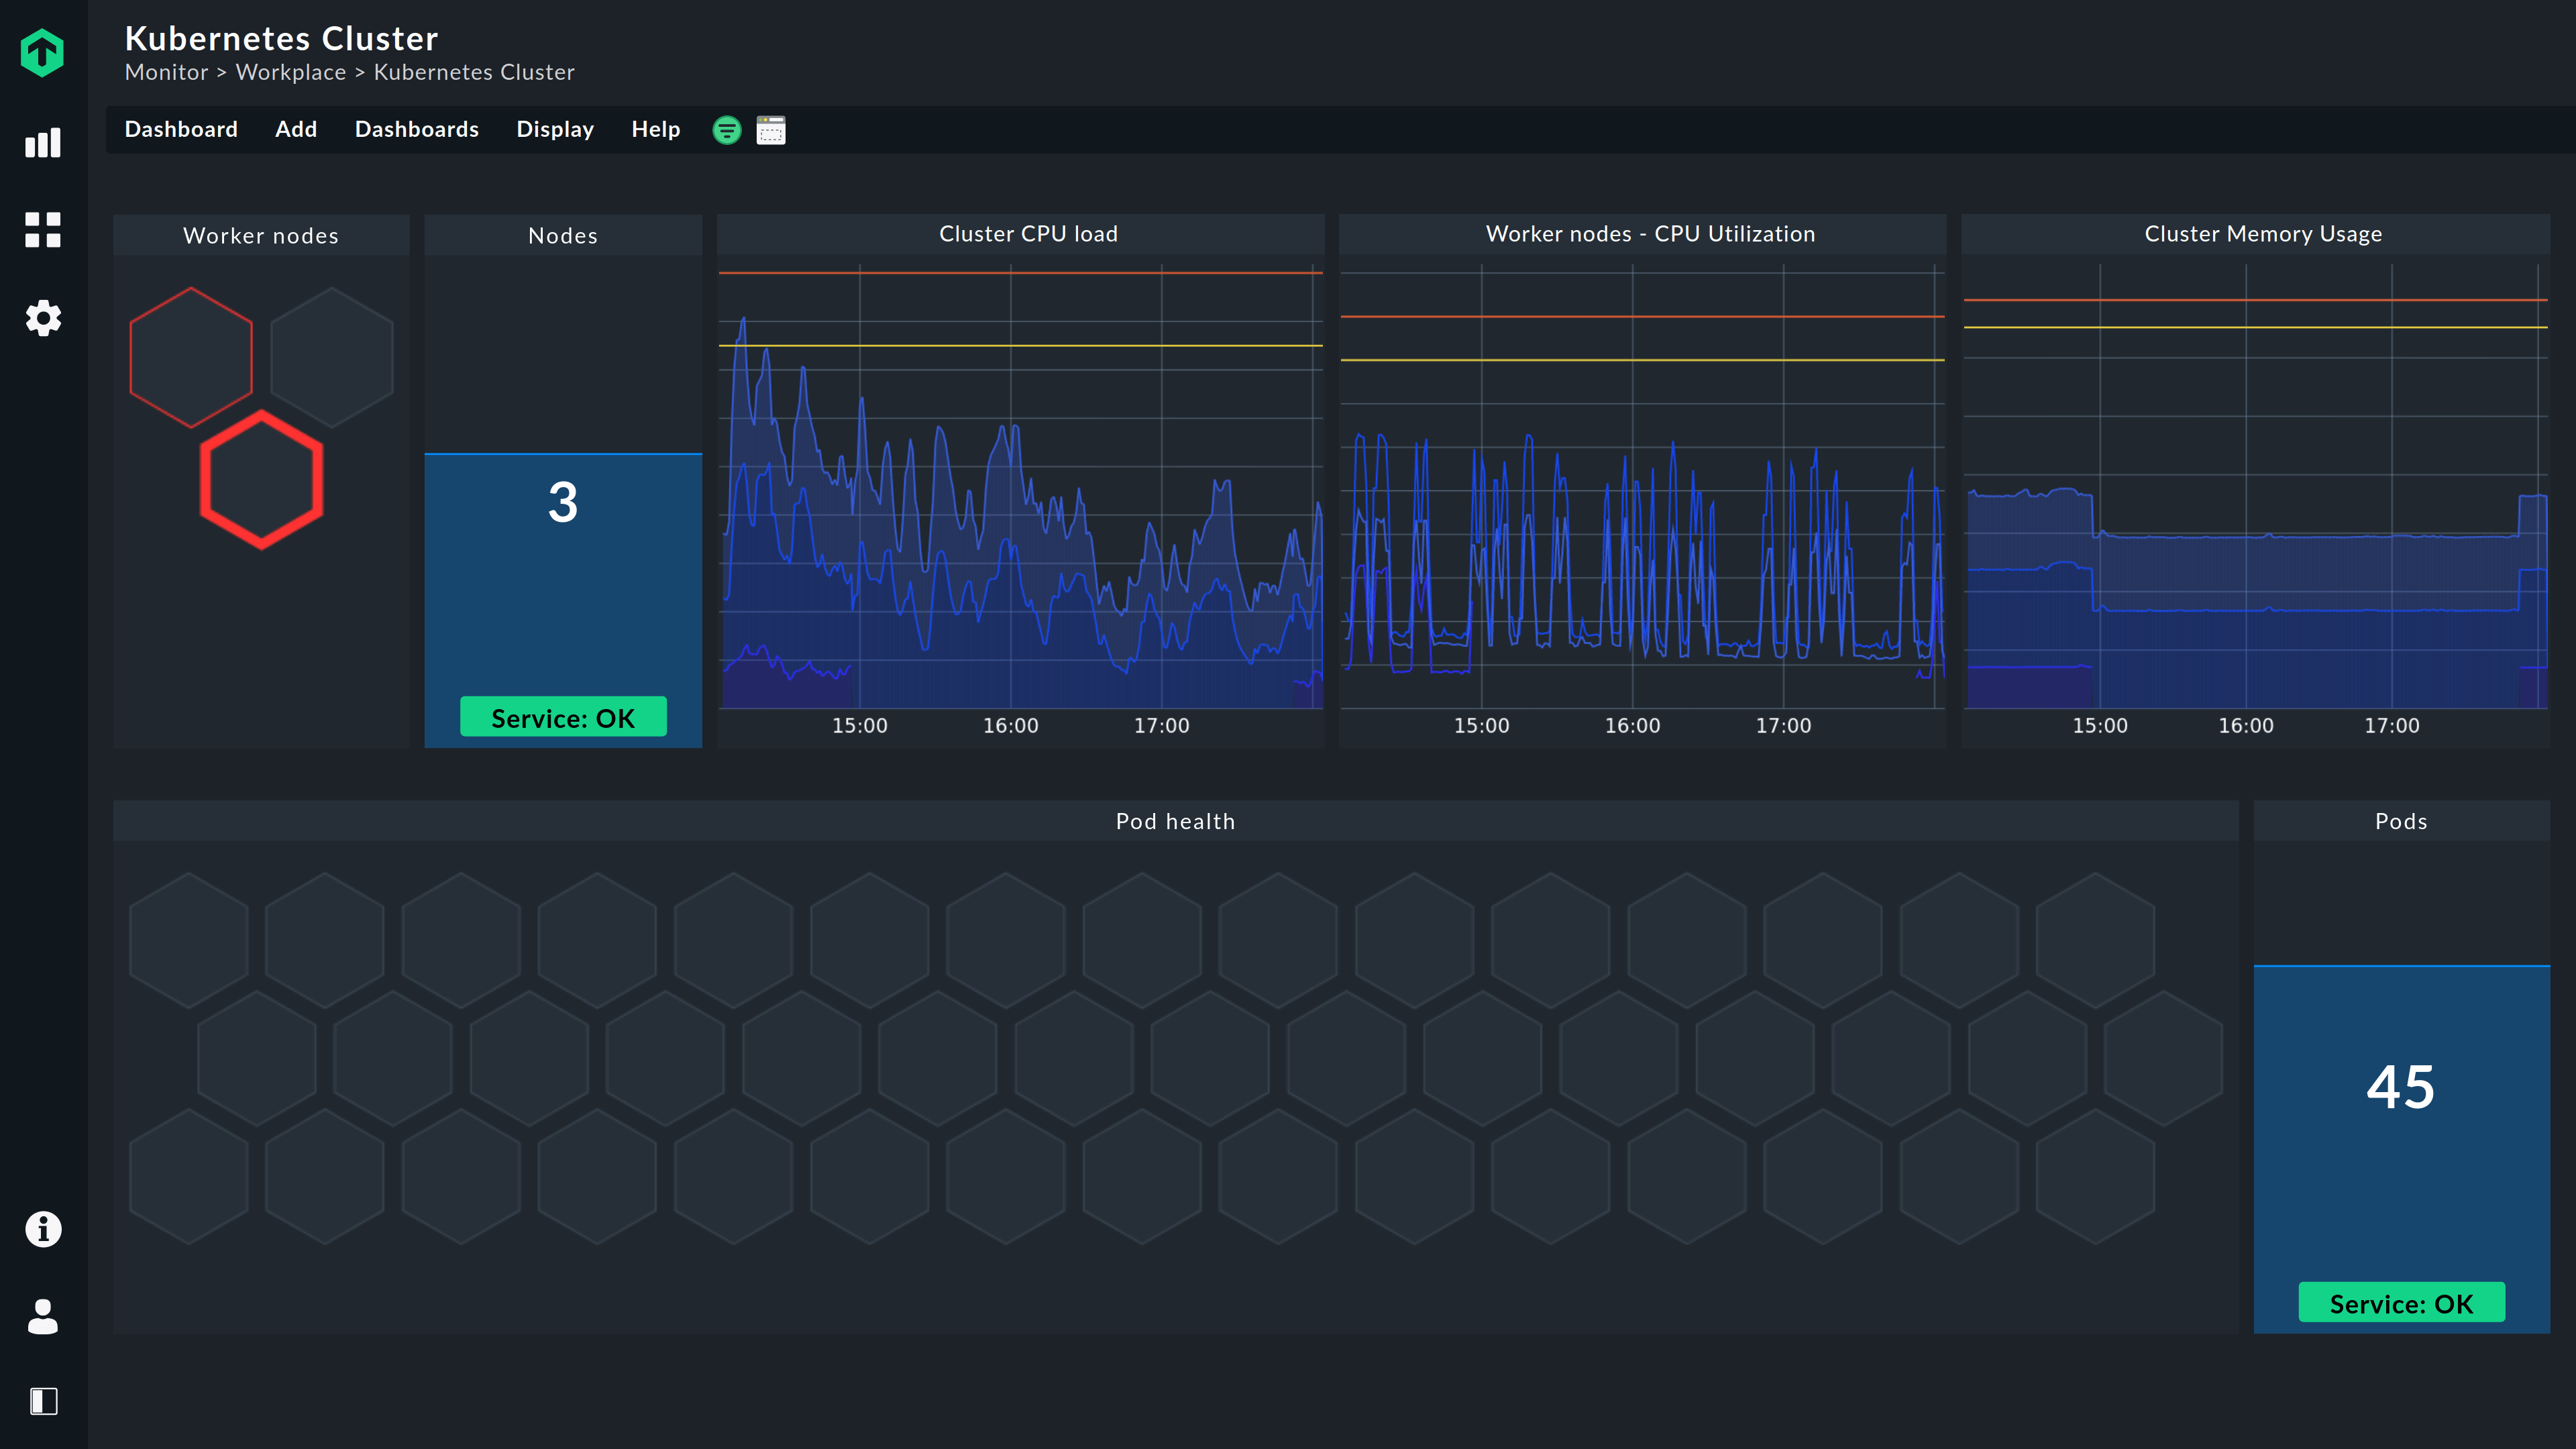
Kubernetes monitoring with Checkmk
Checkmk provides deep insights into your dynamic environments to ensure that everything is working as planned.
- Monitor namespaces, nodes, clusters and persistent volumes
- Monitor application-specific data (pods, deployments, services)
- Increase resource utilization efficiency with real-time monitoring
- Schedule and manage alerts across all Kubernetes clusters
- Leverage support for Prometheus adapters for your monitoring
- Create 'real' application views through Business Intelligence (BI) aggregations
- Monitor your Openshift environment beyond the current Kubernetes focus
Prometheus monitoring: Close the gap
If you already monitor your container environments with Prometheus, you have the problem that you cannot collect information about the underlying IT infrastructure. Therefore integrate your Prometheus monitoring system into Checkmk to monitor your IT infrastructure and fast moving container environments with one platform. Instead of having to check two monitoring systems, Checkmk allows you to correlate the data from both systems. Among other things, this facilitates a possible analysis of errors and their causes.
Checkmk enables the integration of the most important Prometheus exporters cAdvisor (Container Advisor), node_exporter and kube-state-metrics. It also offers the possibility to set up any metrics from Prometheus via a query in PromQL itself.
Through the integration in Checkmk the metrics from your Prometheus monitoring automatically get a meaningful context. For example, if Prometheus displays the amount of used memory correctly, you can use Checkmk to automatically see how much of the total available memory is used – without having to take any manual steps. The example shows that Checkmk can make your work easier already on a simple level and helps to close the gap between container monitoring with Prometheus and monitoring your IT infrastructure.
With Checkmk we have visibility and insight into the systems and applications that power our business. We know the lifecycle and usage patterns of our systems thanks to Checkmk and this is really a powerful feature when making important business decisions regarding these systems.
We do not have to do guess work, it is a matter of pulling up the right view or generating the report and looking at the details...
Trusted by global brands and local organizations worldwide


Resources
Try it yourself
Talk to us
Learn more about Checkmk
Ready to explore the full feature set of Checkmk?
Download the free trial and see it in action.