More and better Monitoring
 on Apr 29, 2024
The new release comes with numerous minor and major changes that enhance and improve the monitoring itself and/or significantly simplify the configuration of the monitoring. We have summarized the most important ones for you here.
Modern web service monitoring
With the rewritten HTTP check, the monitoring of web services has been completely revamped and strongly improved. Thanks to the new architecture, the plugin is not only much easier and therefore faster to configure, but it also provides helpful status information and more options for notifications.
The new check now allows you to configure different endpoints in your monitoring with just one rule. This significantly reduces the effort, especially in large environments. At the same time, the monitoring becomes more organized, as you can optionally integrate the monitoring of certificates with that of the corresponding website into one service.
The check not only provides you with details about why a service is CRIT or WARN but also gives you extensive information in the “Summary” of the service in the host overview. This includes:
- website error messages,
- delays in response time,
- use of an outdated TLS certificate,
- missing or incorrect content, or
- the expiration of the website certificate.
With the newly added certificate check, the monitoring of certificates is no longer limited to certificates provided over HTTPS. The new check can monitor any applications that provide a certificate via a TCP port, such as for LDAP or databases. This way, you can check the integrity of your certificates with Checkmk and react if necessary.

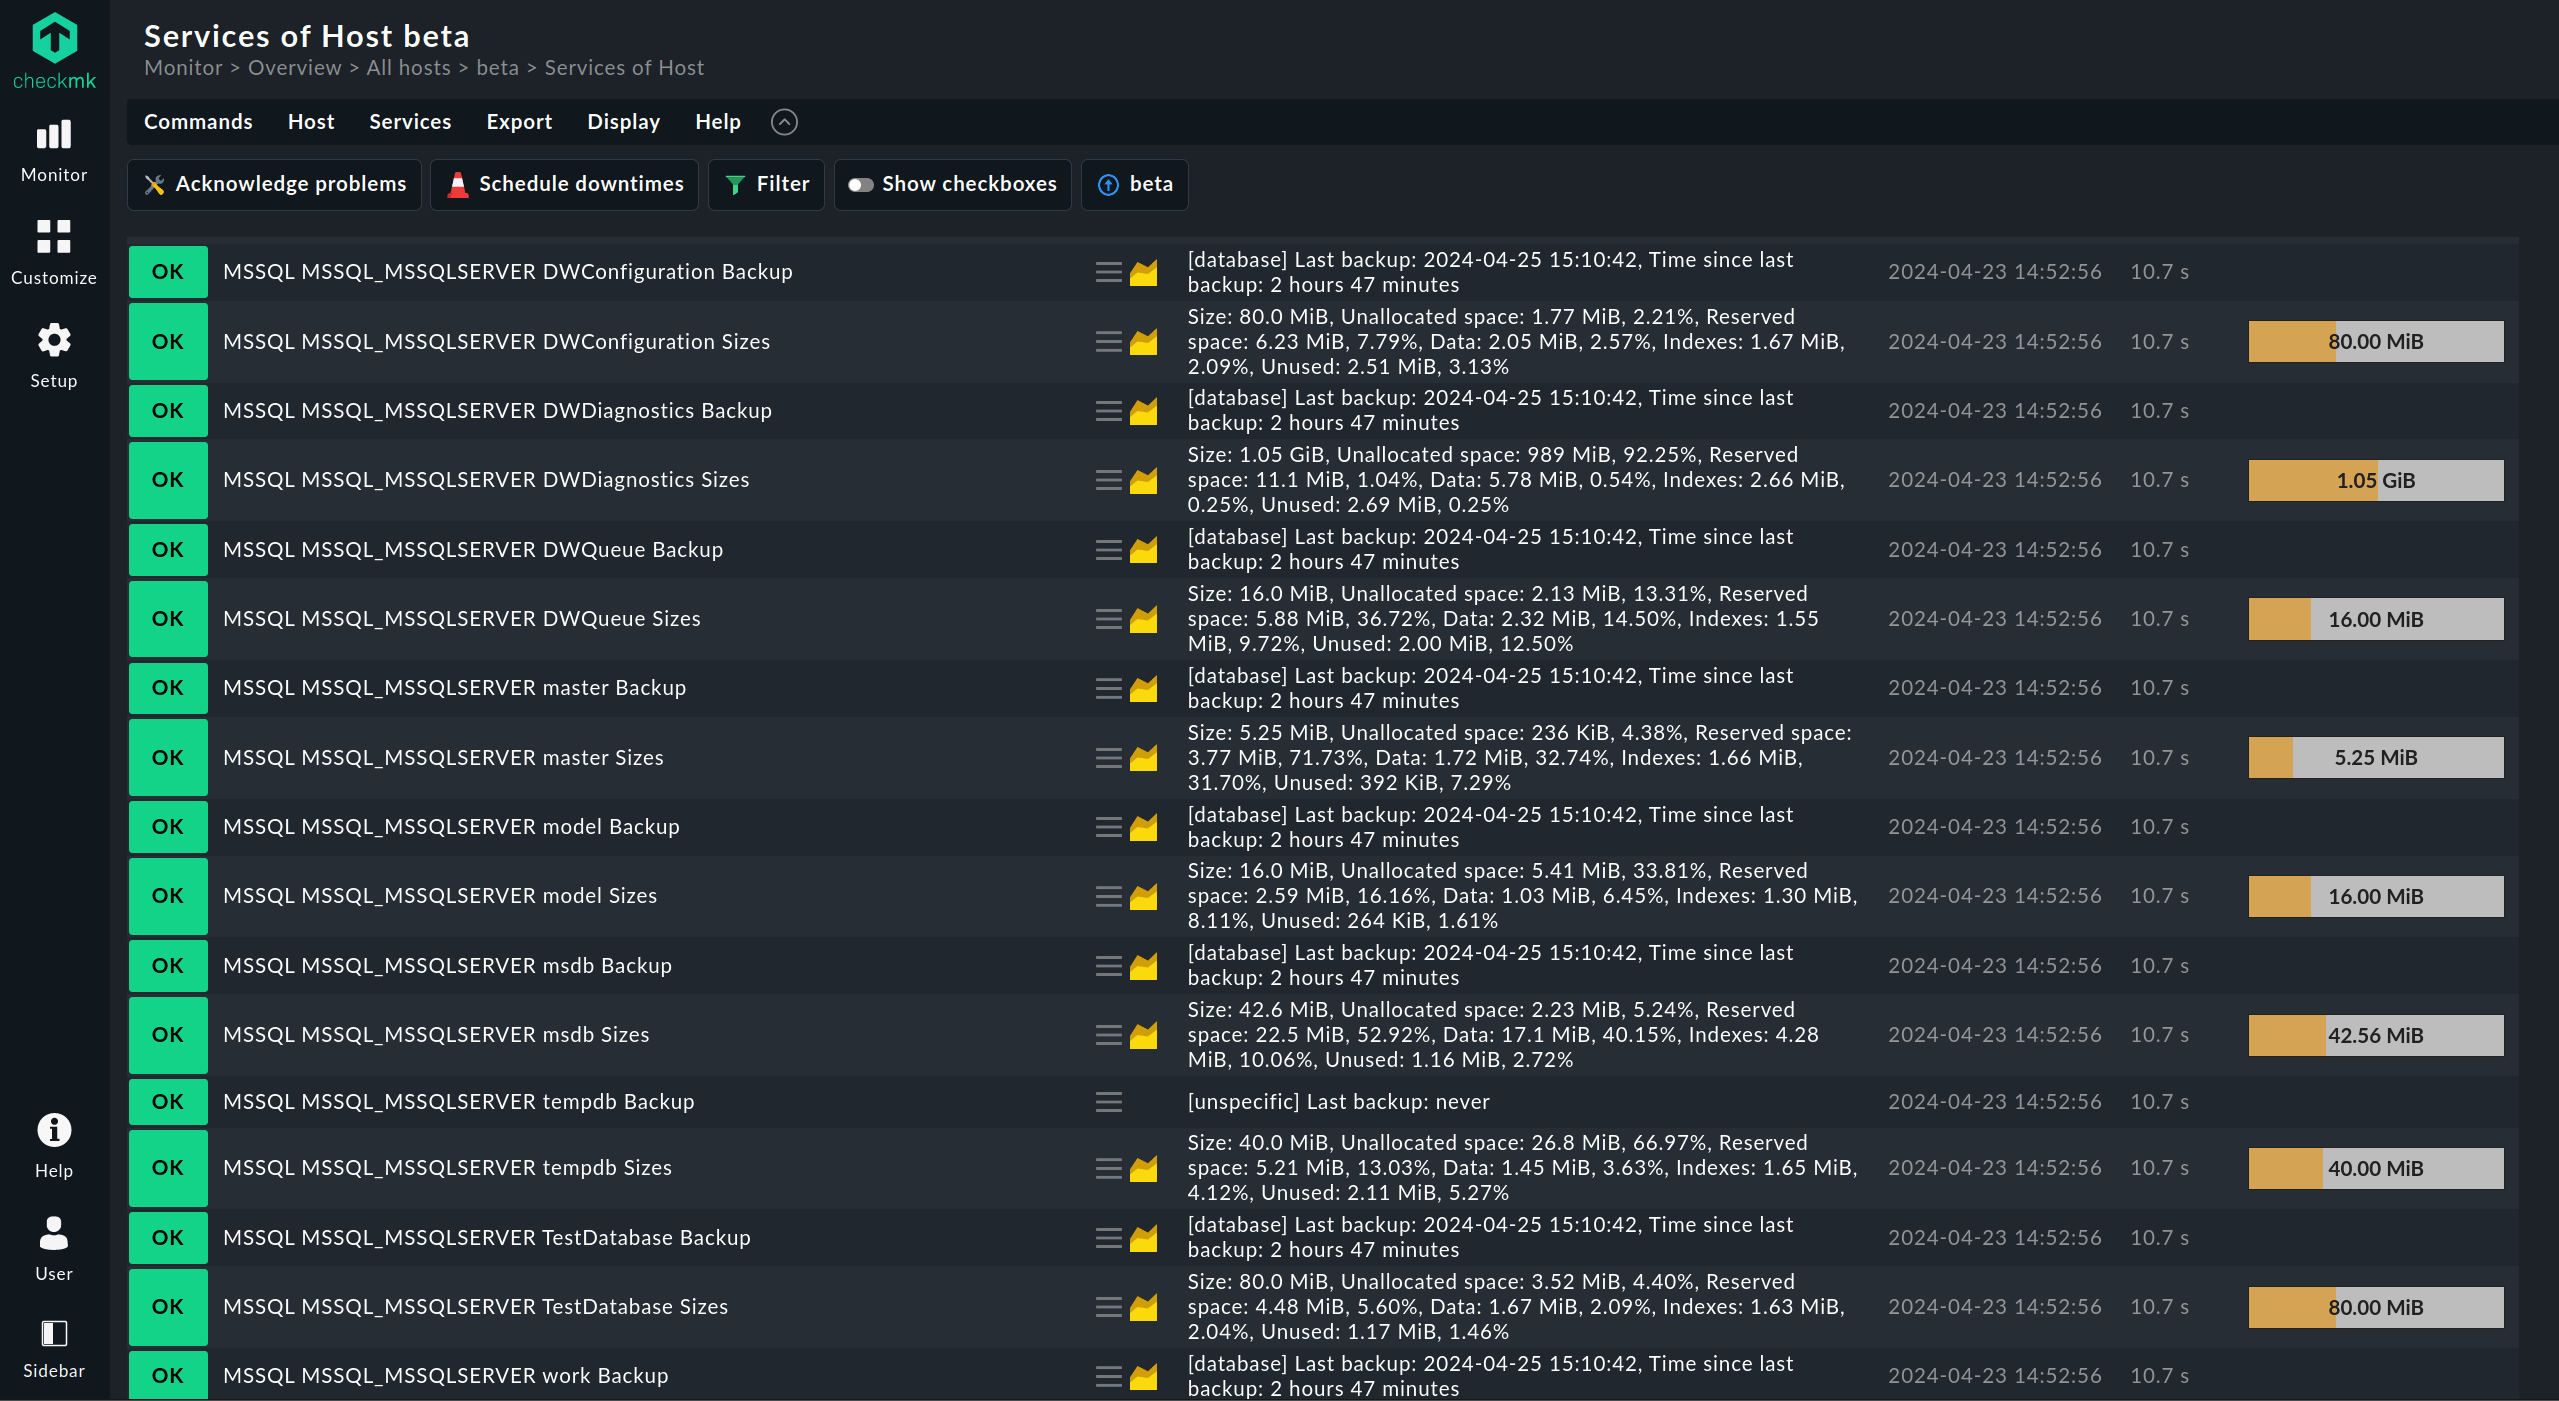
Next generation MS-SQL monitoring
The MS-SQL plugin has also undergone a complete overhaul. Thanks to the completely new architecture of the plugin, it is now not only significantly more performant but also offers much more possibilities for monitoring MS-SQL databases, such as:
- Automatic detection and monitoring of locally operated databases
- In-depth monitoring of remote databases, such as Microsoft Azure SQL
- Support for a wide range of special MS-SQL setups
- Individual handling of long-running queries
- Monitoring of any database that is compatible with MS-SQL queries
- Monitoring of MS-SQL databases on Windows and Linux (Beta)
Monitoring MS-SQL databases with Checkmk has never been as straightforward as it is now.
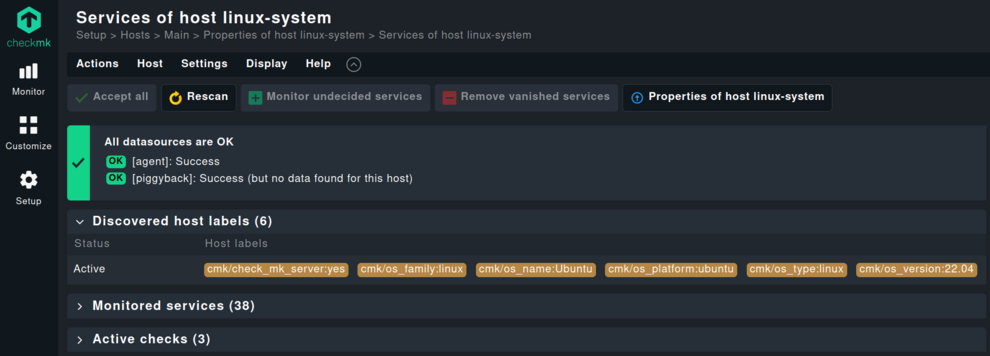
Powerful labels for your monitoring
From now on, Checkmk features additional labels for operating systems, which can be used for customized views or for alerting. Checkmk automatically creates the labels according to the type, platform, name, and version of the respective operating system. For example, for Ubuntu, the labels would be:
- cmk/os_type:linux
- cmk/os_platform:ubuntu
- cmk/os_name:Ubuntu
- cmk/os_version:22.04
Furthermore, the labels can be combined, thus mapping even complex scenarios in your alerting.
From version 2.3 onwards, you can use the labels in AND/OR/NOT combinations. Previously, this was limited to pure AND combinations.
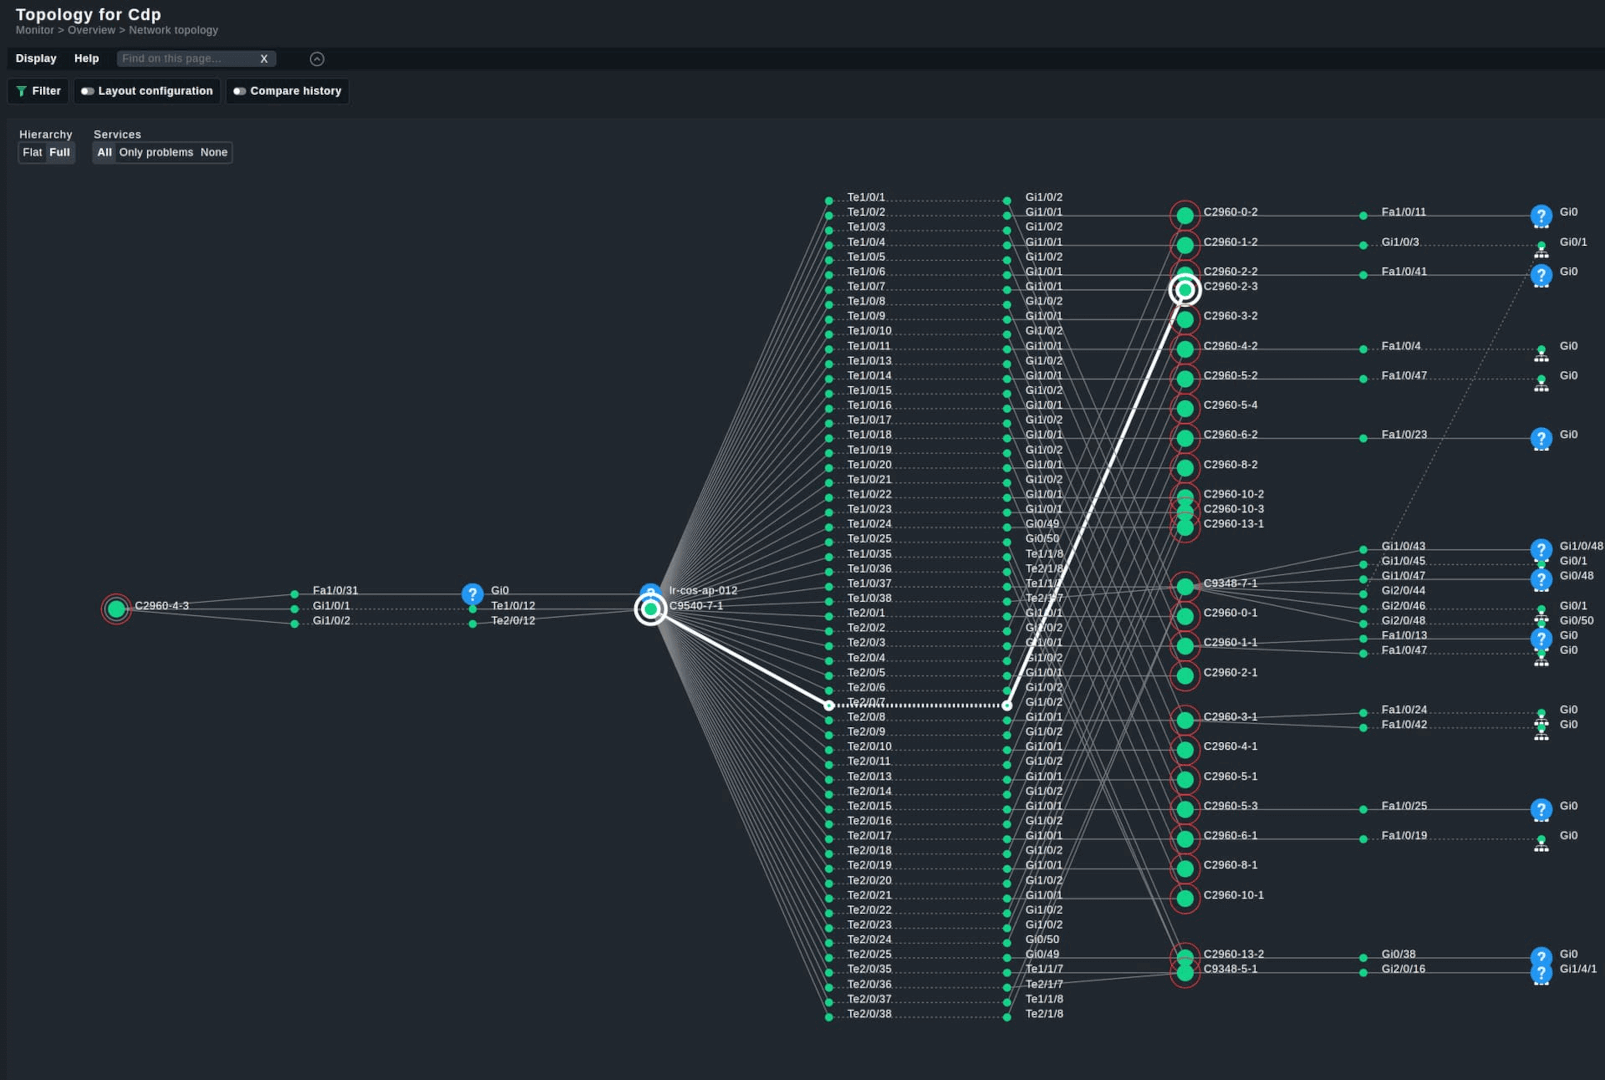
Visualize your L2 connections
The visualization of Layer-2 connections between hosts and interfaces has been possible through MKP since Checkmk 2.2. With the new version, this feature has now become a part of Checkmk. You can specify which hosts Checkmk should use as the starting point for calculating the mesh. The necessary data comes via a JSON file, based on LLDP data from switches.
In the view, you then have the choice between three different display modes:
- Show only the connections between the hosts.
- Show only hosts and interfaces with problems.
- Show all hosts and interfaces.
With every mouse-hover over a connection, you also receive information about all involved elements. This gives you a starting point for further analysis in case of network issues.
Important: Checkmk only offers the visualization of the data. You must configure the data input yourself.
Monitoring for any Kubernetes setup
With the new release, you can monitor all common Kubernetes distributions with Checkmk. Checkmk Enterprise, Cloud, and MSP offer in-depth monitoring of all essential metrics from the cluster level down to the pod level for:
- Vanilla Kubernetes
- AWS EKS
- Google Cloud GKE and GKE Autopilot
- Azure AKS
- VMware Tanzu
- Red Hat OpenShift
With Checkmk, you not only keep an eye on all important aspects of your chosen Kubernetes setup. Thanks to the visualization of the monitoring data in interconnected dashboards, you can also easily navigate through the details of your environment from the cluster level down to the pod level. Quickly identify or analyze issues, bottlenecks, instabilities, or heavy consumers in your Kubernetes infrastructure with Checkmk.
Additionally, as an Autopilot partner, Checkmk belongs to an exclusive circle of Google partners who are authorized to read node metrics for GKE clusters in Autopilot mode. This ensures that there are no gaps in your Kubernetes monitoring when you operate Autopilot clusters.
Enhanced datacenter monitoring
This release again brings many small and large improvements to the over 2,000 plugins. Specifically for the out-of-the-box monitoring of data centers, version 2.3 introduces several new features. For instance, Checkmk now offers detailed monitoring of clusters, hypervisors, and VMs in Nutanix environments. As a popular solution in data centers, Checkmk also provides a view for monitoring IT efficiency in Nutanix systems.
A new feature is the monitoring of PureStorage FlashArrays. Through the REST API of the arrays, Checkmk retrieves data including interfaces, alarms, storage capacities, and fans.
The Arista BGP check plug-in is replaced by a more general BGP peer check plug-in.
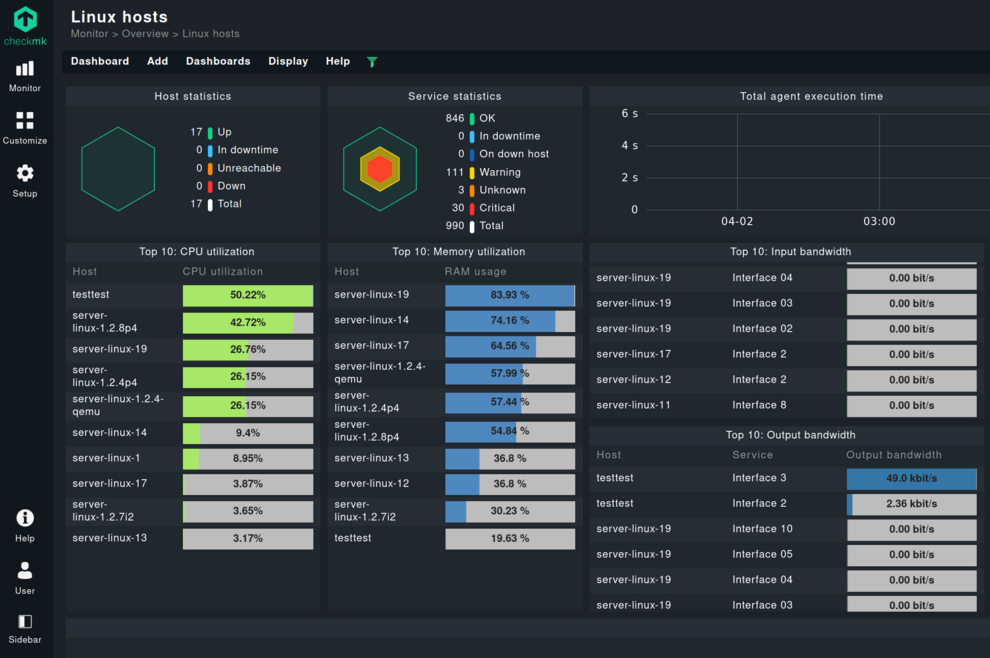
Top lists for your important monitoring areas
With top list, a feature desired by the community is introduced in Checkmk. The dashlet summarizes the top ten hosts or services, providing you with a quick overview of an important aspect of your monitoring.
It offers a quick glance at the top consumers of a specific metric, such as CPU or memory usage, thus allowing you to assess the health of systems and prioritize any necessary actions.
Top list summarizes your biggest trouble spots or hosts with the most problems in your IT infrastructure. This allows you to take early action to keep your systems up and running. The dashlet gives you an overview of the most or least utilized systems. This helps you optimize your systems and environment according to your needs.
Additionally, the top list dashlet is an important part of the out-of-the-box dashboards for Linux and Windows servers from Checkmk.
Host macros for checks and special agents
With the support of a wide range of standard host macros and individual host attributes for configuring active checks and special agents, Checkmk 2.3 not only reduces complexity but also offers more flexibility. This makes it possible to cover more options in the monitoring configuration with fewer rules.
Check out the other new features of Checkmk 2.3.
