Air quality monitoring with Checkmk
 on Jul 13, 2023
As monitoring experts we love to monitor stuff that directly affects us. In the case of our conference venue we knew from last year's conference, that the main conference room needed a proper AC and ventilation – and we also knew we could help with this. Read here how we managed to keep you from going to sleep (great speakers and fascinating insights aside).
Since 2022 we have had a collaboration with Watterott Electronic. It started with a pull request for the ’Watterott CO2 Ampel’, a WiFi capable CO2 sensor board. Although the pull request was initially just intended to showcase that a Checkmk agent can be implemented on extremely memory constrained devices (here ARM M0+, programmed with Arduino), the Checkmk agent is now part of the standard firmware that comes preinstalled on the sensor boards. Regarding this tech partnership, we decided to order a bunch of these sensor boards to test some new ideas for the minimal agent – and of course to properly monitor the indoor air quality (CO2 and temperature) at the conference. Another aspect was to demonstrate the capabilities of the revised dashboarding and packageable dashboards.

In contrast to cheaper sensors, the Watterott boards use (optical) NDIR sensors that are very accurate and thus suitable for professional solutions. Lower priced boards typically go for hot plate sensors that detect a broad range of volatile organic components originating from sweat, breath and digestion (TVOC, “Total Volatile Organic Components”) and estimate the CO2 (eCO2) from the readings. The estimated values can be quite far off in some situations, so when searching for CO2 sensors always opt for the more accurate optical sensors.
TL,DR:
Checkmk was utilized to monitor air quality during a conference, keeping track of CO2 levels, temperature, humidity, and pressure to ensure attendee comfort and identify potential issues early on.
- WiFi-enabled Watterott CO2 sensor boards equipped with optical NDIR sensors delivered precise readings, transmitting data through a REST API to Checkmk dashboards.
- A single access point along with multiple sensors effectively covered the venue, allowing for real-time detection of air conditioning failures and temperature variations.
- Interesting findings included spikes in readings from cleaning equipment and pressure changes related to weather, although some minor calibration issues with the sensors were observed.
The integration
Watterott’s boards can be operated stand-alone with a traffic light like colored indicators using four RGB LEDs and an additional buzzer. As well as that they provide sensor data via a USB serial interface. Of course the best feature is that once added to a WiFi network, they provide the Checkmk agent output as an REST API endpoint – this makes them probably the easiest sensor boards to use with Checkmk. To include the CO2 sensor boards in the monitoring, you just have to switch from a normal agent on port 6556 to a datasource program that calls the REST API endpoint via the IPv4 address:
curl http://$_HOSTADDRESS_4/cmk-agent
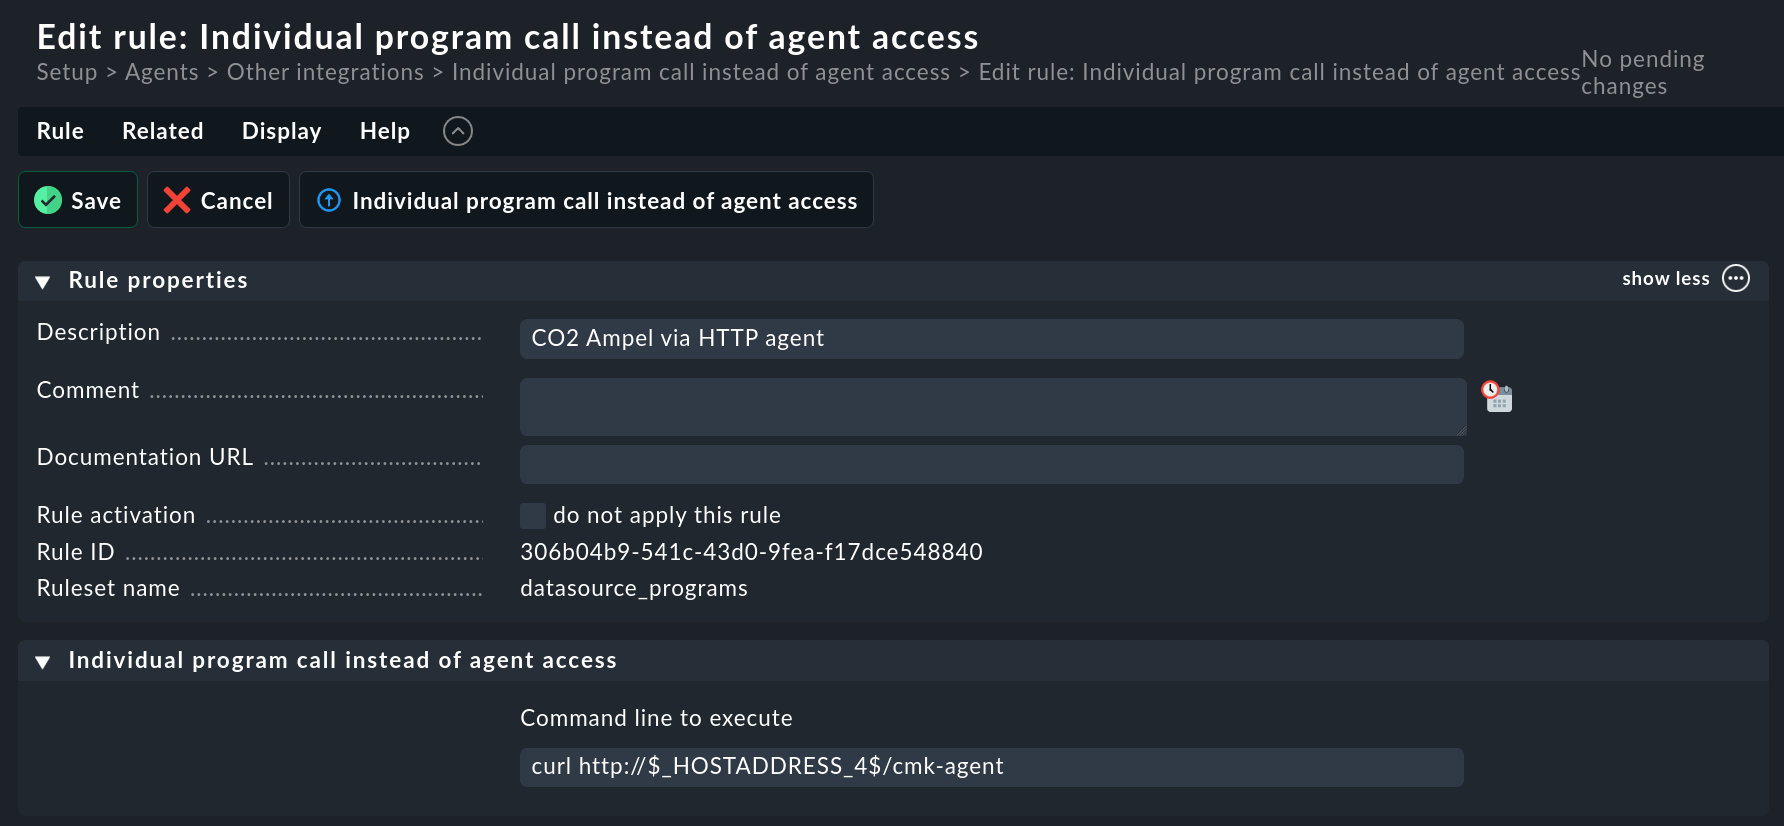
Since a local check for CO2 is included, the sensor boards immediately provide a useful service. Besides CO2 levels and temperature, these boards also include a humidity and a barometric pressure sensor, using a plug-in available in our exchange. These sensors' primary purpose is to adjust CO2 readings but also can provide some fun of their own.
More on the fun part later.
The setup
Paulaner am Nockherberg is a large yet overseeable location. Since the WiFi provided by the host did not allow communication between the stations (a sensible default), we prepared an access point and an old ‘nettop’ to act as both a Checkmk server and dashboard display. Despite being a usable setup in the testing environment, the nettop’s weak WiFi antenna and the processor’s poor cooling at temperatures of up to 32°C both made the work hard in the live environment. So, at around noon on the 20th (first conference day) we switched to a far more capable notebook. This move was easy thanks to omd backup and omd restore.
We used a single dual WiFi OpenWRT access point to cover the whole location. In total, five sensor boards were used: three WiFi in the main conference room, one USB at the Checkmk server and another WiFi sensor in the foyer. We tried to put the sensors as far away from each other as possible. This worked quite well, although the high number of active 2.4GHz stations meant high latencies, package loss and channel hopping, resulting in occasionally missing monitoring data. However, given the redundancy of the sensors and inertia of air exchange, gaps in sensor readings were deemed acceptable if they stayed below 10 minutes.
The first conclusion from this practical experience is that in environments with high radio noise in the 2.4GHz band, or on larger sites in general, you might want to use the version with an additional LoRa transmitter module. Unfortunately to date there is no software integration for LoRa, so ask Watterott for a quote if you are interested in a full integration.
Productive use
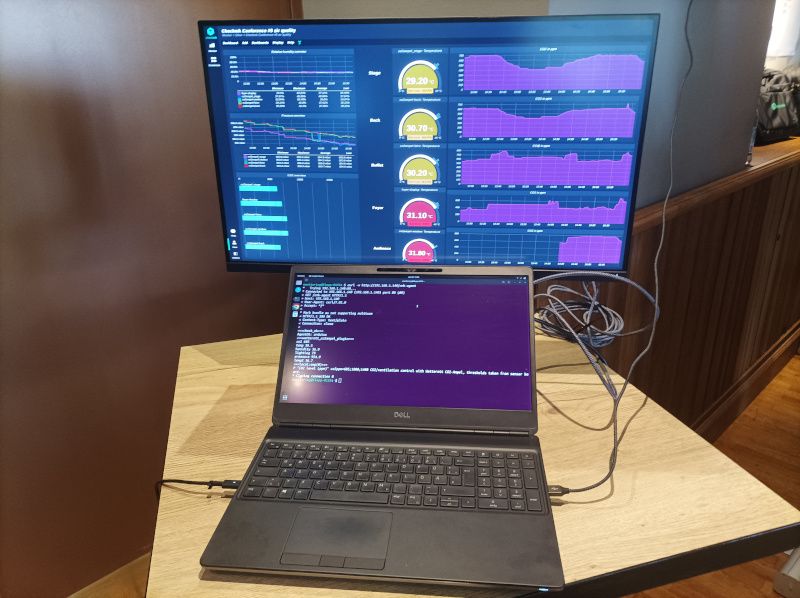
The picture above shows our setup at the bistro table in the foyer. The screen displays our first dashboard with four hour graphs. When enough data was available, we switched to 25 hours. The terminal window was used to show the output from the minimal Arduino agent.
During the conference we created and adjusted the dashboard on a separate machine and only copied them to the production environment. This works thanks to the new packageable dashboards feature available since version 2.2.0. In practice, due to the screen formats differing between the development notebook and the monitoring screen, minor adjustments were necessary. But this caused much less confusion than, for example, having to deal with multiple dashboards for the same purpose, as is the case when doing dashboard development on the production Checkmk site by cloning a dashboard present.
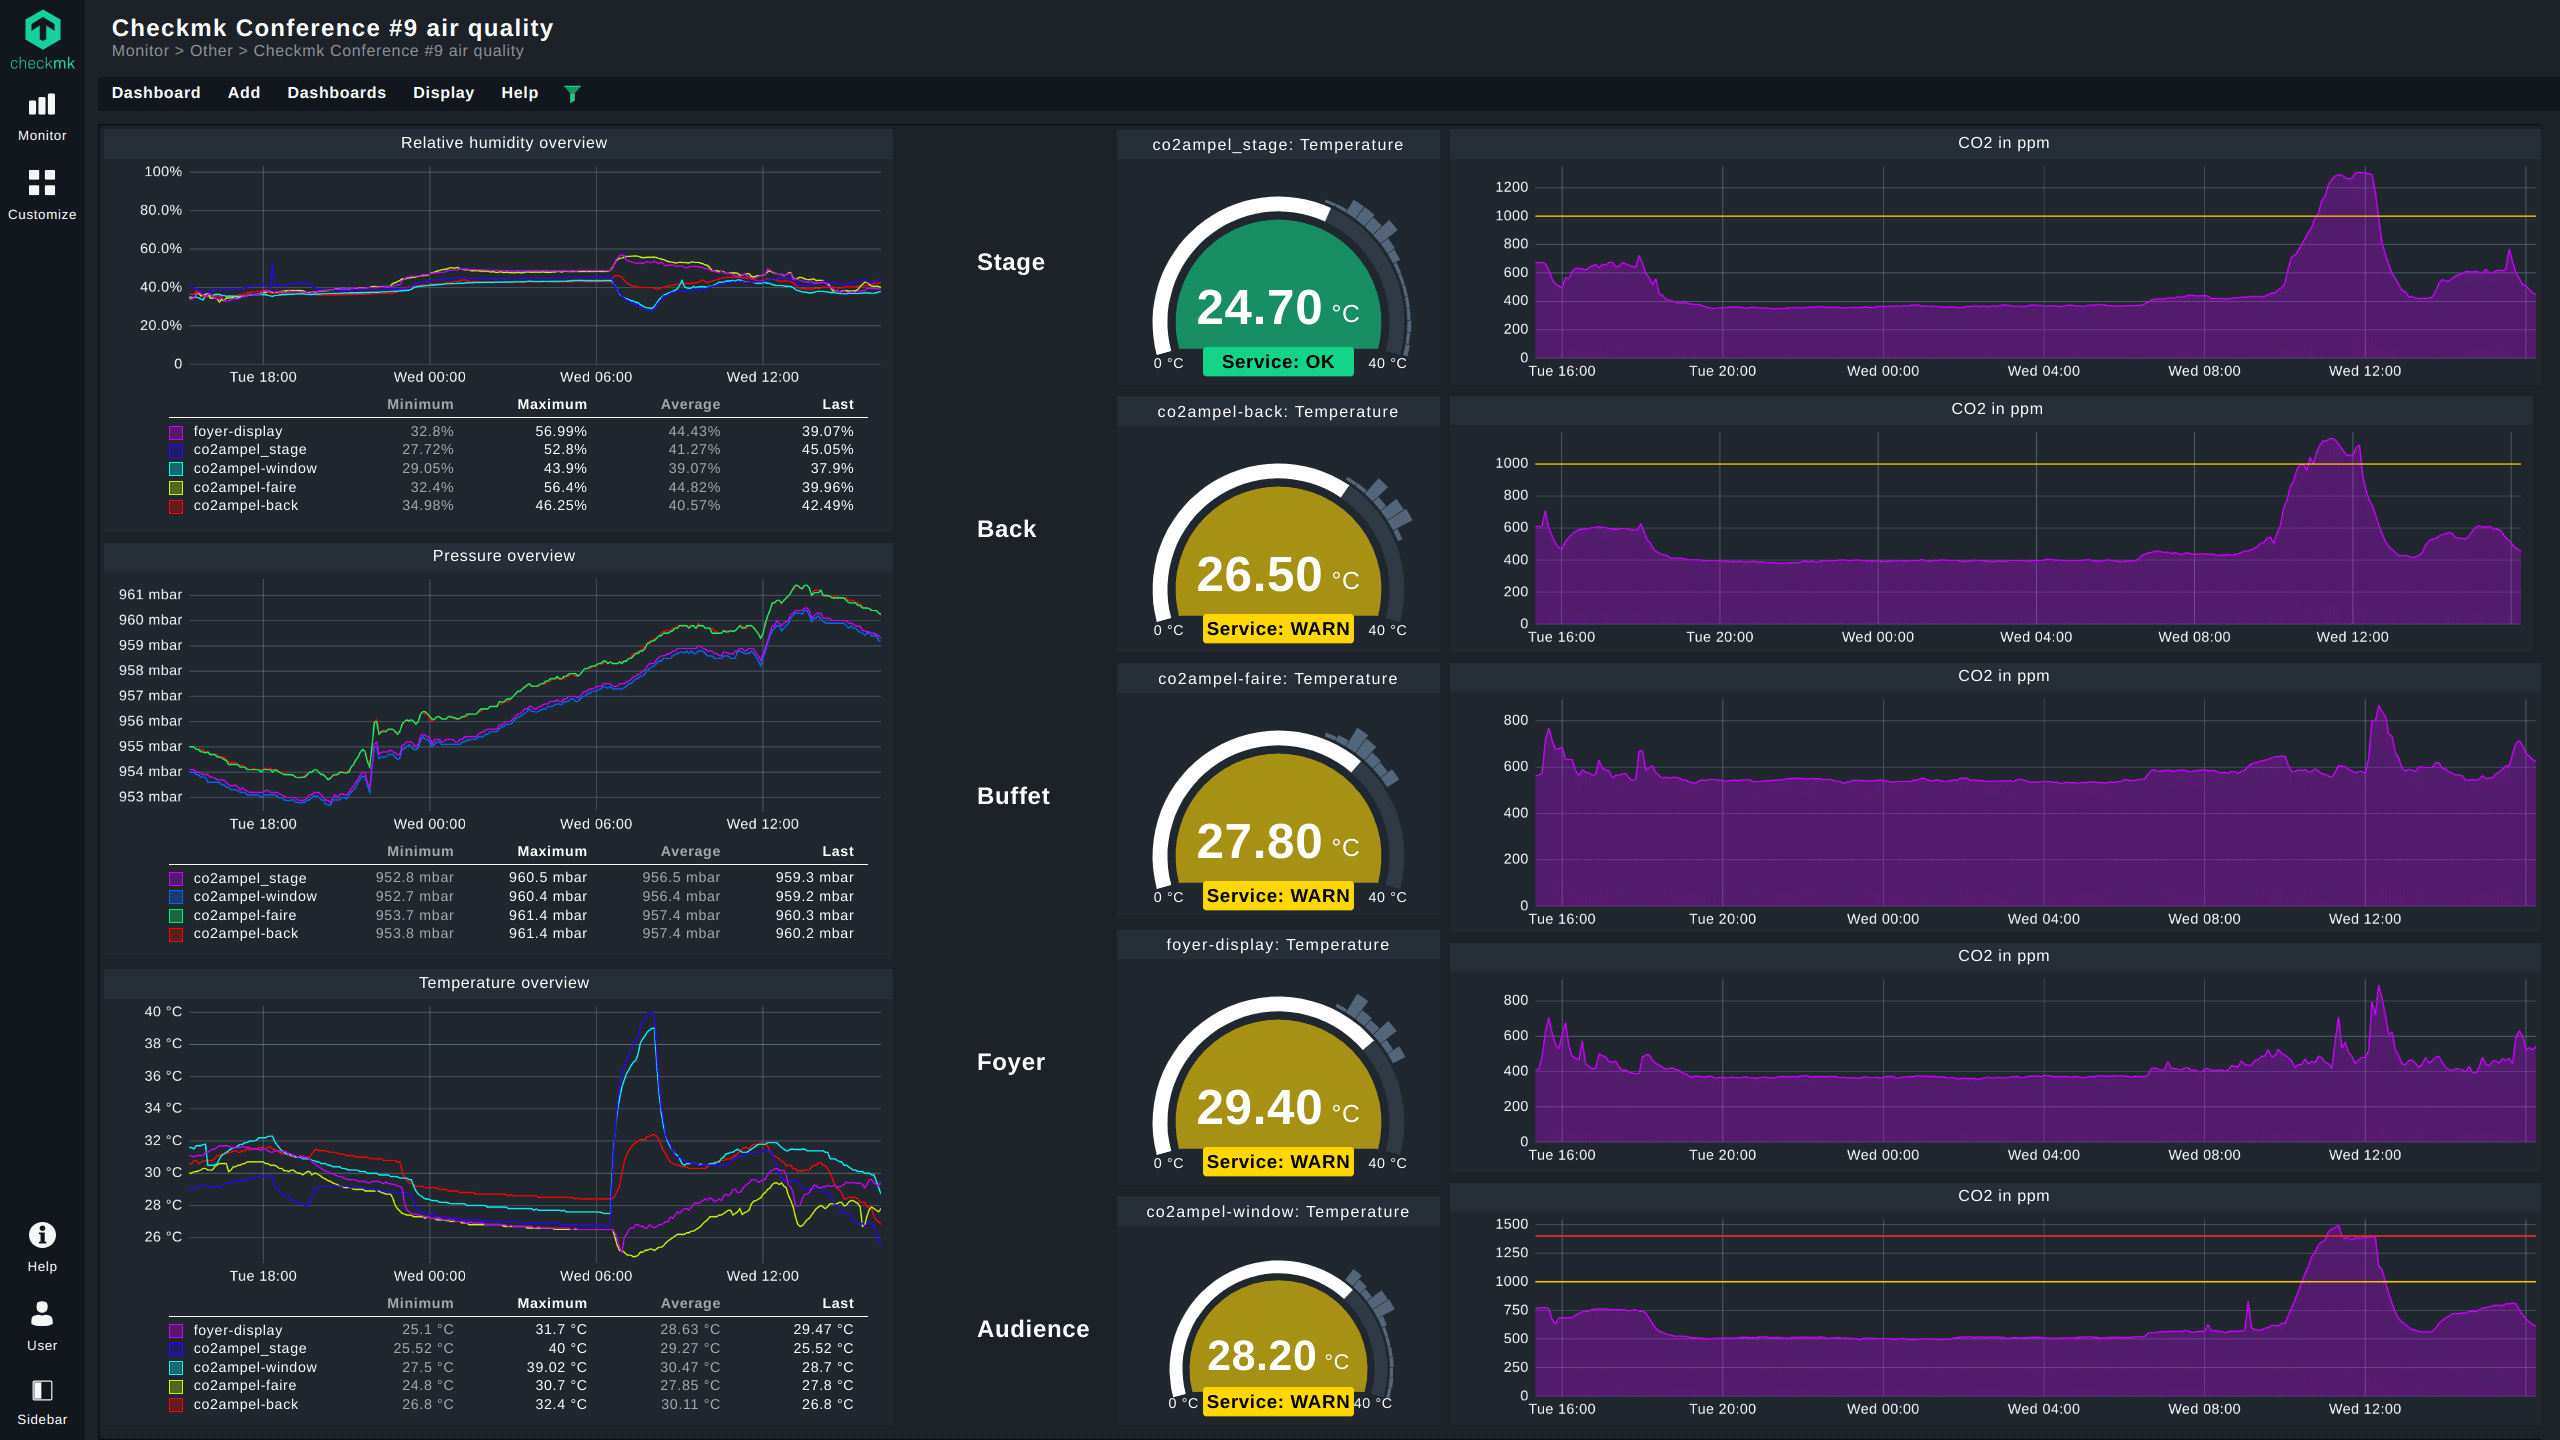
The data from the monitoring was at first unimpressive in the best sense: CO2 at first did not exceed 800ppm, which is very good given the large location and the many 1200ppm readings recorded during last year's conference. Additionally, the temperature difference between the stage area, where most of the conditioned air was available and the back of the room was significant: The minimum temperatures at the stage were around 24°C, and the maximum temperatures at the back were around 33°C, with a typical difference of 2–3°C between the stage and the back of the hall.
This went well until the air conditioning malfunctioned on day two. Here the rise in CO2 was much faster than the rise in temperature. At least this early indicator led to an early detection of the failure and enabled a repair during the lunch break. The next screenshot shows the final dashboard half an hour after the last talk. The spike of up to 1400ppm is as clearly visible as the normal operation in the afternoon.
The fun part
Of course, we did have some interesting anomalies we would like to share with you. What happened here? What might have caused the heat peak between 7:00 and 8:30 AM?
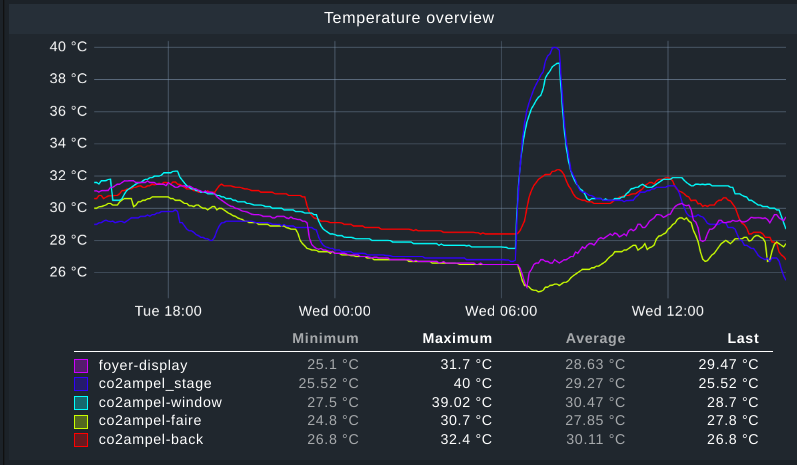
We puzzled about this a bit, and guessed that it was somehow related to cleaning. This was confirmed when they finished cleaning the hall with a ride-on scrubber-dryer.
We did not check whether the machine used was battery or propane powered, but given the low efficiency (and thus high heat emission) of propane engines it could well have been propane. The fact that the CO2 levels also show their first slight increase at around 7:00 am seem to confirm this.
Another interesting result was the graph of falling atmospheric pressure on the first day: Everyone involved suspected that rain was coming.
Calibration needed
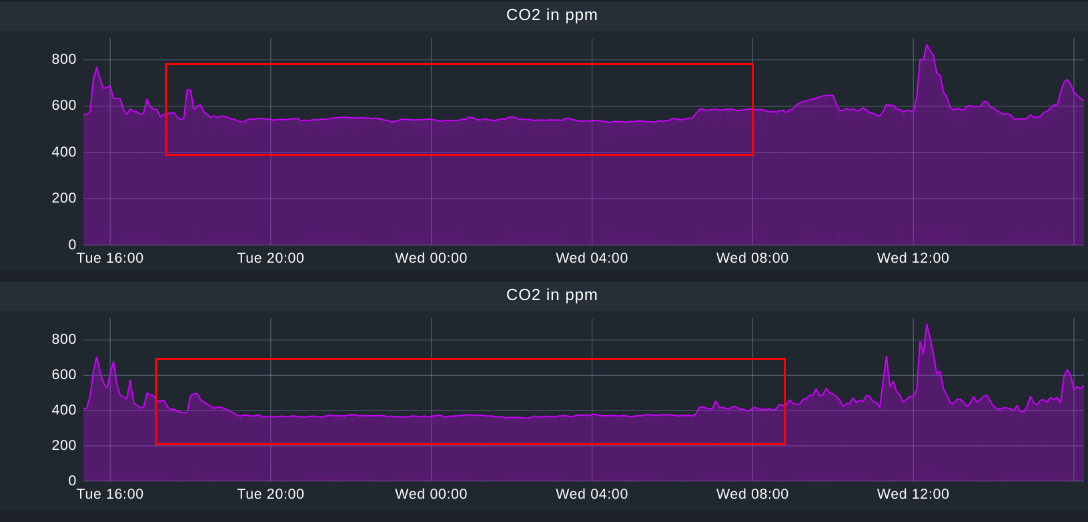
Regarding the precision of our measurements, not everything was perfect: You see one sensor never reading below 530ppm and another one going as low as 370ppm. Both are not very plausible, since around 420 to 430ppm are to be expected after in the early morning.
In both cases the sensors should have been recalibrated. Here ‘transport shock’ might be the most probable cause. If despite setting the correct altitude, sensor readings are far off what is expected, blame it neither on Watterott, nor Sensirion (manufacturer of the sensor). The most likely reason could actually be due to careless parcel handling. Since we did not want to interrupt the time series, we did not recalibrate this time.
Conclusions and outlook
We will continue CO2 monitoring at the next conference, probably with two access points to fully cover the foyer. Although the lack of an auto detection is no problem with only a few sensor boards, this changes with the number of sensor boards. With this in mind I have started work on an auto detection script that uses the REST API to create hosts.
Get your own Checkmk branded CO2 sensor board!
While you can always buy the CO2 sensor boards at Watterotts online shop with a green PCB and no Checkmk logo, you might be interested in the version with the Checkmk hexagon as shown at the conference. Watterott still has boards with green PCBs left, but they might switch to white PCBs for the next batch.
For production planning, Watterott needs numbers. If you are interested, please contact co2@checkmk.com with an estimated number of boards you are going to require and whether you want to wait for white PCBs or are okay with green PCBs. We’ll then send you the order link as soon as Watterott has opened the orders and we will also update this blog article accordingly.
