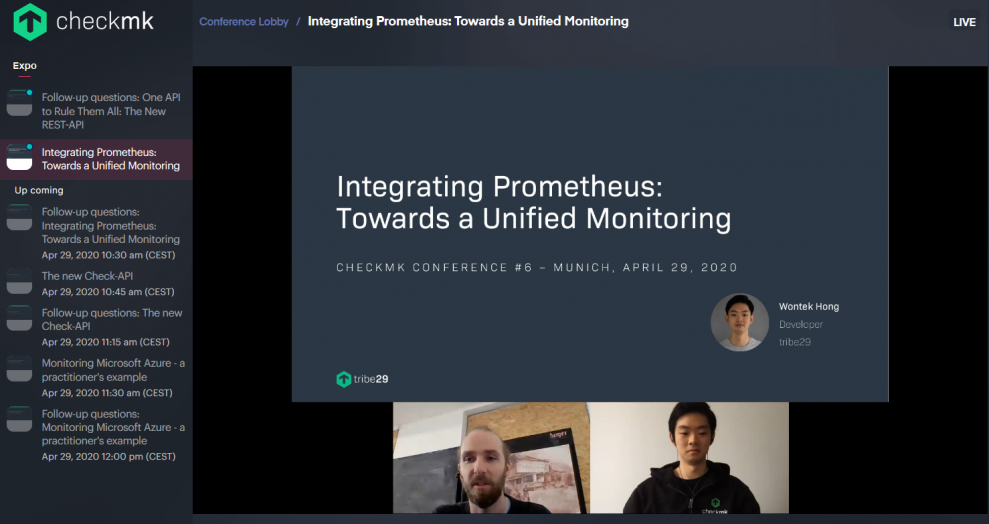
In addition to integrating ntop’s network flow monitoring, we also told you at Checkmk Conference #6 about the new integration with Prometheus, an open source software that is often used to monitor fast-moving container environments. As Checkmk can already monitor containers as well as Kubernetes, the obvious question is: why do we integrate Prometheus?
If a DevOps team relies on Prometheus in a company, while the IT operations team use Checkmk, the exchange of information between the two groups concerning problems is difficult – as Wontek Hong explained in his lecture at the Checkmk Conference #6. With the integration of Prometheus, we want to use Checkmk to close the gap between IT operations teams and DevOps teams. In future, it will be possible for both teams to share information, and thus have the same level of knowledge to aid in problem solving.

Wontek initially gave the audience a brief overview of the functionality and logic of Prometheus. Since the software records real-time metrics in a time series database, which it retrieves using an HTTP pull model, Prometheus enables very flexible monitoring. This also means that the software is very metric-based and depends on collecting as many metrics as possible.
So-called exporters help to export the existing metrics from the various systems to the database as Prometheus metrics – such as a Redis exporter for Redis metrics. The Prometheus team currently supports 13 of the 161 exporters presently available. With its own query language PromQL it provides a powerful, yet complex tool to analyze the data.
Through this integration, Checkmk combines the flexibility of Prometheus with its own context-based monitoring. The integration is based on a special agent running on the Checkmk instance. On the one hand, exporter metrics can be transferred to Checkmk and displayed there in Checkmk’s host/services scheme. These services can be then used for alerting with the powerful notification system of Checkmk. At the beginning, Checkmk supports the three most popular exporters.
On the other hand, a user can send PromQL queries from Checkmk. The Special Agent then processes the response from Prometheus and transfers it to Checkmk monitoring. In contrast to the exporters, the user cannot set threshold values with Checkmk for his own PromQL queries. In a short demonstration, Wontek gave an initial insight into the possibilities of the integration of Prometheus into Checkmk.
With the integration of Prometheus in Checkmk, tribe29 is taking an important step towards an uniform monitoring. Dynamic container environments are already an important part of the IT environment in companies.
The Video of Wonteks lecture is now online:
In our next post you will learn everything important about our new REST-API and Check-API.
