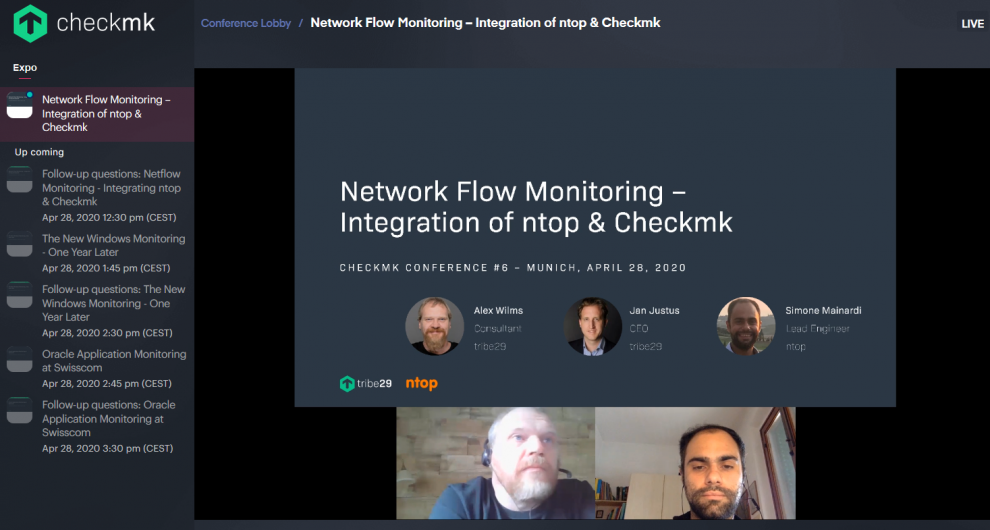
Our Checkmk solution originated from the open source community, so we see it as our duty to maintain and promote this philosophy. We are therefore pleased that with ntop we have now found a partner who also comes from the open source world and who shares similar values with us. The integration of Network Flow Monitoring from ntop also helps us to expand Checkmk's range of functions by one significant point – the in-depth analysis of network traffic. At the Checkmk Conference #6, our consultant Alex Wilms and ntop's lead engineer Simone Mainardi explained the integration between the two software solutions.
Checkmk already offers network monitoring and provides metrics – such as bandwidth, packet rate, and error rate. It also enables monitoring of the status and speed of network interfaces and threshold values. "However, many users want to dive deeper into the problem analysis and take a look at the network flow", explained Alex. The native integration now allows the transfer of data and dashboards from ntop to Checkmk monitoring.

The integration gives users a deeper insight into their network traffic, so that they can identify possible bottlenecks in their infrastructure, or perform in-depth performance monitoring of their network, for example. The details are in the flow data of a network. There are various protocols and sources for collecting the data – such as sFlow, NetFlow v5/v9, NetFlow Lite, IPFIX, Mirror Port or eBPF.
In a standard ntop architecture, a collector (nProbe) collects the data from the devices or exporters in the network, and forwards this to the ntopng – ntop's analysis console. The network flow data is processed by ntop via a web interface in various diagrams, such as the top talkers, a detailed performance of the network interfaces in real time, or where most of the data traffic goes within the network. However, ntop also alerts when threshold values are exceeded or if it detects irregularities, and offers a drill down-option for direct analysis of the triggered event.
With Version 2.0, Checkmk offers various integration options for ntop. On the one hand, there is the integration of alarms and events. This includes the list of detected alarms and the 'Alert Summary'. According to Alex, it should also be possible for ntop alarms to trigger notifications in Checkmk. Checkmk also integrates the collected metrics and traffic data from ntop. The main and traffic dashboard from ntop should be available in Checkmk. In addition to providing the network flow in Checkmk, users should also be able to access the ntop data for a relevant host in Checkmk. It is also planned that special ntop graphics can be built into Checkmk's views. The aim is that both ntop and Checkmk users get the same look and feel as would be the case with pure ntop use.
But we also want to act as a one face to the customer. We treat the ntop integration as an add-on for Checkmk. The integration is carried out by tribe29 or a partner. First and second level support can either be obtained from us, one of our partners or from an ntop partner. Third level support is also offered by ntop – however it is also possible to obtain first and second level support directly from ntop.
We released the video of the lecture on our YouTube-Channel:
In our next blog about the Checkmk Conference #6 you will receive all of the latest news concerning our Windows Agent.
