Monitoring Elasticsearch with Checkmk
 on Jun 18, 2020
Whether on your own machines or in the cloud: applications generate huge amounts of data – every day, every hour and every minute. We're no longer talking gigabytes or terabytes, more like petabytes, exabytes and zettabytes. At the same time, we're looking for ways to search through all of that information quickly and effectively – a real challenge that requires flexible and scalable solutions.
Apart from some proprietary solutions like Splunk or Solr, there is, of course, Elasticsearch. It's one of the most popular Open Source search engines. While it's perfectly capable to dig through huge amount of data, it doesn't really offer a detailed insight into its own state – at least not via a graphical user interface. There is Kibana as part of the Elastic stack, but maybe you're not running a full Elastic stack (including Elasticsearch, Logstash, and Kibana), but just the search engine on its own.
In order to track what's happening with your Elasticsearch installation, you don't need the full collection. It's possible to use any other monitoring solution to check on the search engine and see how it's performing. This article explains some basic concepts of Elasticsearch and makes some suggestions about what to monitor. Then we're going to show how to configure Checkmk to keep an eye on Elasticsearch and its performance.
TL;DR:
The article explains the basics of Elasticsearch and highlights what to look out for when monitoring it – including a step-by-step guide on how to monitor Elasticsearch with Checkmk.
- Almost any monitoring solution can be used for monitoring Elasticsearch.
- Important monitoring aspects for Elasticsearch include:
- Number of nodes, especially data nodes
- Open or pending cluster tasks
- Node metrics such as CPU usage, memory, file descriptors, etc.
- A step-by-step guide shows how to collect these metrics with Checkmk and use them for performance monitoring.
How does Elasticsearch work?
Elasticsearch is a distributed, RESTful search and analytics engine based on Apache Lucene that offers a fast full-text search engine for all kinds of structured and unstructured data, e.g. log files, financial information, geographic data, etc. It is implemented in Java. Together with Logstash (data collection), Beats (data shipping), and Kibana (visualization) it forms the so-called Elastic Stack, formerly known as ELK stack.
Elasticsearch is not only fast, but also scalable – you can add servers (so-called nodes) to your clusters to increase its capacity. This works because an Elasticsearch index is really just a logical grouping of one or more physical shards, where each shard is actually a self-contained index. By distributing the documents across multiple shards and then distributing those shards across more than one node, it ensures redundancy. Of course, the software automatically migrates shards when the cluster grows or shrinks.
As the search engine is often used in business-critical areas, monitoring its status and performance is vital. Administrators should always have information about their Elasticsearch clusters, nodes, indices, and shards. If they identify anomalies, they probably need to adapt the configuration and maybe even add resources. Of course, all changes in the setup should be visible straight away in the monitoring solution.
Things to monitor in Elasticsearch
So, what should you monitor in Elasticsearch? We've mentioned nodes, clusters, indices, and shards. Several nodes form a cluster, and those nodes working together increases the speed and ensures redundancy. If one node fails, the overall performance of the whole cluster goes down, so you want to make sure that all nodes are working flawlessly. Determining the amount of working nodes as well as the amount of the data nodes (which are responsible for executing the actual search requests) is only one aspect of monitoring Elasticsearch.
If a cluster is too slow to process its tasks, or if a lot of tasks are pending, this could be an indication of an incorrect configuration or the need for more resources. You should really be careful to avoid time-outs and thus watch out for idle times and failing tasks.
Here is a list of things in your Elasticsearch clusters you should always know about:
- Number of nodes
- Number of data nodes
- Pending tasks
- Detailed information about nodes, e.g. CPU usage, file descriptors, memory, etc.
To speed up its search process, Elasticsearch creates an index. As this index is getting larger, the software can cut it into several pieces. These shards are then spread over several nodes in a cluster. Each shard can also have replicas, and the nodes which host one or more shards act as coordinators to delegate all operations to the correct shard(s). Usually, related data gets stored in the same index, consisting of one or more primary shards and optional replicas. When it comes to monitoring, it's often about keeping an eye on the number of shards and their state, as it is not possible to change the number of primary shards once an index has been created.
Here is a list of things to monitor about Elasticsearch shards:
- Active shards
- Active primary shards
- Active shards (in percent)
- Delayed, unassigned shards
- Unassigned shards
- Ongoing shard info requests
- Relocated shards
On top of that, there are a few things you might want to know about your indices:
- Document count (and growth per minute)
- Size (growth per minute)
- Total number of documents
- Total size
How to monitor Elasticsearch with Checkmk
Setting up Elasticsearch monitoring in Checkmk is not really complicated. Basically, you configure the datasource (i.e. a special agent), and you're good to go.
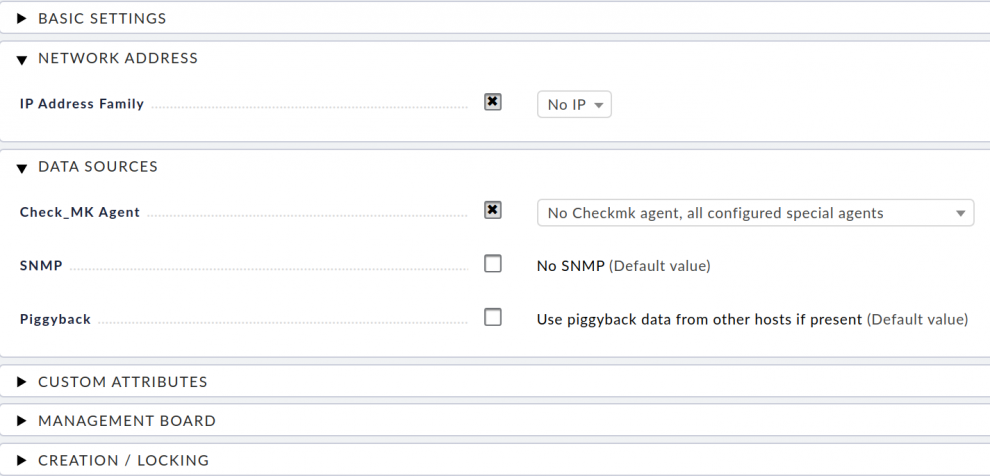
First create a host onto which Checkmk will allocate all the Elasticsearch status information and metrics. Go to WATO ➳ Hosts and create a new host by clicking on Create new host. In the Network Address area tick the check box IP Address Family and choose No IP from the drop-down menu. After opening the Data Sources section, activate the check box Check_MK Agent. Choose No Checkmk agent, all configured special agents from the drop-down menu or Normal Checkmk agent, all configured special agents if the Checkmk Agent is installed.
Next, create a new rule. In our example you need the rule Check state of Elasticsearch. You can find it in the WATO ➳ Host & Service Parameters by entering Check state of Elasticsearch in the search bar. It should be listed under Datasource Programs.
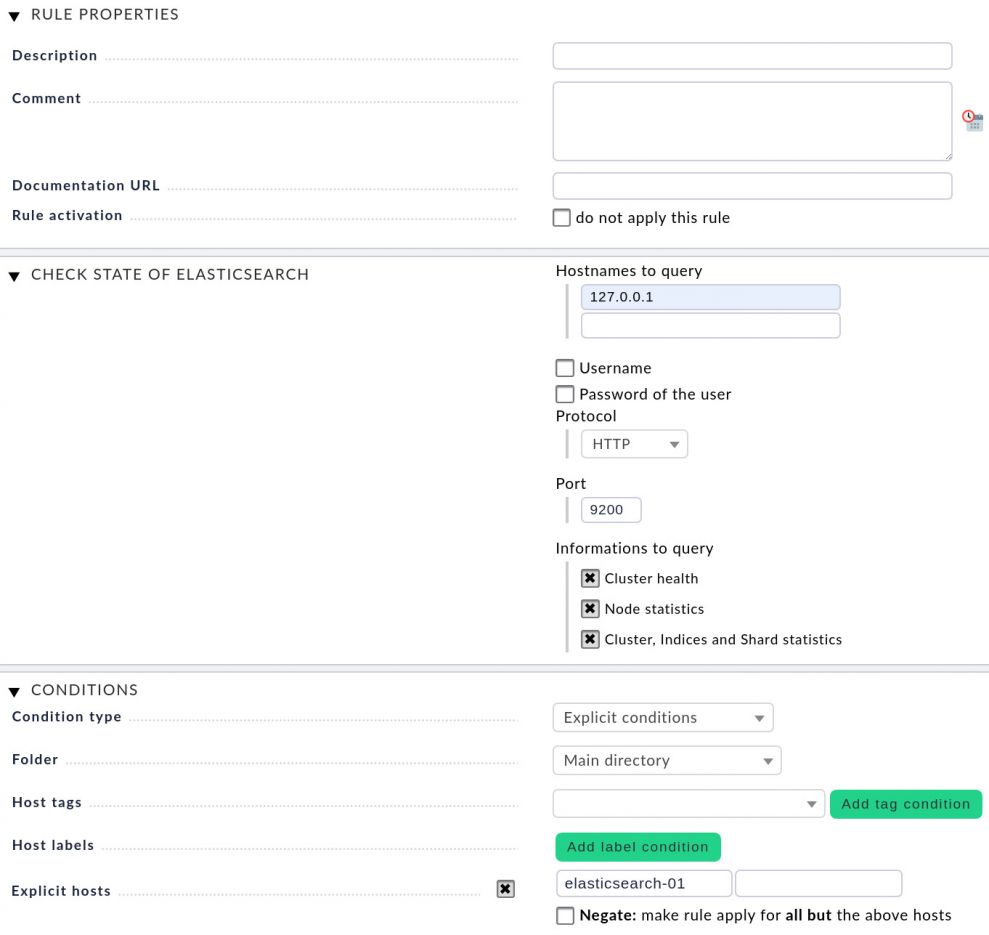
All information in the Rule Properties section is optional. This is where you can add a description and comments. Next, open the Check State of Elasticsearch section and provide the hostname or the IP address of the Elasticsearch instance (text box Hostnames to query). It's possible to define multiple instances. If the connection to the first instance fails, Checkmk will query the next instance. Checkmk will however only monitor the first instance that can be reached. Username and the Password of the user are only required if you use the enterprise edition of Elasticsearch; the standard Elasticsearch installation comes without credentials.
Note: Rarely your Elasticsearch will run on the same server as the monitoring server as shown in the screenshot.
Specify the Protocol and the Port. If you run the standard Elasticsearch configuration, the search engine uses HTTP and is listening on port 9200. In the section Informations to query you can activate three check boxes: Cluster health, Node statistics, and Cluster, Indices, and Shard statistics.
Finally under Explicit hosts, set the host, which you created in the first step.
Save your settings before creating a new host object.
Keep in mind that Checkmk offers an even more comprehensive monitoring, if you install the Checkmk agent on the Elasticsearch nodes and monitor them as well that way.
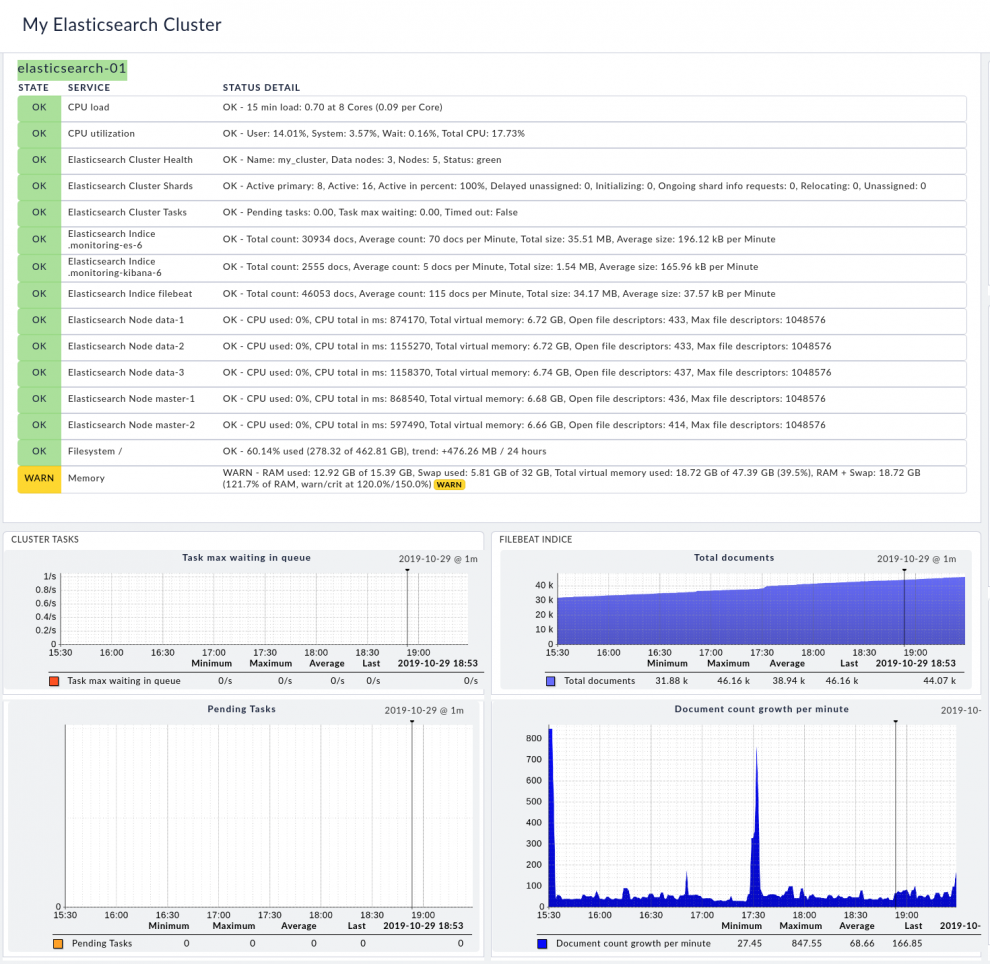
Tip: Checkmk has a cool feature that allows you to create your own dashboards and combine all views, graphs, and other elements on one single page. Monitoring Elasticsearch clusters with a customized dashboard is really comfortable.
Since Elasticsearch is written in Java, it also makes sense to monitor the heap of the Java Virtual Machine and the Garbage Collection. You can do this as well with Checkmk with our JVM checks plug-ins.
We hope this summary on monitoring Elasticsearch with Checkmk helps you! Let us know, what you think about it and what you are looking for!
