Forecasting metrics - A look into the future
 on Jul 2, 2020
Note: The content on this page uses the former names of Checkmk editions. Checkmk Enterprise is now Checkmk Pro, Checkmk Raw is now Checkmk Community.
Do I have enough filesystem space left for the coming months? How will the CPU load on my server develop in the future? As soon as you have a proper monitoring in place and get alarmed when things go wrong, the next question will be – can you prevent potential future issues?
Checkmk comes with a forecasting ability since version 1.6, so that you can plan ahead and predict future behavior based on historic data. This can also help you to perform capacity management on your IT systems.
Will you be able to detect every issue in advance? No, because often things happen which nothing and no one can anticipate – that's why you need monitoring. Now, on top of this you will be able to discover interesting trends which might turn into issues, and can get a much better understanding of your IT infrastructure.
In this blog post I will share with you how to get started with metric forecasting within Checkmk, and how to tune the configuration options.
Installing the forecasting package
Facebook's time series forecasting model Prophet serves as the underlying technology. In Checkmk 1.6, we use Facebook's implementation (Prophet) and thus that dependency needs to be installed separately. From Checkmk 2.0, we implemented the algorithms natively into Checkmk, and forecasting comes
ready to use.
This guide was written using Checkmk Free Enterprise 1.6.0p13 on a fresh Ubuntu 18.04 instance. As this feature leverages the more advanced graphing capabilities of the commercial Checkmk versions, it is not available in Checkmk Raw. For now, I would recommend trying this rather new feature in a test instance and not in a productive environment, and also not on an appliance. A detailed article in our user guide will follow.
As Prophet needs to be compiled, you first have to install gcc and g++ (sudo apt install gcc g++). Next you have to become a Checkmk site user (sudo omd su <sitename>), get the install script, make it executable, and then run it.
wget https://raw.githubusercontent.com/tribe29/checkmk/1.6.0/bin/install_fbprophet

chmod +x install_fbprophet

./install_fbprophet
This will take some time and you can ignore most errors (e.g., fbprophet 0.5 requires matplotlib). As mentioned before, from Checkmk 2.0, this will no longer be necessary.
Creating your first forecast
Let's get started with the actual fun! Forecasting works on any single metric, so first we have to select one. In my example, I will forecast the Used filesystem space of the new Checkmk Forum that has been running on Discourse since December 2019.
Go to any service view and click on the service for which you want to forecast a metric.

Scroll down to Service Metrics and click the icon ![]()
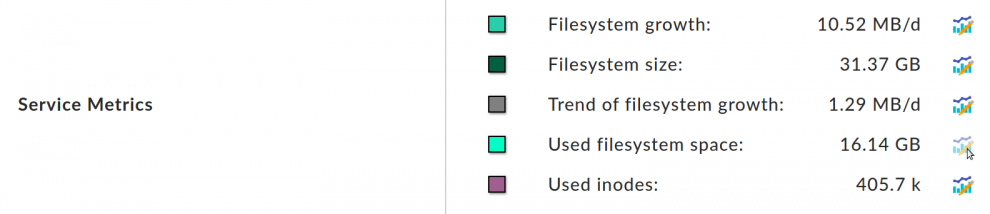
We now get a default forecast, which considers the data from the last month, and forecasts until the end of the month. The blue line is the actual used filesystem space. The red line is the forecast, and the yellow area is the band in which the forecast predicts the metric. The green vertical line marks the start of the forecast.
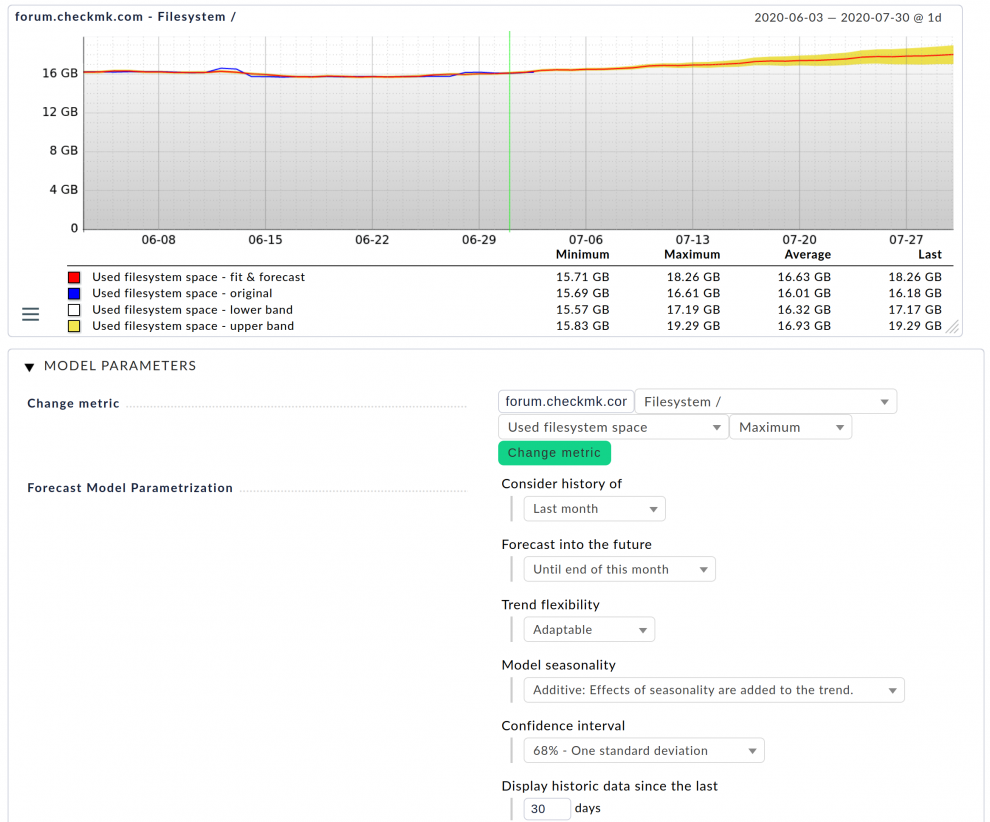
This basic forecast is already much more sophisticated than a simple linear interpolation. You can also see there are a lot of options for tuning the forecast model. Let's jump into that to get a really powerful prediction.
Tuning your filesystem forecast
In the default forecast we are only looking at a limited time range. But Checkmk however gathers and stores data long-term, so let's make the best out of that to get a better understanding by considering data from the entire year so far, and forecasting until the end of the year.
The settings are mostly self-explanatory. Set Consider history of to This year and Forecast into the future to Until end of year. Also set Display historic data since the last to 180 days, so that you can also see the historic data.
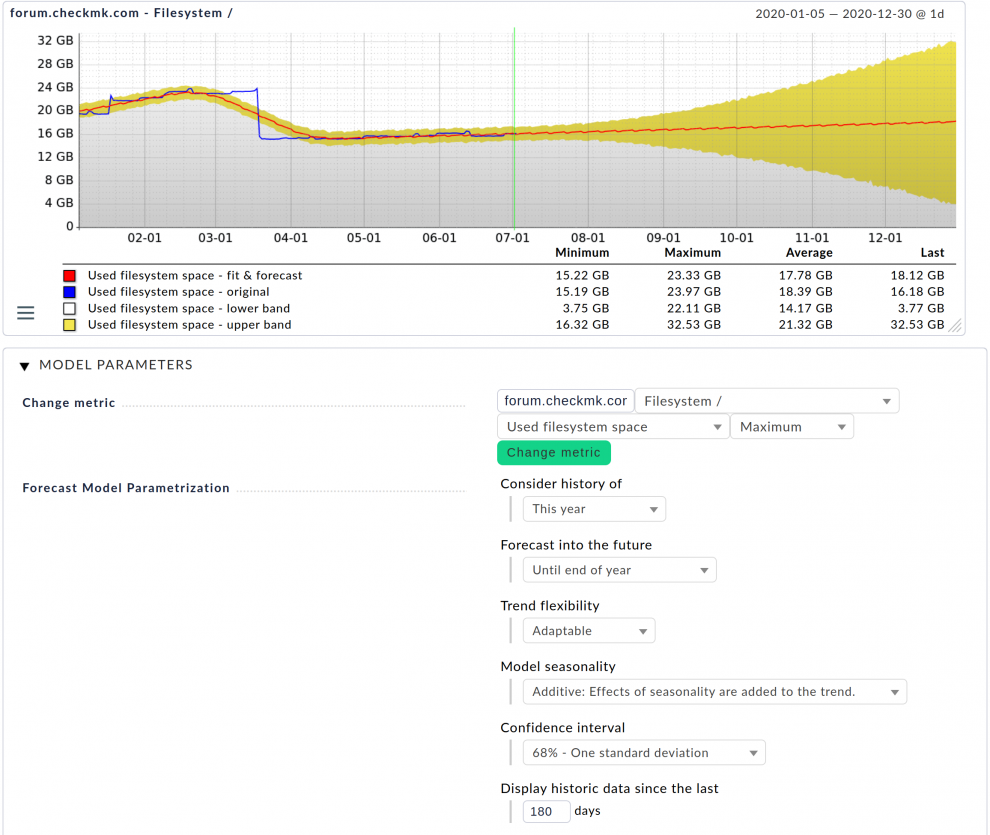
In the first few months of 2020, the used filesystem space was growing quite a bit, and it looks like the filesystem was cleaned up at some point. Since then, it looks like the growth has been pretty stable. And what is really great, the forecast algorithm was able to interpret this correctly and has created a decent forecast. The upper and lower band have quite a large spread, but that is due to the erratic behavior in the first 3 months of the year.
To make it clear that simple algorithms are not usable for predicting trends, let's create a simple linear interpolation. For this, just change the Trend flexibility to Linear.
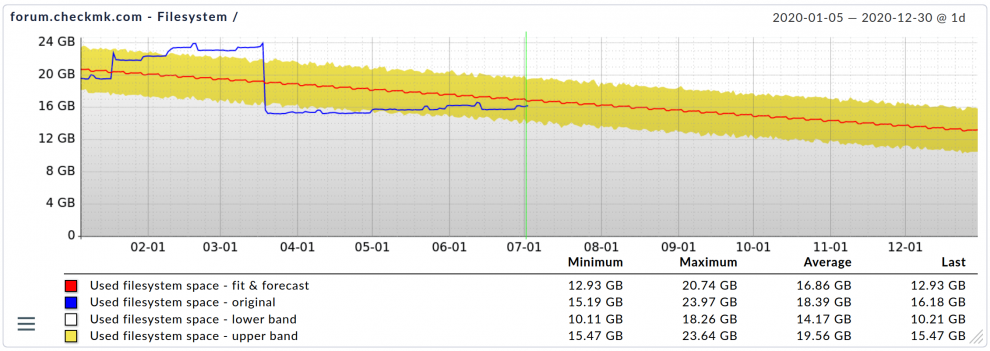
The linear forecast now predicts that the used filesystem space will shrink until the end of the year, which is obviously not realistic. The linear interpolation can not accommodate for the effect of the one-off deletion of files in March. Thus, in general, I do not recommend linear forecasts, but rather the default setting of Adaptable, which uses much more advanced algorithms.
The different options under Trend flexibility allow you to adjust how strongly the algorithm adapts to changes within the original data. I recommend that you experiment around with it to get a feeling for these options.
Forecasting CPU load
We have seen that we can create pretty nice forecasts for filesystems. But looking at the forecast for our forum, by the end of year we can expect a growth from 16 GByte, up to 18 GByte, and the daily change is also not as dynamic as – let's say – for CPU loads. With our team growing in size on a monthly basis and all of us using Jira, I took a look at the CPU load of our Jira server.
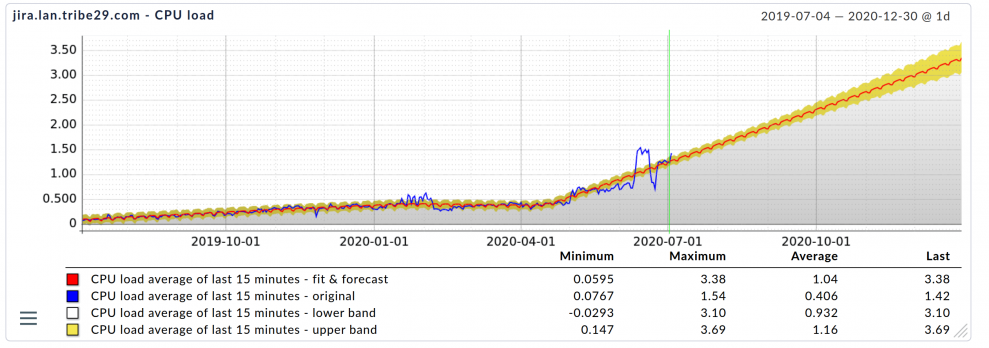
We can see the CPU load has been increasing steadily. Especially over the last months we see a much greater increase. The algorithms can handle this quite well as well. While we have added more and more people to Jira, we have also started to make much more use of the analytics features in Jira and Jira Service Desk in the last months, and this might be one of the reasons why the CPU load is increasing faster now. We have 8 cores on that server, so we should be fine for now – but we better keep an eye on that.
You can find all the forecasts you have created by going to the Views sidebar snap-in, Edit and then click Forecast Graphs in the top menu bar. Checkmk now gives you the tools to become a data scientist with your monitoring data, and to create proper forecasts for your filesystems, CPU loads, and so on. You can export the forecasts into reports and share them with your manager to have a better basis for discussion of the next IT budget. You can also use the forecasts to detect potential issues in advance.
There is still a lot of work needed from us to improve this rather new feature. The first step has been completed, and it was to simplify the installation without doubling the size of the Checkmk package. The next steps will be to work on the usability and to eliminate bugs. Further in the future are topics such as alarming based on predictions.
Let us know about your experiences with this and how we could improve the forecasting feature by writing to feedback@checkmk.com
Happy monitoring!
