Monitoring web servers with Checkmk
 on Mar 3, 2022
Note: The content on this page uses the former names of Checkmk editions. Checkmk Enterprise is now Checkmk Pro, Checkmk Raw is now Checkmk Community.
Most websites today use large volumes of code and multiple applications, because they want to provide the user with dynamic content and provide personalized information. Even though the volume of traffic and the number of visitors can vary a lot during the day, web developers assume that the IT infrastructure hosting their applications will work at peak performance at any time. It is thus important to monitor your web server properly, otherwise you can experience slow loading times and other performance issues.
This blog will show how to keep an eye on the most important elements of your web server with Checkmk. As well as the server hardware, you also will learn how to monitor your web server application, a database, cronjobs, logs and SSL/TLS certificates. I will also show you how to use notifications, so that you can solve any problems more efficiently, since Checkmk brings all the information together and tells you exactly when and where it is time to act.
As an example, I will use Nginx (version 1.21.4) as web server, and MySQL (version 8.0.28) as the database running on the same server, but with Checkmk the steps are very similar as for other applications and databases. If your web server runs on Apache or you use Postgres as a database, for example, you instead simply use the matching Checkmk plug-ins, and follow all the other steps.
I will use Checkmk Enterprise version 2.0.0.p20. You can download the latest version from the Checkmk download page. Your Checkmk site has to be able to access the web server, and you will need admin rights to install the monitoring agent on your web server. Your Checkmk server will also need a working internet connection. I strongly recommend hosting your web server and Checkmk on different servers. In my case, I host my Checkmk site on a separate Linux server within the same network.
TL;DR:
The tutorial shows how to comprehensively monitor a web server with Checkmk and receive notifications only when action is actually needed.
- Monitors all key components: hardware, web server (e.g., Nginx/Apache), database (e.g., MySQL/Postgres), cron jobs, logs, and SSL/TLS certificates.
- Checkmk consolidates all information in one place and provides clear indications of where issues occur.
- The tutorial works for various systems — you just need to select the appropriate Checkmk plugins.
Step 1: Read-only access for monitoring your database
You will probably want to monitor a database that runs on your web server. For most databases, Checkmk needs a user account with read-only access. Should you not have such a user, switch to the console and change that before you start performing actions in Checkmk.
In my case, I need to log into MySQL as a user with sufficient access rights, and then create a new database user:
mysql> CREATEUSER 'monitoring'@'localhost' IDENTIFIED BY 'MyPassword';
The user needs read rights for the sites. Add these with the following command:
mysql> GRANT SELECT, SHOW DATABASES ON *.* TO 'monitoring'@'localhost';
If you use MySQL replication, the user must at least have the REPLICATION CLIENT right to monitor the replica server:
mysql> GRANT REPLICATION CLIENT ON *.* TO 'monitoring'@'localhost';
Step 2: Monitoring the website and SSL certificate
Checkmk includes mechanisms for managing a large number of hosts. I am going to use one of those in this tutorial – the management over folder structures.
- Switch to Checkmk instance and open a folder for the hosts in your web server environment.
- Go Setup -> Hosts.
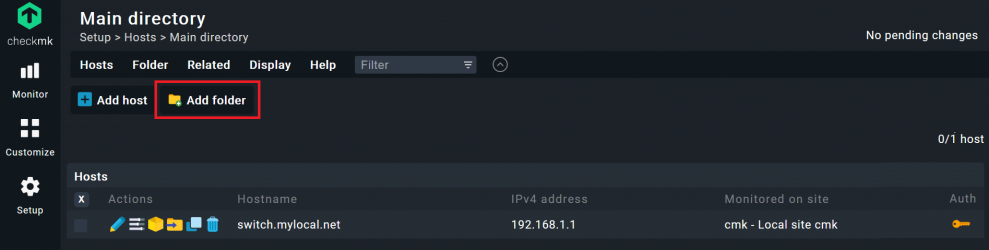
- Click on Add folder.
- Add a name under Title, I used ‘web server monitoring’, leave the other fields unchanged.
- Click on Save. You should now be back on the Main directory and see your new folder.
- As a first host, you should add your actual website to make sure that it is accessible from the online world. Open the folder you just created by clicking on it.
- Click on Add host. Add your website’s domain as Hostname. In my example ‘www.checkmk.com’.
- By default, Checkmk assumes that you use a monitoring agent, thus you should customize that. Under Monitoring agents change the field Checkmk agent / API integrations to ‘no API integrations, no Checkmk agent’.
- Click on Save & go to service configuration.
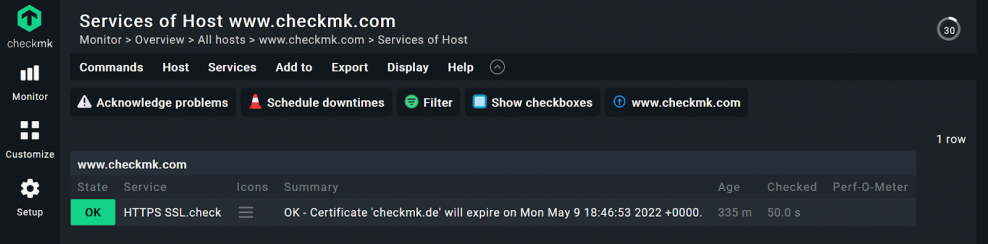
Checkmk will create a host with just one service to ping your website. In the next step, you will add the active service ‘Check HTTP’ to the host you just created. This allows you to track the age of your SSL certificate.
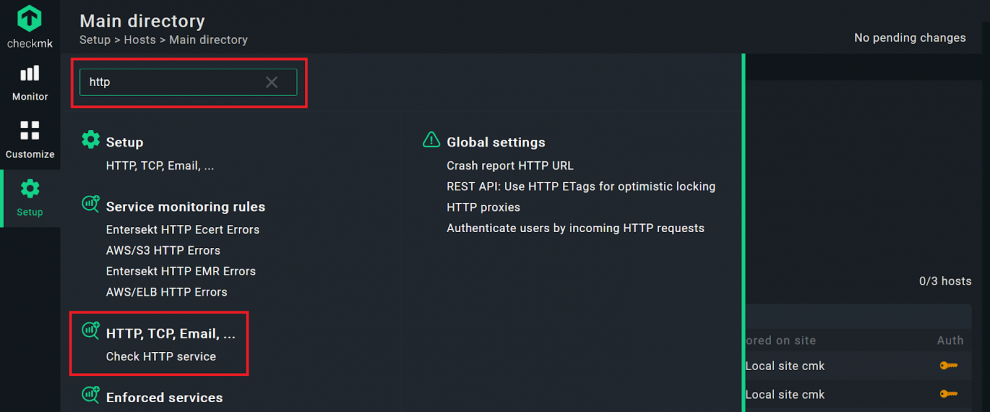
- Click on Setup and type ‘http’ in the search bar.
- Click on the Check HTTP service.
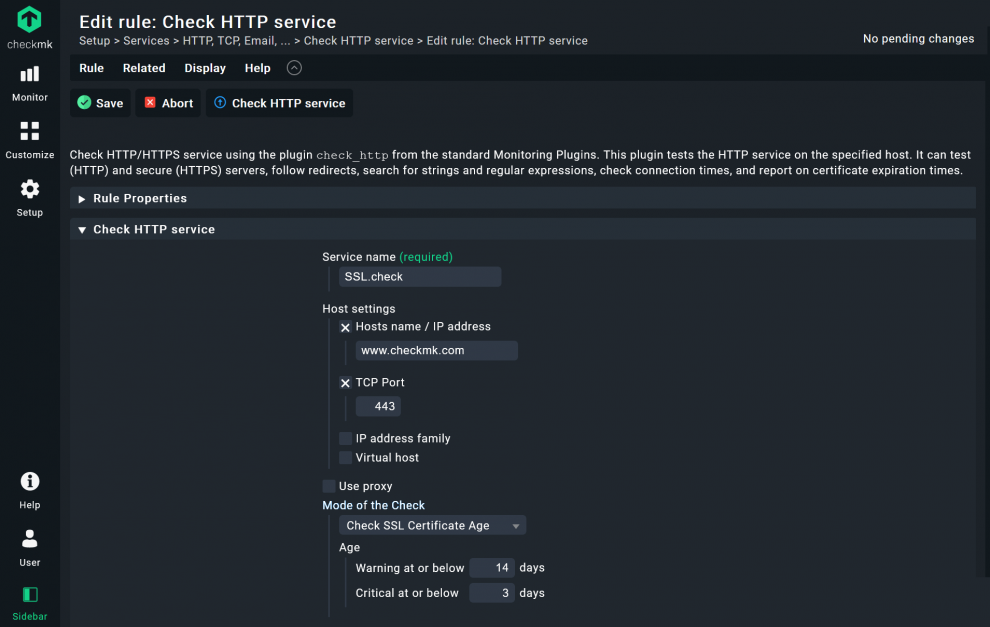
- Add a Service name, I used ‘SSL.check’.
- Under Host settings -> Host name / IP address add your website. In my case ‘www.checkmk.com’.
- Checkmk uses port 80 as the default value (HTTP). If you use SSL/TLS, you will need to tick the TCP Port box. The default port is 443 (HTTPS), you can customize the port and other details depending on your IT environment, of course.
- Adjust Mode of the Check to Check SSL Certificate age and add the thresholds when Checkmk should change the service status from OK to Warning and Critical. I used 14 and 3 days.
- Below, under Conditions, check the Explicit hosts box and add your website’s host name, in my case ‘www.checkmk.de’. Thus, this rule will apply only for this host.
- Click on Save.
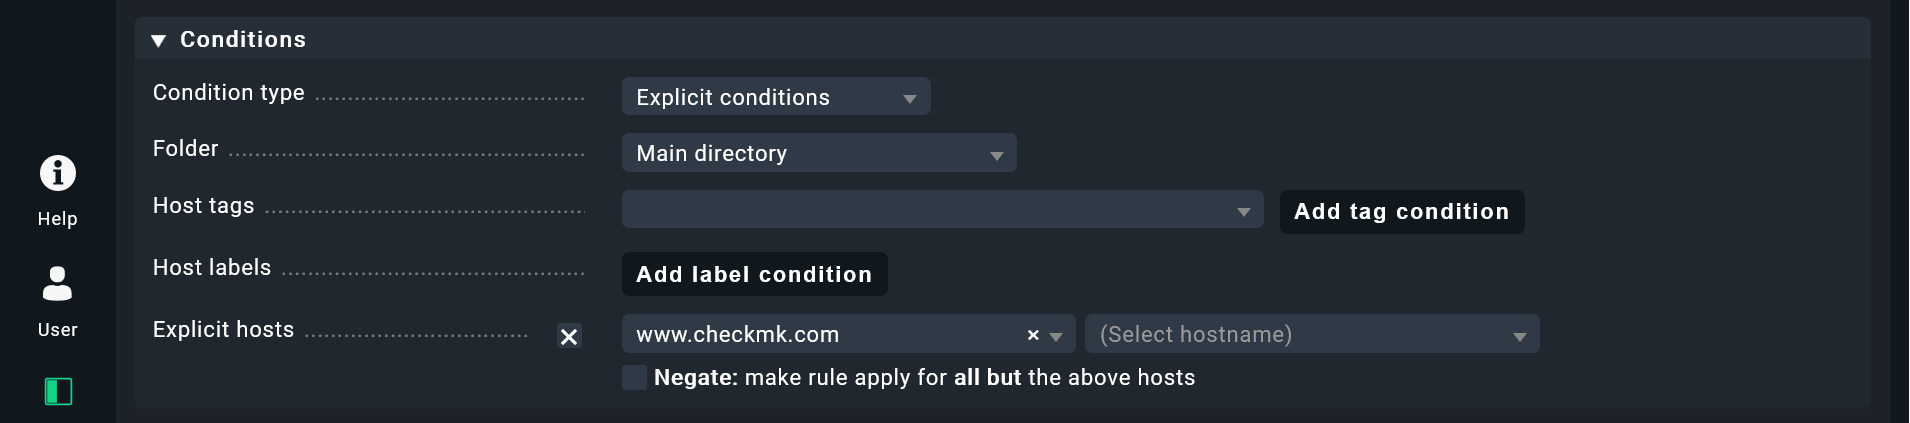
Before you go ahead, just a short piece of information about the Conditions in Checkmk. Alongside a single host, you also have the option of using folders, labels and tags to apply rules. If you have some time after this tutorial, I recommend watching the Checkmk video tutorial episode 7. The three parts will explain more about the rule-based monitoring, host tags and folder structures in Checkmk.
If you have already worked with Checkmk, you can probably guess the next step – you will need to activate the changes before they go into production.
- Click on the highlighted field with the yellow exclamation point (!) in the top right corner to see the pending changes.
- Click on Activate on selected sites.
By this point, you will have created a folder with one host in Checkmk to check whether your website is online and whether your certificate is still valid. You will also have your read-only user account for your database ready. With this preparation completed, it will be easy to prepare a Checkmk agent with exactly the configuration you need.
In my example, the certificate is in order. From 14 days before its expiration date, the service will turn to WARN and become yellow. If the certificate will run out in 3 days or less, Checkmk would highlight that in red and switch its state to CRIT.
Step 3: Baking a monitoring agent in Checkmk
In the next step, you expand the Checkmk agent with the monitoring plug-ins you need for your individual web server environment. This tutorial will use Checkmk’s Agent Bakery to configure an agent. The Agent Bakery is not included in Checkmk Raw. If you want to monitor your web servers with Checkmk Raw instead of Checkmk Enterprise, you would have to configure the agent manually. Because you will tie the configuration of your agent to the folder created earlier, you will be able to use automated updates later on. This feature of the Agent Bakery is really powerful, but goes beyond the scope of this tutorial. Once you have created your agent, you will need to install it on your web server.
Checkmk is a flexible web server monitoring tool, because it has monitoring integrations for many different types of applications. In my example I am going to use the agent plug-ins to monitor Nginx, log files and MySQL.
Step 3.1. Add the Nginx plug-in to monitor the web server application
To monitor Nginx with Checkmk, your Nginx status module must be activated. On most Linux distributions, the Nginx version comes with the ngx_http_stub_status_module enabled, but you can check with the command:
nginx -V 2>&1 | grep -o with-http_stub_status_module
This should return ‘--with-http_stub_status_modul’, if the status module is active. If it does not, you can follow this tutorial to activate it. When you are sure that your Nginx status module is activated, turn back to Checkmk:
- Go to Setup -> Agents and click on Windows, Linux, Solaris, AIX. If no one has created agents, you should only see a ‘Default configuration’ agent.
- Click on Agent rules in the top menu, the last button on the right.
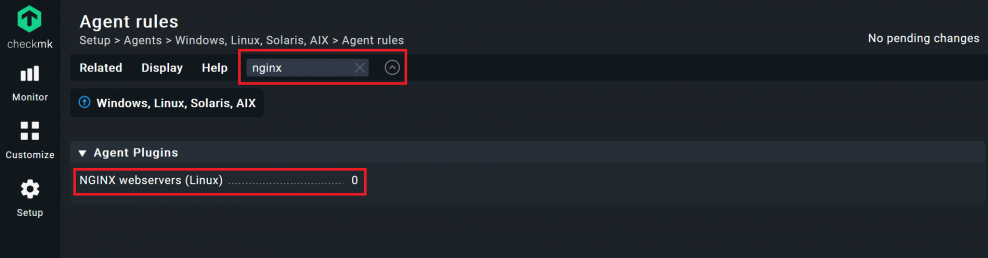
- Next you will see all the available agent rules. I recommend using the search function and starting with the Nginx plug-in. Search for ‘nginx’, hit enter and click on the NGINX webservers (Linux) plug-in.
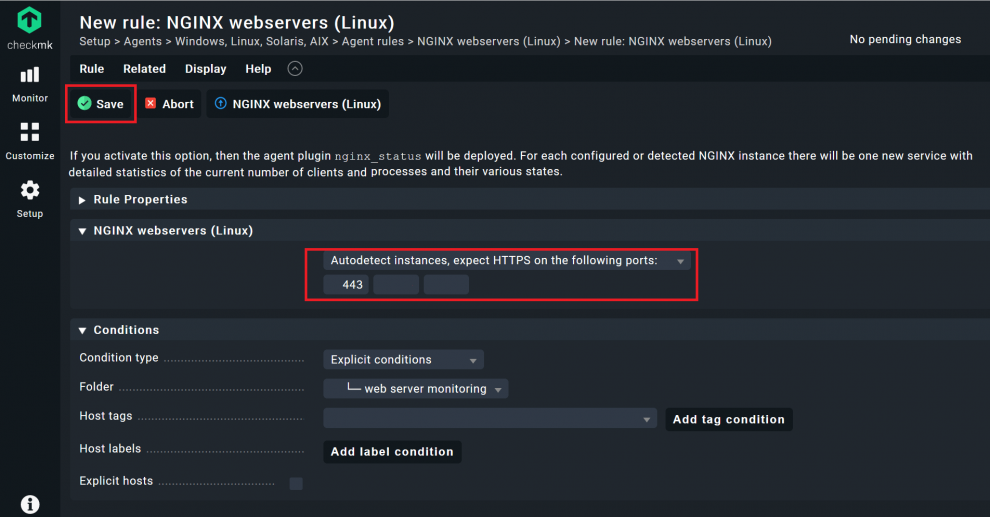
- Change the field after the Create rule in folder button to the folder you created earlier, in my case ‘web server monitoring’, then click on the button.
- You can leave almost all fields empty in the next field, but you can add a description and other details if you want to. However, check the ports. These decide on what port the Checkmk agent will listen to. 443 is the standard for HTTPS and thus the default. You can adjust that, if needed. Then click on Save.
You have just created a first rule for this folder, but you still have to add a few more.
Step 3.2. Add the Logwatch plug-in to monitor the logs
To monitor any kind of logs on a Linux host, you need to add the Checkmk Logwatch plug-in. The procedure is exactly the same as before, but you need to add the events that you want to monitor.
- Go to Setup, and search for ‘logfiles’. You should find an agent plug-in called Text logfiles (Linux, Solaris, Windows).
- Click on it and change to the folder created at the beginning of this tutorial. Click on Create rule in folder, add your folder.
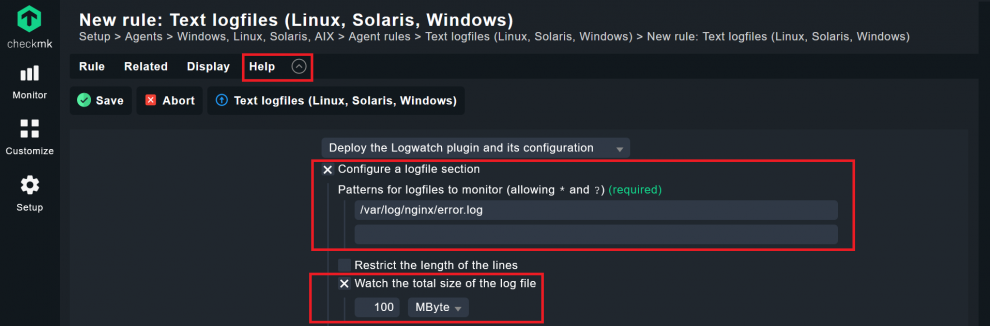
Under Text logfiles (Linux, Solaris, Windows) you have to tell Checkmk which logs you want to have monitored. Once you have added the file path for the log files, you must tell Checkmk which event should trigger a switch of the log service to WARN or CRIT.
- Tick the box before Configure a logfile section and add the file path(s) under which the log files are saved. For a web server, you should add your web server application’s error logs. For my Nginx server log files for example, these logs will be written into the ‘/var/log/nginx/error.log’ file.
You can monitor multiple log files and can add these here as well. Depending on the structure of your log files it would be more sensible to use multiple agent rules for different types of logs instead of having all of them in the same rule.
- I recommend using the Watch the total size of the log file option with the default value of 100 Megabyte. This makes sure you can react quickly should your web server start writing useless pieces of log data.
- You can use other options to monitor the actual log files, but that really depends on your individual server. If you are not sure, click on Help -> Show inline help in the menu to see more details on the options in the current view in Checkmk.
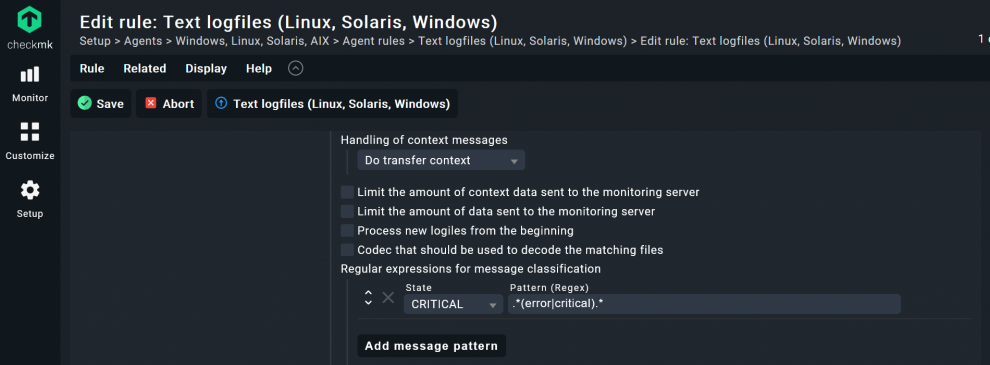
- Now the most important part, the actual event monitoring: Click on the Add message pattern button and tell Checkmk which events should cause the service to become critical or change to another status.
- You need to know how a certain event looks like in your log file and then add that event under Pattern. In my case, I want to Checkmk to let me know whenever there is a critical error. Thus, I add ‘.*(error|critical).*’ under Regular expressions for message classification.
- Leave Conditions, and tie the rule to the folder you have created.
- Click Save like before.
If you wanted to monitor ‘syslog’ or your databases’ logs, for example, the Pattern would probably have to look different. Additionally, if I had omitted the ‘critical' for my Nginx logs, every critical log would trigger my service to become critical, something that does not really add value to your monitoring. Instead, try to match it more precisely to the strings you really want to monitor. If you want you can go to www.regex101.com to verify your regex syntax.
Step 3.3. Configure mk-job to monitor cronjobs
You can monitor any kind of cronjob with Checkmk with mk-job, a part of the Checkmk agent package. Because I want to monitor a backup cronjob, I add the configuration in Checkmk as an example.
- The process is similar to adding a plug-in, search for ‘mk-job job age’ under Setup.
- Create the rule in your folder and click on Save.
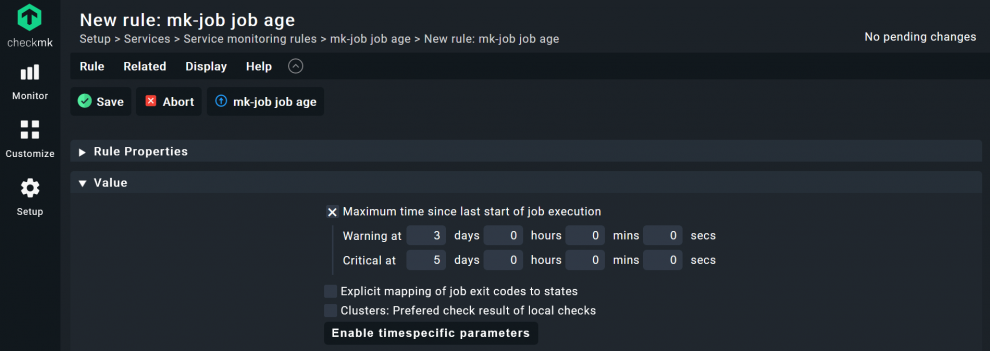
- Under Value, tick the box at Maximum time since last start of job execution and add the thresholds of your choice. For my database backup, I use 3 for Warning and 5 for Critical.
- Click on Save.
There are other options, of course. Depending on your server, you can adapt the monitoring of your cronjobs as you wish. You can also skip this step, if you do not want to define thresholds WARN and CRIT. You still would be able to add the execution of cronjobs to your monitoring later on (step 4 of this tutorial), but would not have defined the thresholds for Checkmk.
Step 3.4. Adding the MySQL plug-in to your agent
To monitor MySQL, you also need to add the plug-in and the user credentials.
- Go again to Agent rules, simply click on the button and search for ‘mysql’. You should find an agent plug-in called MySQL Databases.
- Click on this and switch to the folder created at the beginning. Click on Create rule in folder as done earlier.
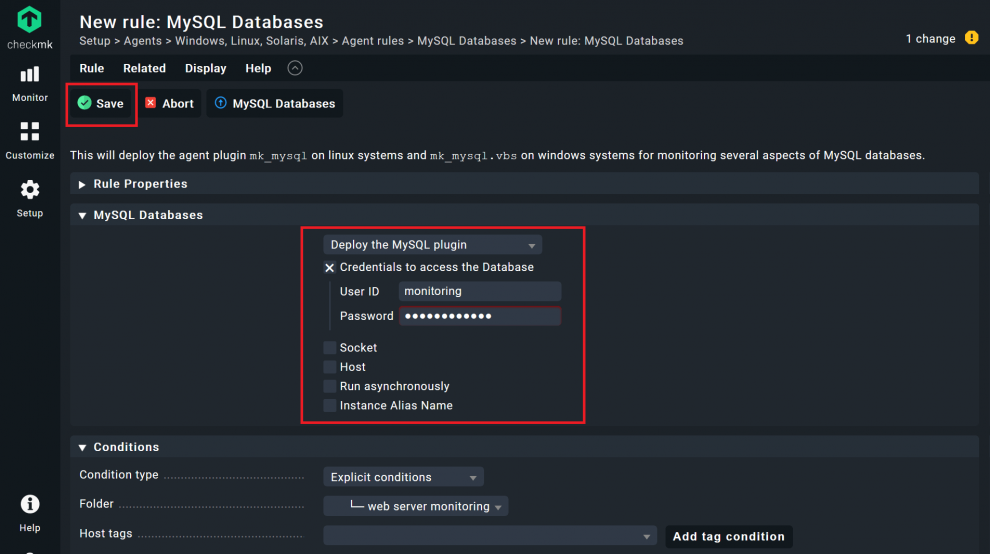
- An important difference: Under MySQL Databases you need to tick the box before Credentials to access the Database, so Checkmk can use the read-only user to access the monitoring data.
- Add the credentials for the user you created in the first step of this tutorial, in my case the user is called 'monitoring' and the password is 'MyPassword'.
- Under ‘Socket’ and ‘Host’ you can alter some parameters if necessary. In my example the default values ‘/var/run/mysqld/mysqld.sock’ and ‘127.0.0.1’ are fine, so I do not have to alter anything.
- Click on Save.
The option ‘Run asynchronously’ is useful if you want to take longer runtimes into account with large MySQL instances, or when the status data is simply not required every minute. In my case, the database is fairly small, so I am not using that option.
Agent plug-ins expand the capabilities of the Checkmk agent and also automatically add the necessary configuration data. You can continue adding any agent plug-ins you may need. If there is no official plug-in for an application you want to monitor, you can browse the Checkmk Exchange, where community members share their self-written plug-ins, or you can write your own Checkmk plug-in. However, most usage scenarios should be covered by the official Checkmk plug-ins.
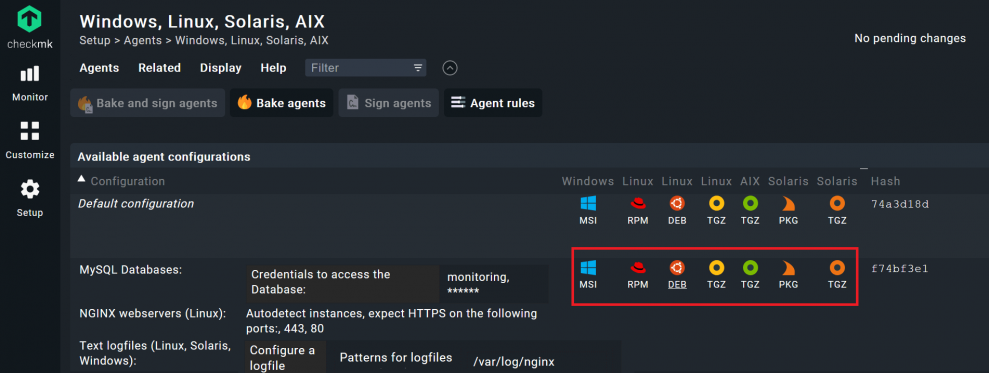
- If you have finished adding the agent rules for your folder, go to Setup -> Agents -> Windows, Linux, Solaris, AIX.
- Click on Bake agents.
- Accept the pending changes again, and you should then find a new agent under Setup -> Agents -> Windows, Linux, Solaris, AIX.
- Download the agent by clicking on the package that suits your web server's operating system and install the agent on the server you want to monitor.
Step 4: Cronjob monitoring with mk-job
mk-job is simply a script, and it is thus fairly easy to add cronjobs of your choice to the monitoring. You have already installed the mk-job with the Checkmk agent, and now need to edit the cronjob on your web server that you want to monitor. You simply have to add mk-job and a service name as a prefix, with an editor of your choice.
For example, the backup cronjob for my database, which runs at five minutes after midnight every day, under etc/cron.d/backup looks like this:
crontab
# Syntax: <minute> <hour> <day> <month> <day of month> <user> mk-job <service name> <command>
5 0 * * * root /usr/local/bin/backup >/dev/null
I have to change my crontab to look like this:
5 0 * * * root mk-job DB-Backup /usr/local/bin/backup >/dev/null
When executing the newly defined cronjob, mk-job will try to store the results from the measurement in the /var/lib/check_mk_agent/job/root directory. Since the directory job also belongs to the user root, it is no problem for mk-job to create the user directory root if this does not already exist.
The cronjob needs to run once to write data. With each call, the agent will look in the directories under /var/lib/check_mk_agent/job/. If there is data, the agent can add that to the agent output. The status of your cronjob will be included in the monitoring as a service. It is therefore important that you use a unique service name.
Step 5: Add your web server to Checkmk
- Go back to Checkmk and click on Setup -> Hosts and open the folder you created.
- Click on Add host.
- Add the Hostname and click on Save & go to service configuration.
- Do a Full service scan and wait for the service discovery. Checkmk should find several services. As well as the standard services such as CPU utilization and so on, you should also see the data for your Nginx, logs, and your MySQL database.
- Click on Fix all to add them to the monitoring and accept the changes
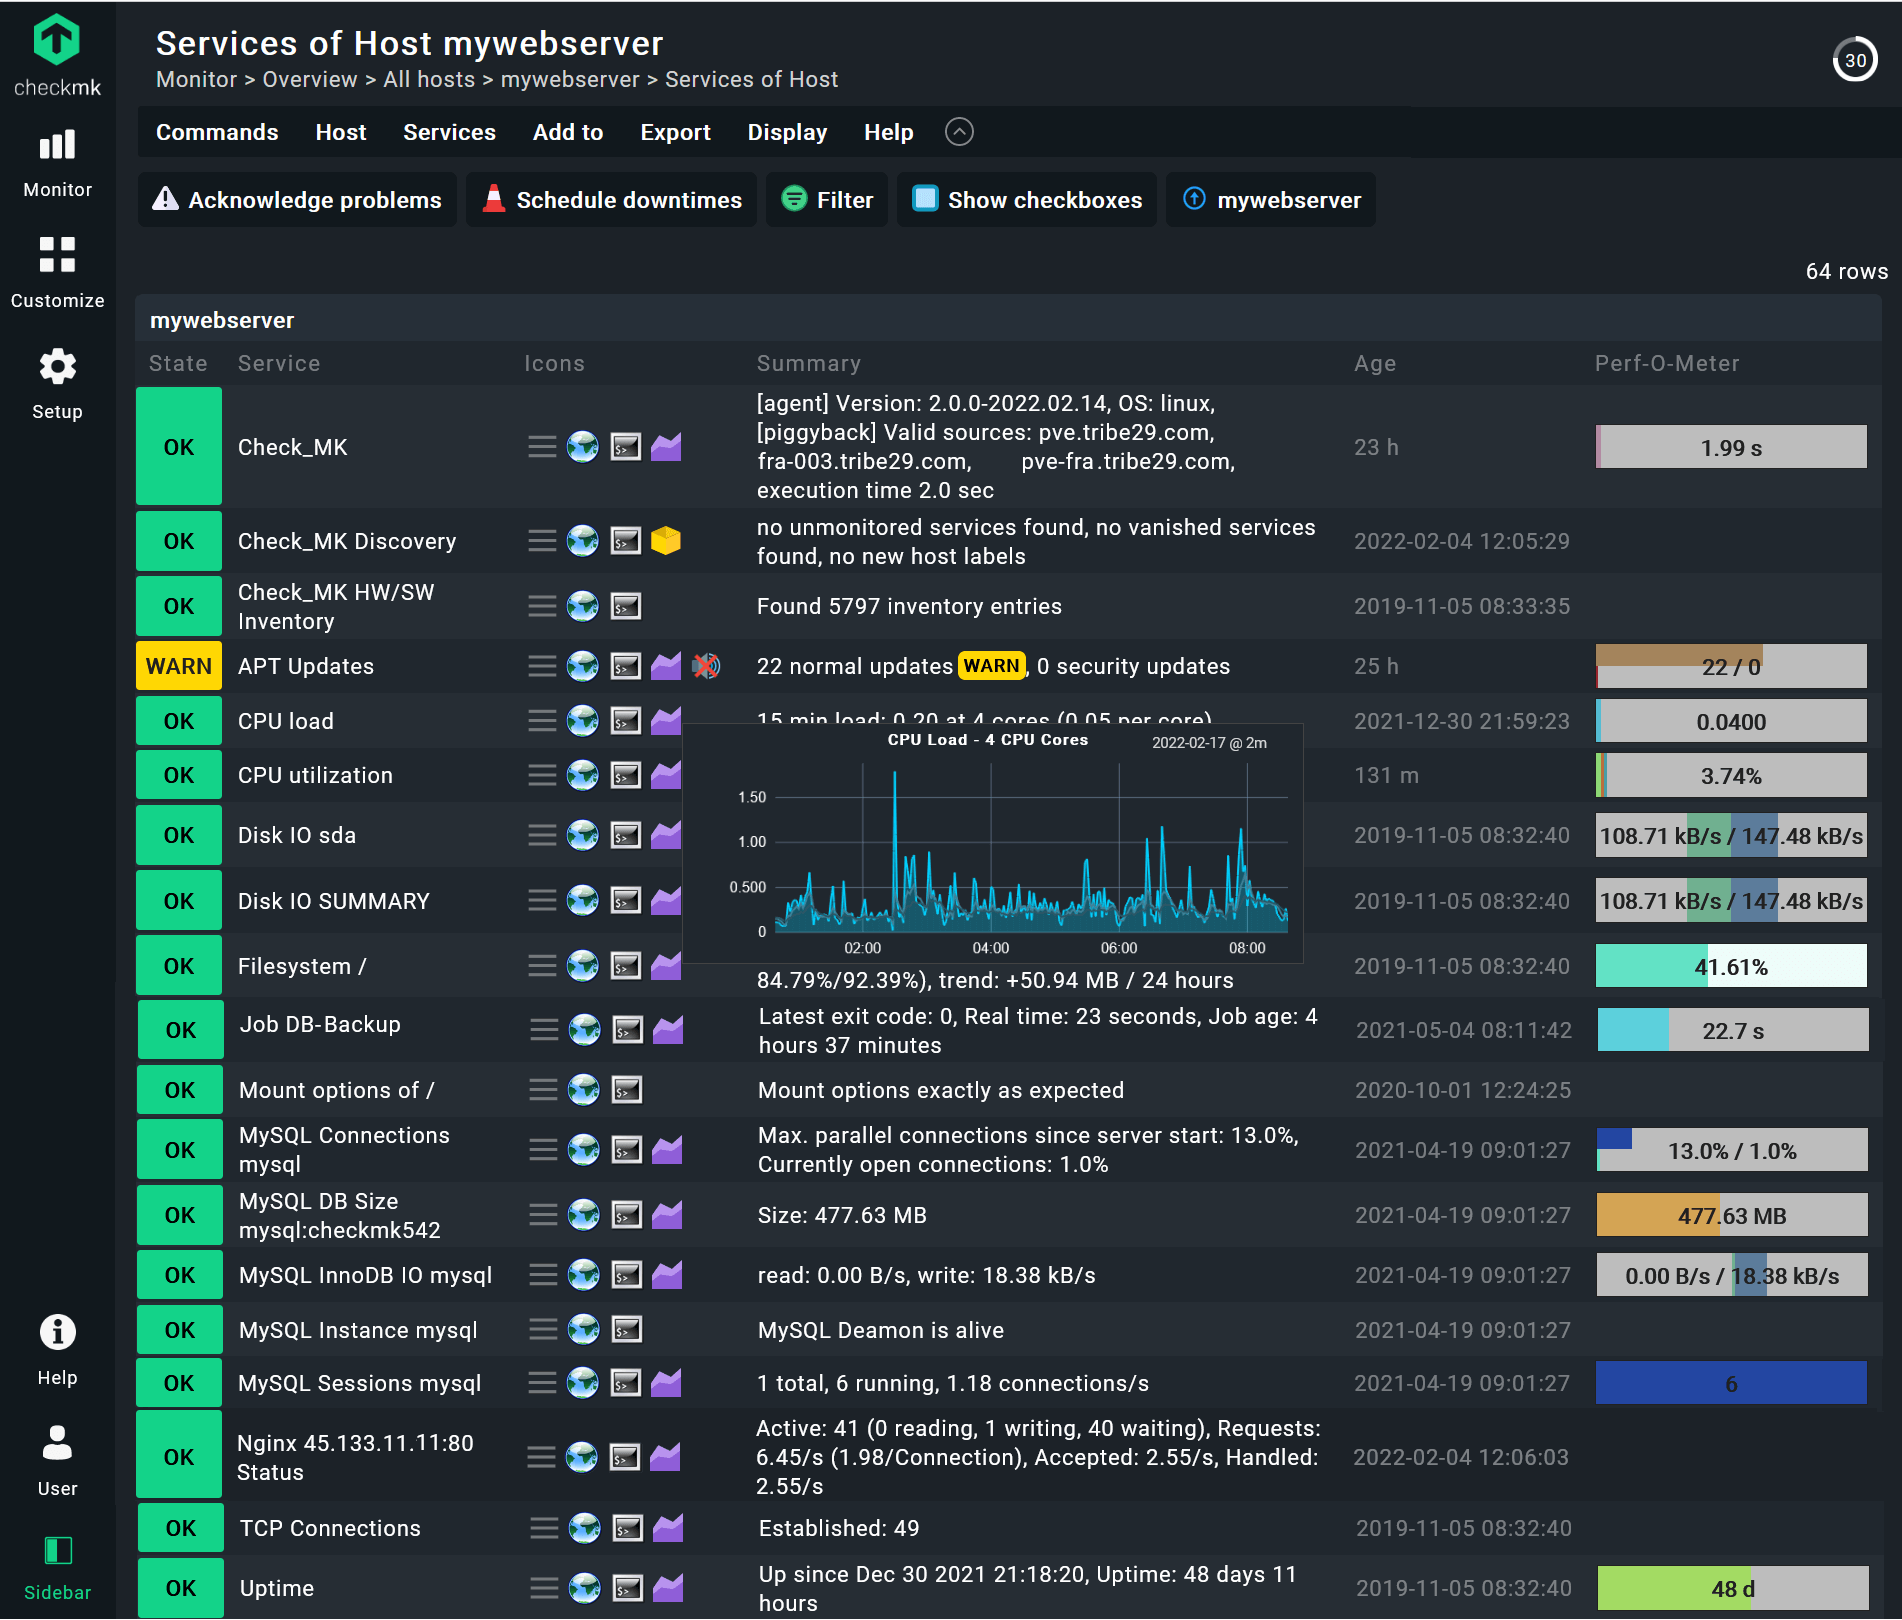
Under Monitor -> All hosts you should see now your web server and all of his services after clicking on it.
Step 6: Notifications
Checkmk has several mechanisms for triggering notifications, you just need to tell Checkmk when to send a notification and to whom it should be sent. Notifications are a huge topic in monitoring, but for this tutorial, I just want to show you a simple example, so you understand how notifications work.
You might know the feeling when you forget to renew your SSL/TLS certificate in time. To avoid that, I let Checkmk write me a short email, so I can take care of that. Checkmk does not contain a mail server. Before you can use email notification, you need to install a mail server on your Checkmk host server. I installed postfix, you can follow this postfix tutorial.
- Go to Setup -> Events -> Notifications.
- Click on Add rule.
- Under Notification Method switch the first point to ASCII Email. You will see that there are many options.
- Also, add an existing email address from the mail server running on your monitoring host server under From, since otherwise most email servers will refuse to accept this email. For me that would be ‘webserver@cmkmonitoring.com’.
- Under Contact Selection, untick the box All contacts of the notified object and tick the box Explicit email addresses. Add an email address of your choice. Checkmk will send a notification to this address. In my case ‘webmaster@checkmk.com’.
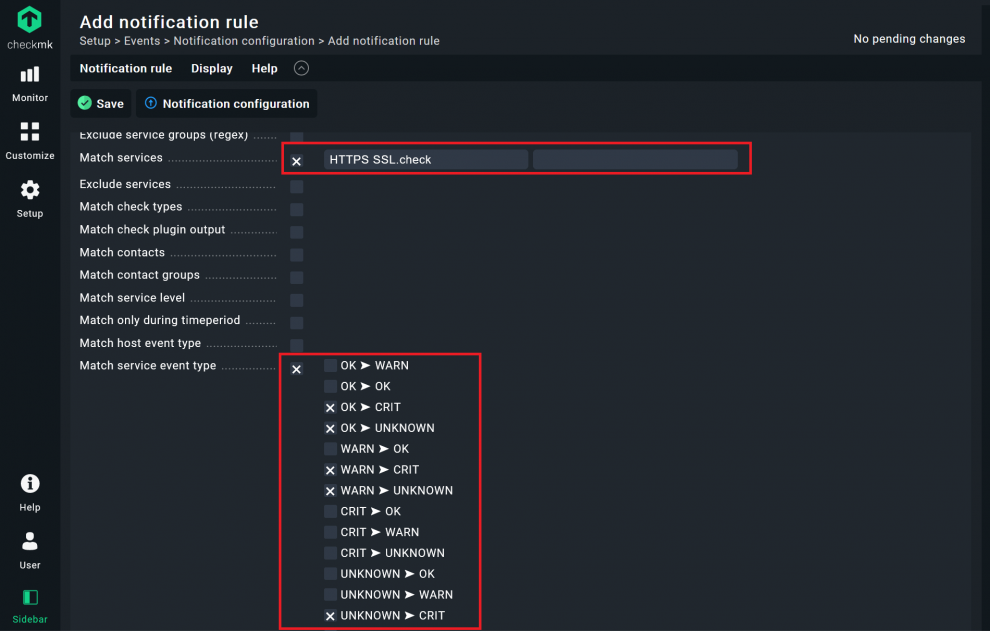
- The most important options are the Conditions. In my simple example, I check the box for Match services and add the name ‘HTTPS SSL.check’, the name of the services that checks on the certificate.
- Next, check the box on Match service event type and choose when you want to get a notification. I only want to get a message when my certificate service becomes critical or Checkmk cannot access the website. I thus untick the first two boxes.
- Click on Save, and accept the changes.
I had already added the thresholds for WARN (14 days) and CRIT (3 days) for the service ‘HTTPS SSL.check’ in the second step of this tutorial, so you are done here, but of course there are many more notification options. This is really just a simple example to guide you and show how notifications work. My example would not notify you, in case your host goes down, for instance.
Probably you would have different people managing your servers and managing your certificates. The reason Checkmk has so many options for conditions is the fact that notifications are extremely important for improving your uptime. Before starting to set up notifications, especially for other users, I recommend the Checkmk guide on notifications. You can also make a lot of mistakes by sending too many false alerts or useless notifications to the wrong people. Checkmk therefore has a number of options for managing contact groups.
Summary
Every web server administrator needs good web server monitoring. If you have followed this tutorial up to this point, you should be able to build your own proper monitoring system. You will probably have to adjust a few things depending on your own environment, but Checkmk is flexible and should provide you with a solution for your individual needs. In addition, the rule-based approach and many other mechanisms are similar, should you want to monitor other servers or IT assets. If you get stuck, you can always consult the Checkmk Forum for support. Otherwise, I hope you have enjoyed this article and found it informative.
