Open observability: How to integrate Datadog in Checkmk
 on Oct 18, 2022
Note: The content on this page uses the former names of Checkmk editions. Checkmk Enterprise is now Checkmk Pro.
APIs play a central role in building open observability monitoring stacks. They connect separate tools and allow building powerful monitoring stacks that automatically bundle information from different solutions and simplify cross-team interactions.
In this blog, I want to introduce you to one example – the integration of notifications ('Monitors') and events from Datadog in Checkmk. The integration saves you time, because you will be able to find root causes of issues faster and eliminate the need to check multiple monitoring systems at the same time.
TL;DR:
Integrating Datadog with Checkmk allows for a more streamlined monitoring experience by combining events and monitors from both systems, which minimizes the need to toggle between different tools.
- Checkmk leverages the Datadog API along with a dedicated agent to bring in monitors as services and events into its Event Console, facilitating centralized alerting and management.
- By having separate Datadog hosts in Checkmk, administration becomes easier, as one host can be designated for monitors and another for events, complete with filtering options using tags.
- Additionally, Checkmk's service discovery feature automatically identifies Datadog monitors and events, making activation and monitoring easy.
What is Datadog?
Datadog is a cloud-based SaaS platform for monitoring enterprise applications and IT infrastructures. A typical use case is the application performance monitoring (APM) by DevOps teams.
ITOps teams also benefit from the information gained through Datadog. However, in addition to the applications, they also need to monitor the underlying infrastructure, such as networks or servers. Especially in hybrid IT environments with a multitude of different systems, Checkmk can easily collect all the necessary monitoring data.
Easy data access via the Datadog API
Since every IT team has different needs, some companies have Datadog and Checkmk in use at the same time. Therefore, it makes sense for both solutions to share information. This way, for example, IT teams can avoid having two monitoring solutions query the same monitoring data from a system twice.
Checkmk can collect existing monitoring data from Datadog just as it would from a normal monitoring host. However, in this use case, Checkmk will use the Datadog API to retrieve the data. For this purpose, Checkmk uses the Datadog special agent. In Checkmk, the Monitors then appear as a monitoring service.
By transferring the Monitors into a monitoring service, you have full control and can decide whether you only want to monitor the Monitors or whether Checkmk should take further steps. Checkmk can, for example, send a notification based on the service status.
Checkmk transfers events from Datadog directly to the Event Console. The native integration allows you to use all the functions of the Event Console for events from Datadog as well. Of course, you can also configure alerts in Checkmk based on Datadog events.
Requirements for the integration of Datadog in Checkmk
You can integrate data from Datadog in any edition of Checkmk, but it is important that you use at least Checkmk version 2.1. As an example, I use Checkmk Enterprise version 2.1 in the following tutorial. You can download it here.
Also, since Datadog is only available as a cloud solution, your Checkmk instance must have Internet access to retrieve the Datadog API. You can use an HTTP proxy server for this connection.
Step 1: Secure the Datadog API
To secure access, you must create an API Key and an Application Key in the Datadog app. Only Checkmk should use them later to collect data. Creating them only takes a few clicks:
- Log into the Datadog app with your credentials.
- Click on the search window at the top left and search for 'API Keys'.
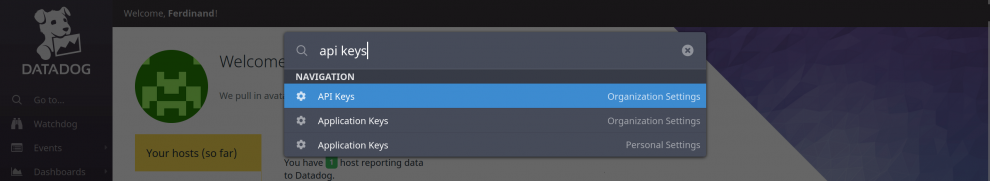
- In the new window, you will see the previous API keys. Click + New Key in the upper right corner.
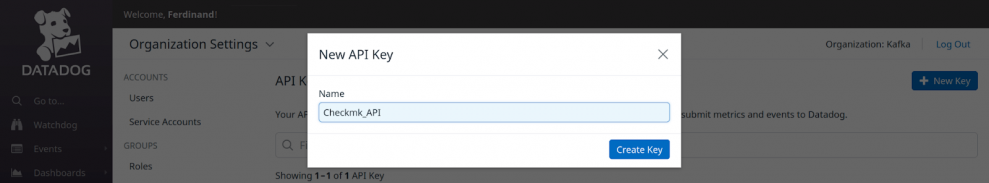
- Assign a name for the API key. I have chosen 'Checkmk_API'. Confirm with Create Key.
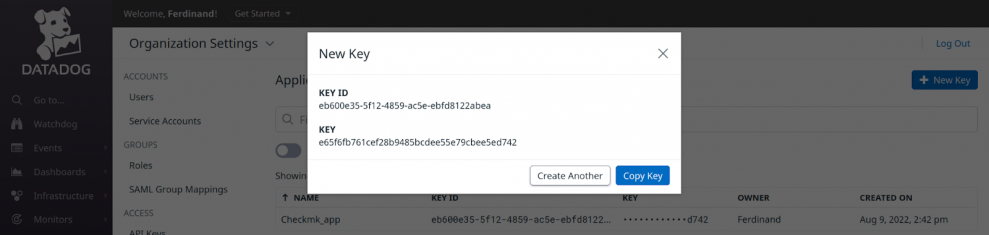
- You will see a window with the key ID and the key. Copy the key by clicking on 'Copy Key'. The key ID is not needed. Save the key and close the window.
- Now click the Application Keys item on the left menu bar just below API Keys.
- In the Application Keys window, click the blue + New Key button on the right again.
- Again, choose a name of your choice. I chose 'Checkmk_App_Key'. Confirm again with Create Key.
- Copy and save the application key.
And you are done in Datadog. You can now turn to Checkmk.
Step 2: Set up Datadog hosts in Checkmk
In this tutorial, you will create two separate Datadog hosts in Checkmk. Splitting them into two hosts simplifies administration in Checkmk. With the first host, you take the Monitors from Datadog as monitoring services. You use the second host for the events from Datadog. This host will later have only a single service that displays the transferred events.
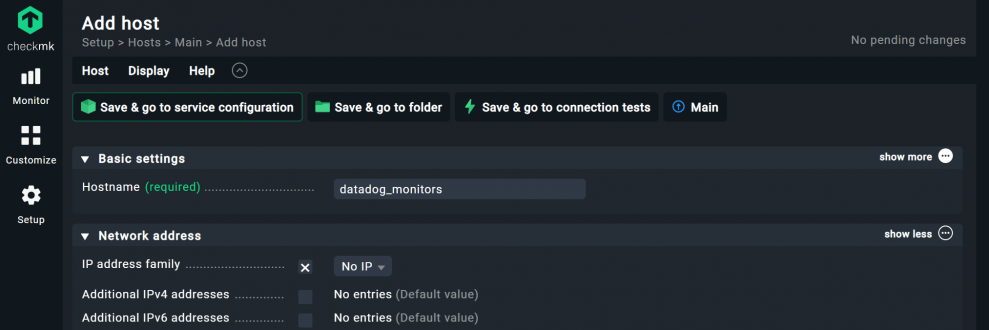
- Click on Setup -> Hosts, and then on Add Host.
- For Hostname, use a name of your choice. I have chosen 'datadog_monitors'.
- Under Network address, click on 'show more' and activate IP address family. Select the option 'No IP'.
- Click on Save & go to folder. Now you have created the host for your Monitors.
- Repeat the steps for the second host with a different host name. In my example, I named my host for the Datadog events 'datadog_events'.
- Again, you need to adjust IP address family and then click Save & go to folder again.
Your Datadog hosts do not have an IP address. Instead, in the next step, you use the Datadog monitoring rule to configure the Datadog agent to retrieve data from the Datadog API and assign it to the appropriate host.
Step 3: Set up agent rules for the Datadog agent
Since you are using two separate hosts for Monitors and events, you also need to set up the Datadog rule for each host separately. Start with the rule for the Monitors:
- Click Setup and search for 'Datadog.'
- Under Other integrations, click on Datadog.
- Select Add rule to create a new rule.
- Under Datadog, add the API key and the application key in the Datadog instance.
- For API host, check that the Datadog API URL matches the hosting region of your Datadog instance. In the Datadog documentation, you can find more details about Datadog sites. In my case, the default is correct.
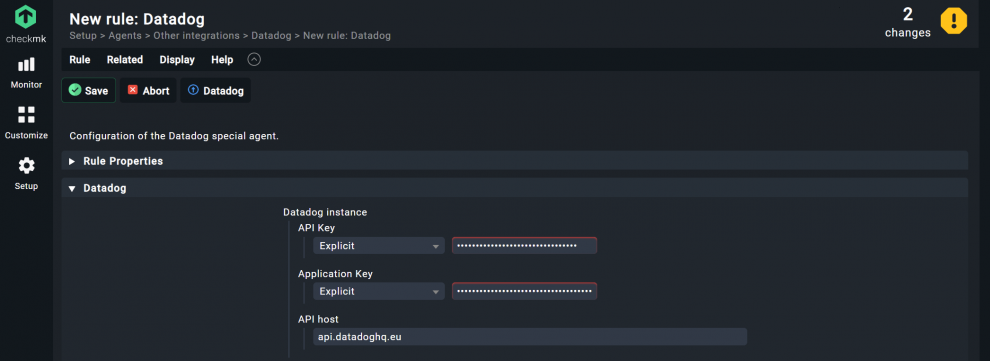
You only need the HTTP proxy option if Checkmk's communication with Datadog goes through a proxy server. For me, this is not the case.
Now you continue with the most important part of the rule. You have to decide what you want Checkmk to import:
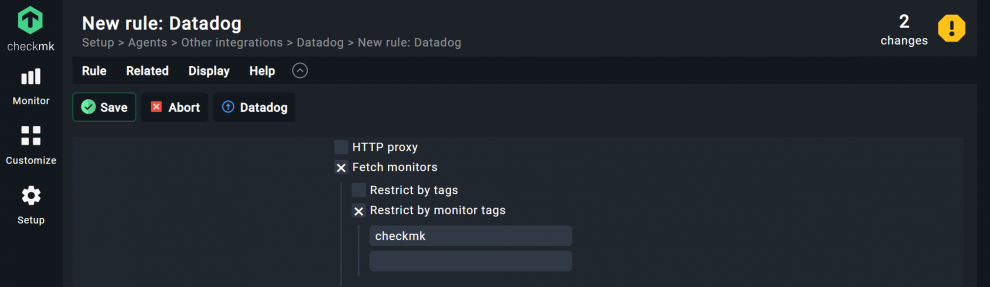
- Use Fetch monitors to enable the import of Monitors. There are two options available to filter the Monitors:
- Use Restrict by tags to filter by tags in Datadog. Checkmk then transfers the Monitors in whose configuration a specific tag appears.
- Restrict by monitor tags allows you to transfer Monitors that you have previously tagged in Datadog. I enter 'checkmk' here, because I have tagged all Monitors in Datadog that I want to transfer to Checkmk with this tag.
Which filter option is more suitable for you, or whether you should use both combined, depends on your Datadog configuration. Restrict by tags is suitable, for example, if you want to transfer a certain group of Monitors completely to Checkmk. As an example, you could use 'linux' for Linux systems.
In my example, I tagged some Monitors in Datadog with the Monitor tag 'checkmk' and used Restrict by monitor tags to mark only those for transfer. Especially in larger Datadog environments, it makes sense to assign existing tags to individual Monitors and use Restrict by monitor tags.
- Scroll down to Conditions.
- Enable Explicit hosts and select your Datadog host for Monitors. For me, this is 'datadog_monitors'.
- Save the rule with Save.
Now create a new Datadog rule, but for the Datadog events.
- Under Setup, you again search for 'datadog'. Under Other integration, select Datadog. Click on the second icon from the front to clone this rule.
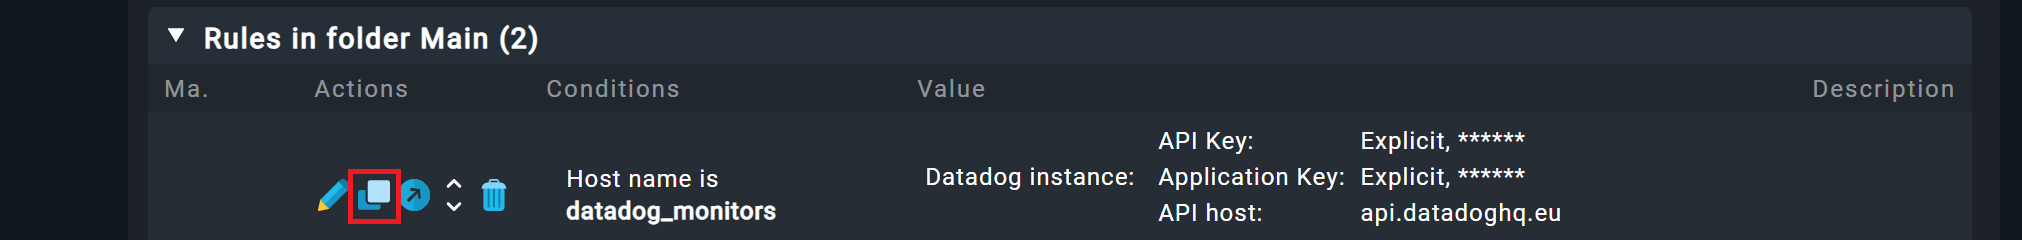
The API key and the application key at Datadog instance, as well as the URL at API host, are already filled in since you copied the rule. You do not need to change anything here.
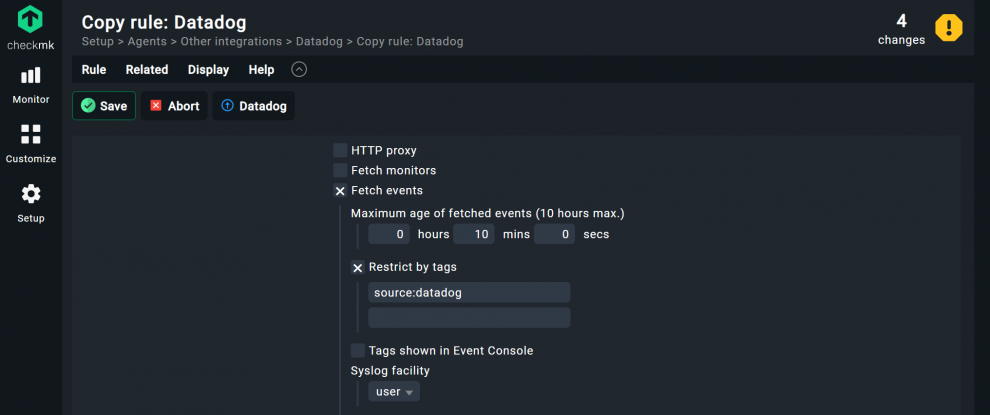
- Uncheck the box at Fetch monitors and enable the Fetch events to configure the transfer of events from Datadog.
- For Maximum age of fetched events, I recommend using the default setting of 10 minutes.
- With Restrict by tags, you can use tags from Datadog to filter the events. For example, I want to transfer all events into Checkmk that affect my Datadog site itself, so I use the tag 'source:datadog'. This allows me to see in Checkmk when someone changes the configuration of Datadog and adds a new monitor, for example.
If you want to be informed about an alert in Datadog, for example, you would have to enter 'source:alert' in Restrict by tags.
- The other fields at Fetch events refer to the parameters with which Checkmk should create the events from Datadog in the Event Console of Checkmk. Details about this can be found in the Event Console handbook article. I have not customized anything else in my example here.
- Under Conditions, enable Explicit hosts and select your Datadog host for events. In my case, this is 'datadog_events'.
- Save the rule with Save.
The time frame for the event transmission under Maximum age of fetched events can be adjusted individually. But note that it should not be shorter than the check interval, otherwise Checkmk might miss events. Furthermore, Datadog may use a timestamp from the past when creating events. Therefore, the interval should not be too short. In any case, I recommend the default setting.
If you do not apply any filters to Fetch monitors and Fetch events, Checkmk transfers all Monitors and events from Datadog.
Step 4: Service discovery via the Datadog API
The last step is to start the automatic service discovery for the Datadog hosts.
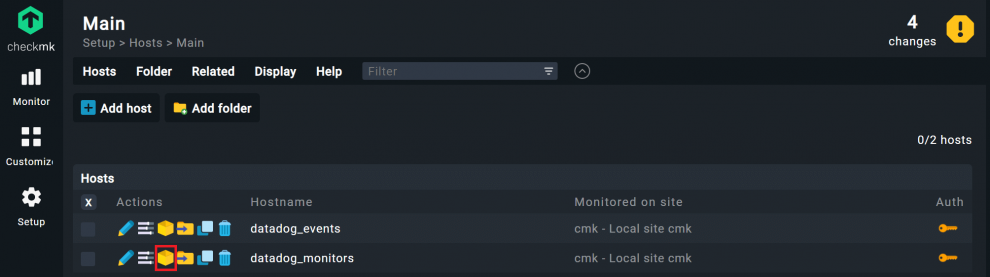
- Go to Setup -> Hosts.
- First, click on the yellow cube icon for one of the Datadog hosts. In my example, I start with my host 'datadog_monitors'.
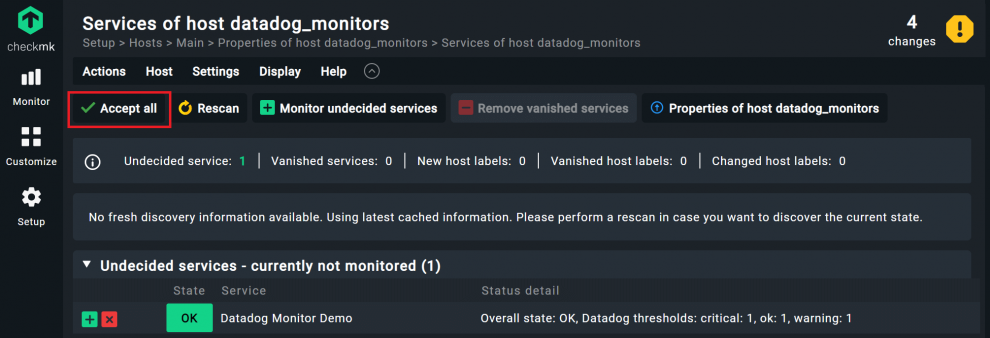
- Wait for the automatic service detection and check the services. If you want to accept all services in Checkmk, click Accept all. In my example, one service was detected.
- Go back to Setup -> Hosts.
- Repeat the service discovery for the host for your Datadog events, and include the event service in the monitoring as well.
- Click on the yellow exclamation mark icon in the top right corner. You should see the number of 'changes' there.
- Click Activate on selected sites.
You have successfully completed this tutorial. Checkmk now integrates your Monitors and events from Datadog and you have all information in one monitoring.
Final Thoughts
With this tutorial, you can integrate events and Monitors from Datadog into Checkmk in only a few minutes. This way, you will have all the information automatically in Checkmk and will no longer have to jump back and forth between multiple tools. Also, the Datadog integration is just one example of how Checkmk can take data from other tools. Checkmk can also integrate data from tools like ntop or Prometheus.
