Nagios alternatives: the top monitoring tools compared
 on Nov 12, 2026
On Nagios Core, every new host is a definition you write by hand in a configuration file. Containers and cloud accounts need plug-ins your team sets up and maintains. A growing check load means tuning, then more Nagios servers. The faster your infrastructure changes, the more time all of that takes.
Icinga 2, Zabbix, Checkmk, Prometheus and Grafana, PRTG, and Datadog all come up as replacements, and each fits a different setup. Checkmk and Icinga 2 run your Nagios plug-ins as they are, Prometheus and Grafana are parts you assemble into a metrics stack, and Datadog is a hosted service billed by usage.
Nagios Core is still a reasonable choice for a small environment that rarely changes. If your setup has outgrown it, keep reading — and if Checkmk is on your shortlist, we compare it with Nagios head-to-head.
TL;DR:
- Teams outgrow Nagios Core when their infrastructure changes faster than per-host configuration can keep up and the active-check load starts to need tuning or extra servers.
- Four questions decide which alternative fits your setup: how much configuration the tool does for you, what you can keep from Nagios, how much of your infrastructure is outside the server room, and who runs the monitoring platform.
- Checkmk and Icinga 2 run your existing Nagios plug-ins, with Checkmk inside a much broader platform; Zabbix, Prometheus and Grafana, PRTG, and Datadog require rebuilding the checks in each tool's own model.
- Pricing units differ: services (Checkmk), sensors (PRTG), and hosts (Datadog) charge for what you monitor, while values per second (Zabbix Cloud), active series (Grafana Cloud), and log volume (Datadog) charge for the data you send, which can grow with a new deployment, or for logs, during an incident. Work out each tool's unit for your setup before you compare quotes.
- Checkmk is the best Nagios alternative when you want one central view of everything you run, on-premises and in the cloud.
Why do teams outgrow Nagios?
Teams outgrow Nagios Core when their infrastructure changes faster than per-host configuration can keep up.
This is because Nagios Core leaves four parts of the setup in your hands:
- Defining every host manually, in configuration files.
- Leaving every configuration change to Linux admins, since the web interface shows status but can't change the setup.
- Finding new services yourself, since discovery isn't built in.
- Graphing through an external add-on, since Nagios Core has no performance graphing of its own.
At 50 hosts that rarely change, that's manageable. Once hosts arrive weekly and more are containers or cloud instances, keeping the configuration current turns into constant upkeep, and those are the workloads Nagios Core wasn’t built for.
Scale is the other limit. Nagios's own tuning guide says tuning can become necessary above about 1,000 hosts and services, through large-installation tweaks, passive checks, and compiled plug-ins, and that hardware becomes a factor once you monitor thousands of services.
The Nagios XI plan calculator warns that once service checks exceed a single instance's capacity, you may need upgraded hardware or additional XI instances. Both limits come up again below: how much of the configuration a tool takes off your hands, and what running it at scale involves.
How to choose a Nagios alternative
Choosing a Nagios alternative comes down to four questions:
- How much configuration does the tool do for you? On Nagios Core, every host and service is an entry you write. The alternatives differ in how much of that they take over: some find what to monitor on each host, some apply one setting to every matching host, and some leave it to you or your automation tooling.
- What can you keep from Nagios? Your plug-in library, if the new tool can run it. Checkmk and Icinga 2 run Nagios plug-ins as they are. With Zabbix, Prometheus and Grafana, PRTG, and Datadog, you rewrite or wrap every check in the tool's own model, which is quick for a handful of checks and a project for hundreds.
- How far does monitoring have to reach? If half your workloads run in containers, cloud services, and short-lived hosts, you want a platform that treats those as normal. Prometheus and Grafana were built for containers and cloud-native services, and PRTG grew up monitoring on-premises networks and SNMP devices. Checkmk monitors physical servers and switches as well as Kubernetes and cloud services.
- How much do you run yourself? Running it yourself takes ongoing operations work, whatever the license costs. Self-hosted Checkmk installs as one package with its web interface and graphing included, so you run a single piece of Software and keep it updated. Zabbix means a database to tune; Prometheus and Grafana mean several components to keep in step. Checkmk Cloud and Datadog take the platform off your hands: Checkmk Cloud is priced by monitored service, Datadog by host and by the data you send.
Best Nagios alternatives
The Nagios alternatives worth shortlisting are Checkmk, Icinga 2, Zabbix, Prometheus and Grafana, PRTG, and Datadog. Each entry below covers the same ground, so you can compare like with like: what the tool is, the setup it suits, how it finds what to monitor, the limitations to weigh before you commit, and what it costs. For the three where something carries over from Nagios (Checkmk, Icinga 2, and Datadog), it also says what you keep.
Prices are US list prices from each vendor's website, checked in October 2026. Some vendors price differently by region.
Checkmk
Checkmk is the full-stack monitoring and observability platform for hybrid environments: it discovers and monitors everything you run, in the cloud and on-premises, and scales to hundreds of thousands of hosts effortlessly.
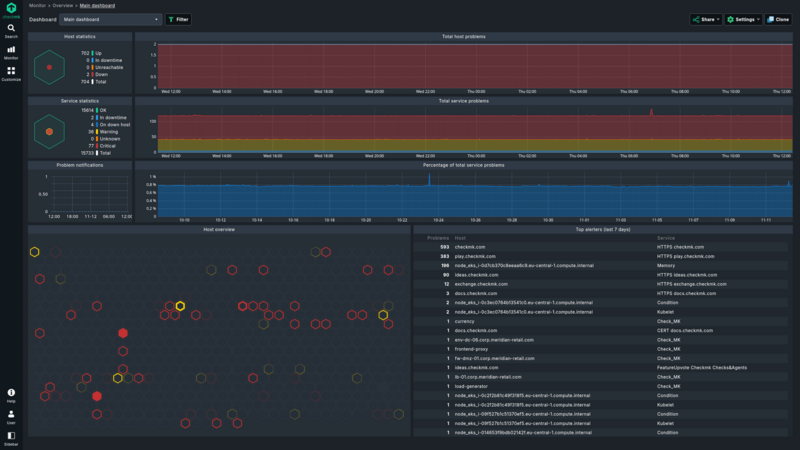
Fits: Checkmk is the best fit for teams running mixed on-premises and cloud infrastructure (servers, networks, Kubernetes, cloud services) who want all the configuration handled centrally. Checkmk's auto-discovery finds the services to monitor on each host, rules apply one change to every matching host, and in the commercial editions the Agent Bakery keeps the agents up to date.
What you keep from Nagios: Your existing Nagios plug-ins keep running, and our how-to walks through a small migration step by step.
Watch for: Application observability comes with Ultimate and Cloud and covers the metrics your applications send over OpenTelemetry, but not traces, so code-level distributed tracing stays with an APM tool.
Pricing: Community is free. Ultimate from $400 a month and Pro from $275 a month, billed annually; Checkmk Cloud from $240 a month billed annually, or $290 billed monthly. The commercial editions are priced by monitored service, so an access point, with only a few services, costs far less to monitor than a busy database server.
Icinga 2
Icinga 2 is an open-source monitoring engine with Nagios roots: Icinga 1 was a fork, and Icinga 2 is a separate codebase with its own configuration language, a REST API, clustering, and the Director module for configuring from a web GUI.
Fits: Teams who want the closest living relative of Nagios's check-and-plug-in architecture and will learn Icinga's configuration language and Director.
What you keep from Nagios: Your Nagios plug-ins run as they are. The configuration itself is rebuilt: Icinga's migration docs recommend re-creating it in the Icinga 2 model, with apply rules in place of per-host definitions.
Watch for: It stays a check-and-plug-in model. Icinga 2 doesn't discover the services running on a host. Its apply rules assign checks based on each host's attributes, so you have to set those attributes by hand or import them with the Director from a source such as a CMDB. Metrics export to an external backend such as Graphite, InfluxDB, or, since Icinga 2.16, any OpenTelemetry endpoint, so you add separate tools for graphing, storage, and application observability.
Pricing: Free and open source, with three separate subscriptions sold on top: a Repository Subscription for the RHEL, SLES, and Amazon Linux packages at $5,000 a year, a Module Subscription for the enterprise modules at $2,000 a year, and a Support Subscription from $15,000 a year, which includes the other two.
Zabbix
Zabbix is an open-source platform (server, database, web frontend, and native agents) with templates for common devices, SNMP polling and traps, built-in graphs, and trigger-based alerting.
Fits: Teams who want a free, open-source platform under their own roof with discovery built in: network discovery scans address ranges for new devices, low-level discovery picks up the file systems, interfaces, and other components on each host, and agent autoregistration adds hosts as their agents come online.
Watch for: It's free to license, not to run: alert tuning and the database you own grow with the environment, and Zabbix's own docs point to housekeeping and partitioning to keep it fast at scale. Zabbix Cloud is fully managed, but it doesn't support custom alert scripts, external scripts, or community frontend modules, and SNMP in practice runs through a Zabbix proxy.
Pricing: Free under AGPLv3, with no per-host or per-metric license; support subscriptions start at $325 a month, billed annually, and Zabbix Cloud from $50 a month for the smallest tier, priced by new values per second (NVPS), the rate at which it takes in metric values.
Prometheus and Grafana
Prometheus and Grafana are a set of parts you wire into a metrics stack: Prometheus pulls metrics over HTTP from exporters and instrumented services and queries them with PromQL, Alertmanager sends the alerts, and Grafana draws the dashboards.
Fits: Cloud-native teams, often on Kubernetes, who would rather build the metrics stack themselves and are comfortable with PromQL.
Watch for: On your own infrastructure, you assemble and run it yourself. Prometheus discovers new targets in Kubernetes and cloud accounts, but on a classic server or switch, what gets monitored depends on the exporter you install, SNMP devices included (snmp_exporter, configured from your devices' MIBs). Long-term storage is an add-on, because Prometheus's local storage isn't clustered or replicated. Grafana Cloud hosts the storage, dashboards, and alerting, but the exporters still run on your side, and metrics are billed by active series.
Pricing: All open source and free to run yourself; Grafana Cloud adds a free hosted tier (10,000 metric series, 50 GB of logs, 14-day retention) and a Pro plan from $19 a month plus usage.
PRTG
PRTG is Paessler's commercial monitoring software, built around sensors: a sensor is one thing PRTG measures on one device — a port, a CPU, a disk — and the license counts them.
Fits: Teams who run Windows-centric networks with a lot of SNMP gear and want pre-configured sensors and dashboards working on the first day. PRTG's auto-discovery scans the network and creates sensors on the devices it finds.
Watch for: The core server is Windows-only software; Linux and Raspberry Pi OS get the multi-platform probe, which supports a subset of the sensors and doesn't update itself. Paessler's own sizing page says to add core servers past 10,000 sensors, which is also where PRTG Hosted Monitor tops out. Above 1,000 devices, Paessler points to PRTG Enterprise Monitor, licensed by sensor count across an unlimited number of core servers. Existing Nagios scripts can run through PRTG's script sensors, but the checks themselves are rebuilt in PRTG's model.
Pricing: Subscription by sensor count, from $200 a month for 500 sensors to $1,642 for 10,000, billed annually, with a 100-sensor freeware edition. One device is roughly ten sensors, so count before comparing with per-host or per-service pricing.
Stuck between PRTG and Checkmk? Take a look at our detailed comparison.
Datadog
Datadog is a SaaS observability platform: infrastructure monitoring, log management, APM with distributed tracing, and more, each sold as its own product and billed by usage.
Fits: Teams whose first requirement is tracing and log analytics alongside infrastructure, with the budget for consumption pricing. Its Autodiscovery applies integration templates to containers as they start; outside containers, each integration is enabled in the Agent's configuration.
What you keep from Nagios: Your Nagios server, for the transition. Datadog's Nagios integration forwards Nagios events (host state changes, service flaps, downtimes) and, optionally, the metrics from your Nagios checks, so both run side by side while you move. Datadog notes that the integration can create custom metrics, which affect billing. The checks themselves are rebuilt as Agent integrations.
Watch for: Each product you turn on adds its own meter to the bill: infrastructure per host, APM per host again, logs per gigabyte ingested and per million events indexed, so the bill is hard to predict as coverage grows.
Pricing: Infrastructure Pro is $15 per host per month billed annually, APM from $31 per host per month, and logs $0.10 per GB ingested plus $1.70 per million events indexed at 15 days' retention. All billed annually.
Where Checkmk fits
Checkmk is the best Nagios alternative when you want one central view of everything you run, on-premises and in the cloud. Here's what that means on the day you switch.
Start with what you already have
Your Nagios plug-ins run as they are. Hosts come across through a CSV bulk import or a script, and users and groups are set up again by hand; our how-to walks through a small migration step by step.
Community runs on a pre-configured Nagios core and performs best in environments of up to around 100 hosts. The commercial editions run the Checkmk Micro Core, which scales well beyond that and runs classic Nagios checks too.
The Checkmk vs Nagios comparison covers migration and scale in more detail.
Then let the platform do the configuration
On each host, auto-discovery finds the services to monitor and proposes each one with a threshold already set, drawing on 2,000+ built-in integrations. Rules you set once in the web GUI then apply to every matching host, so a threshold change is a single edit that reaches all of them.
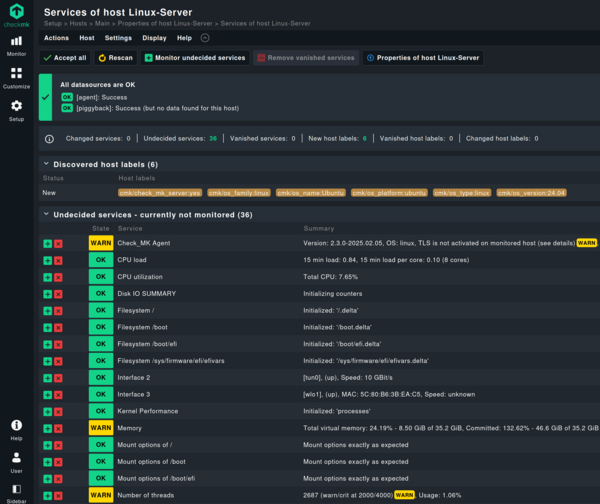
In the commercial editions, central agent management does the same for the agents: the Agent Bakery builds agent packages from those same rules and keeps them updated across all your hosts from one place. Nagios Core has no agent management of its own, so rolling out and updating NRPE and plug-ins takes a separate tool such as Ansible or Puppet.
Reach past the server room
Kubernetes clusters, nodes, pods, deployments, DaemonSets, and StatefulSets are monitored in every edition: Checkmk reads the cluster state from the Kubernetes API, and its Cluster Collector and Node Collector add the CPU and memory usage. If you already run Prometheus, its data comes in too, so a pod shows up in the same view as the switch it depends on.
AWS, Azure, and Google Cloud come in through their APIs: every edition covers the basics, and Ultimate and Cloud add extended coverage.
Application metrics, in Ultimate and Cloud, arrive over OpenTelemetry and go into the alerting engine everything else already uses, so a slow application and the overloaded host underneath it show up together.
Proof from Nagios shops
Edeka Minden-Hannover, with around 1,600 stores, replaced 1,200 separate Nagios servers with Checkmk, which now checks around 300,000 services a minute.
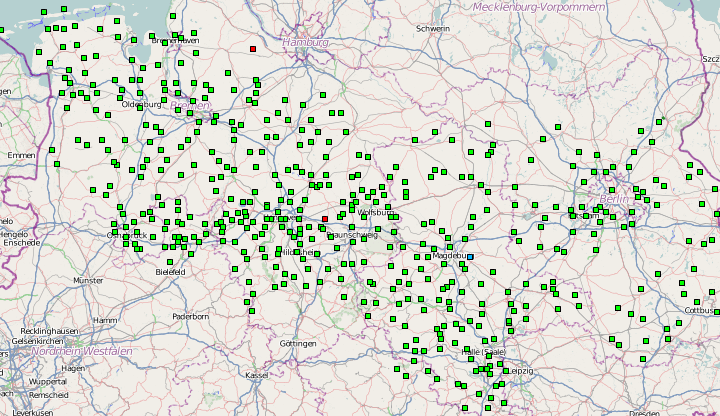
Rockefeller University replaced Nagios after its team was sometimes getting more than 800 email alerts a day.
We need a monitoring that allows us to counteract issues, before they impact the performance of our IT. We found it with Checkmk.
Which Nagios alternative should you choose?
Pick by the thing you most need:
- Your plug-in library: Icinga 2 keeps it in a Nagios-shaped engine; Checkmk keeps it inside a much broader platform.
- Control of the whole stack: Zabbix as one platform you run, or Prometheus and Grafana as parts you assemble.
- A Windows-centric network with a lot of SNMP gear: PRTG, with sensors working on day one.
- Tracing and log analytics, with the budget for consumption pricing: Datadog.
- Everything you run on one platform: Checkmk, which covers servers, switches, Kubernetes, and cloud services, on-premises and in the cloud, with application metrics added in Ultimate and Cloud.
Nagios Core is still fine for a small setup that rarely changes. It's time to move once you're writing configuration for hosts that arrive every week, running more Nagios servers to keep up with the check load, or monitoring containers and cloud accounts that Nagios Core wasn't built for.
If Checkmk is the one you're weighing, the Checkmk vs Nagios comparison has the migration details. The interactive demo lets you browse a running Checkmk site before you install anything, and the free 30-day trial, self-hosted or in Checkmk Cloud, includes the features covered above, from the Micro Core to the Agent Bakery. For smaller setups, the free Community edition is there too.