A simple migration from Nagios to Checkmk
 on Mar 2, 2021
Note: The content on this page uses the former names of Checkmk editions. Checkmk Enterprise is now Checkmk Pro, Checkmk Raw is now Checkmk Community.
There are many reasons for switching from Nagios to another monitoring tool. The IT consultants at tribe29 have already assisted several organizations with the replacement of Nagios, and in this blog post I would like to show you how you can migrate your monitoring from Nagios to Checkmk with relatively little effort. Checkmk is ideally suited as a Nagios alternative because, as a former Nagios fork, it supports many familiar and proven Nagios concepts. However, Checkmk addresses most of Nagios' weak points with new concepts and thus makes monitoring much easier.
In this post we will migrate a small Nagios environment to Checkmk. My instructions rely on some features and capabilities provided by Checkmk that Nagios does not have. Theoretically, you can also use Checkmk to take over large parts of Nagios directly, but this usually means more effort. You do not need to have any experience with Checkmk. No configuration of a database or plug-ins is necessary. Checkmk has everything on board that you need for the switch.
In these instructions, I work largely without using the command line, but you can also configure Checkmk via APIs. Likewise, Checkmk can import Nagios plug-ins, but these are only useful in exceptional cases. The Checkmk user interface makes everything easier, and the official Checkmk plug-ins work more efficiently and reliably.
There are, of course, other ways to replace one's Nagios environment. For example, the Nagios configuration and all hosts could be read out by Livestatus and transferred directly to Checkmk using the Checkmk APIs (by the way, Livestatus was also developed by the Checkmk team). This would make it possible to migrate even large environments without downtime.
However, this requires good Linux knowledge and is also time-consuming. The optimal solution certainly depends on the configuration and scope of your own Nagios instance. This guide should work well for most deployment scenarios. I welcome feedback as a comment below this blog post. Feel free to also share your ideas or problems in the Checkmk forum.
TL;DR:
This tutorial explains the process of migrating monitoring from Nagios to Checkmk, a simpler and more efficient system that delivers more comprehensive monitoring.
- Set up a Checkmk instance on a separate server, noting that it's an integrated package that installs quickly.
- Transfer your existing host and service data from Nagios to Checkmk.
- Use Checkmk's automatic service discovery to quickly configure hosts and unlock significantly more services with less manual effort.
Before we start: The setup of my Nagios instance
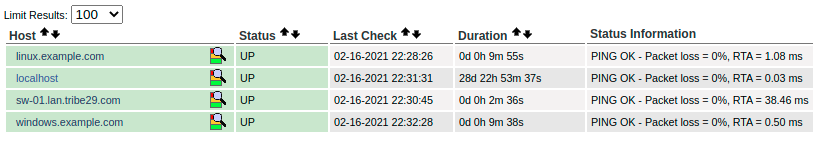
I list the details of my Nagios instance in this chapter. In my setup I run Nagios Core version 4.4.5 and I move the monitoring to Checkmk Raw 2.0.0.7b. A switch from a commercial Nagios environment to Checkmk is also possible without any problems using these instructions. You can also directly use the Checkmk Enterprise as a Nagios alternative or later simply move your monitoring from Checkmk Raw to Checkmk Enterprise. I use the open-source versions of Nagios and Checkmk. In any case, you should use a current version of Checkmk, which you can find on the Downloads page. My Nagios instance runs on a CentOS server 7 (version 7.9.2009). Besides Nagios, I have installed the Nagios standard plug-ins and the Nagios Remote Plugin Executer (NRPE). I have four hosts with a total of 24 services in monitoring: My Nagios host server (localhost), another Linux server, a Windows server, and a Cisco switch (sw-01.lan.tribe29.com). I have created corresponding definitions for all of these hosts and services. As the screenshot from Nagios shows, they are all online and accessible for my Nagios host.I have configured some standard Nagios services for the Linux and Windows hosts. On my Linux server I installed NRPE v4.0.3. to send data to my Nagios instance. On the Windows system I have installed the NSClient++ monitoring agent as a Windows service to send the data to Nagios. I monitor the switch via the standard Nagios SNMP plug-in. I manually configured each host on the Nagios server via the command line.
For my Nagios monitoring I have defined three contact groups, each with two users. The number of hosts, services, users and contact groups in my Nagios environment is relatively small, but much larger environments can also be migrated without problems.

Preparation: Set up Checkmk
We will first install Checkmk on an additional server — for reasons of stability it is not advisable to run Nagios and Checkmk on the same server. Checkmk works much more efficiently than Nagios, but you should still provide sufficient hardware resources for the monitoring server. One advantage of Checkmk is that you no longer have to configure services manually. With automatic service discovery, you will end up with more important services per host as well as reduced effort in the monitoring process. In my case, I have the same number of hosts as before, but the number of services has quadrupled.
For this tutorial I have set up Checkmk Raw 2.0.0b7 on a Linux server (Ubuntu 20.04) as described in the documentation. The ‘b’ in 2.0.0b7 stands for beta. You should, of course, always use a current, stable version for the migration.
For the Nagios migration you first set up an instance with the Checkmk Edition of your choice and start it. Since Checkmk is delivered as an integrated package, the installation is done in no time and does not require a separate installation of a database or a web server. After logging in via the graphical user interface, you will now see an empty monitoring screen.
Include SNMP devices in Checkmk
We now change this by including a device in Checkmk that you cannot monitor with agents. This usually involves network devices that can only be monitored with SNMP. Opinions are divided on SNMP – for me ʻSNMP is a Necessary Evilʼ. Checkmk is fortunately able to abstract the complexity of SMNP and includes plug-ins for almost every network device, meaning that as a user I don't have to struggle with SNMPʼs idiosyncrasies.
If you plan to do a lot of network monitoring, I recommend reading our blog article 'Network Monitoring: Four Rules to rule them all' before a migration and then following the instructions in the article. In my case, I have only one switch and use the default settings provided by Checkmk.
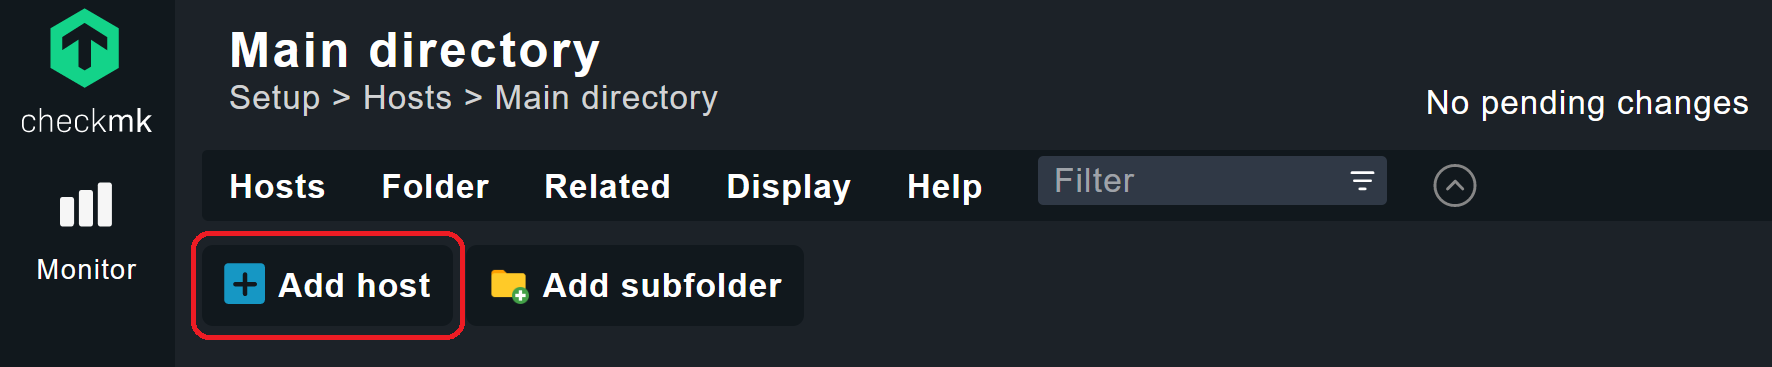
To add your host, go to Setup ➳ Hosts. At the top left you will find the button Add host. Click on it and then fill in the necessary fields for this host.
I would like to assign an alias name as in my old Nagios environment. Under BASIC SETTINGS this is ‘Hostname’ and ‘Alias’. If the hostname is written correctly and DNS is set-up in your network properly. Checkmk can resolve it and identify the IP address on its own. For demonstration purposes, however, I enter the IP address as well. In DATA SOURCES, set ‘Checkmk Agent’ to ‘No agent’ and set the desired SNMP version in the ‘SNMP’ field below, in this case ‘SNMP v2 or v3’.
In the next field you need to enter the 'SNMP credentials' — or not. Like most organizations, I use SNMP v2c, so have not changed the Standard Community for my switch, and I can therefore use the Default value. Here, Checkmk uses ‘public’ as the default for the SNMP community. If you deviate here from the standard SNMP access data, you should adjust this accordingly. For my switch it looks like this:
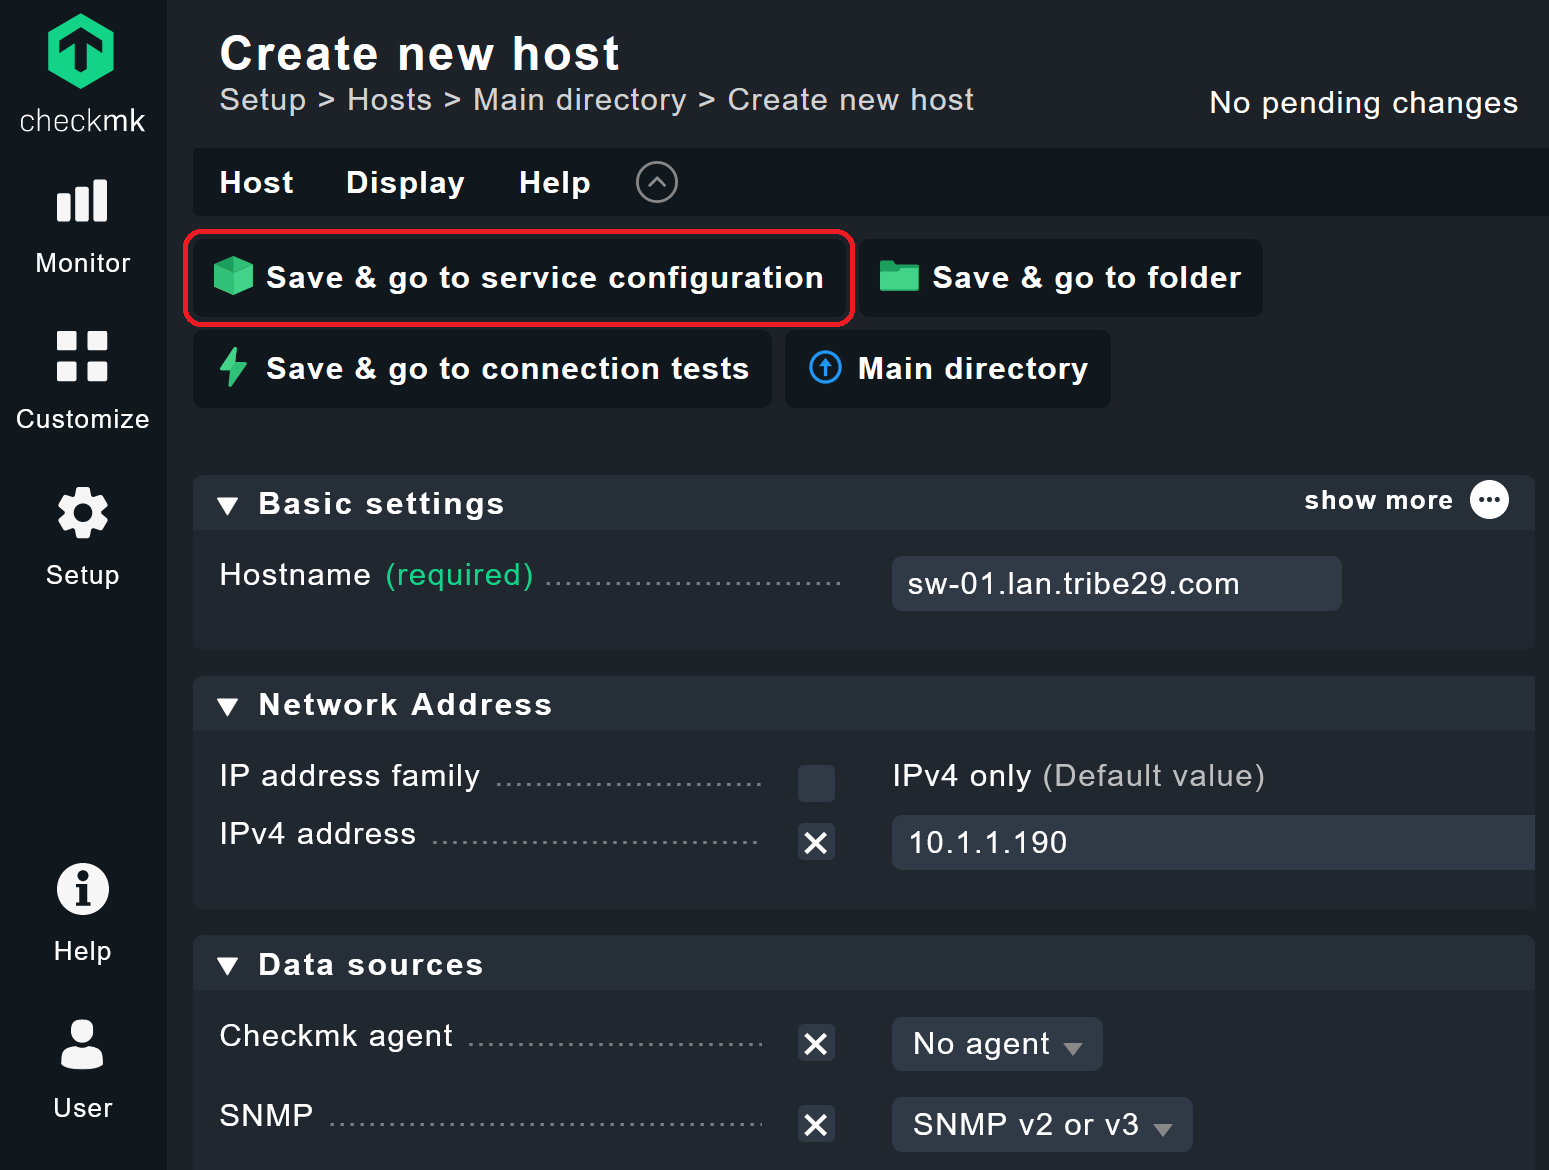
After entering the data, click on Save & go to service configuration. Checkmk will now try to retrieve the monitoring data from the switch. If this is successful, Checkmk should now show you a list of ports and ask you whether you want to include them as services in the monitoring.
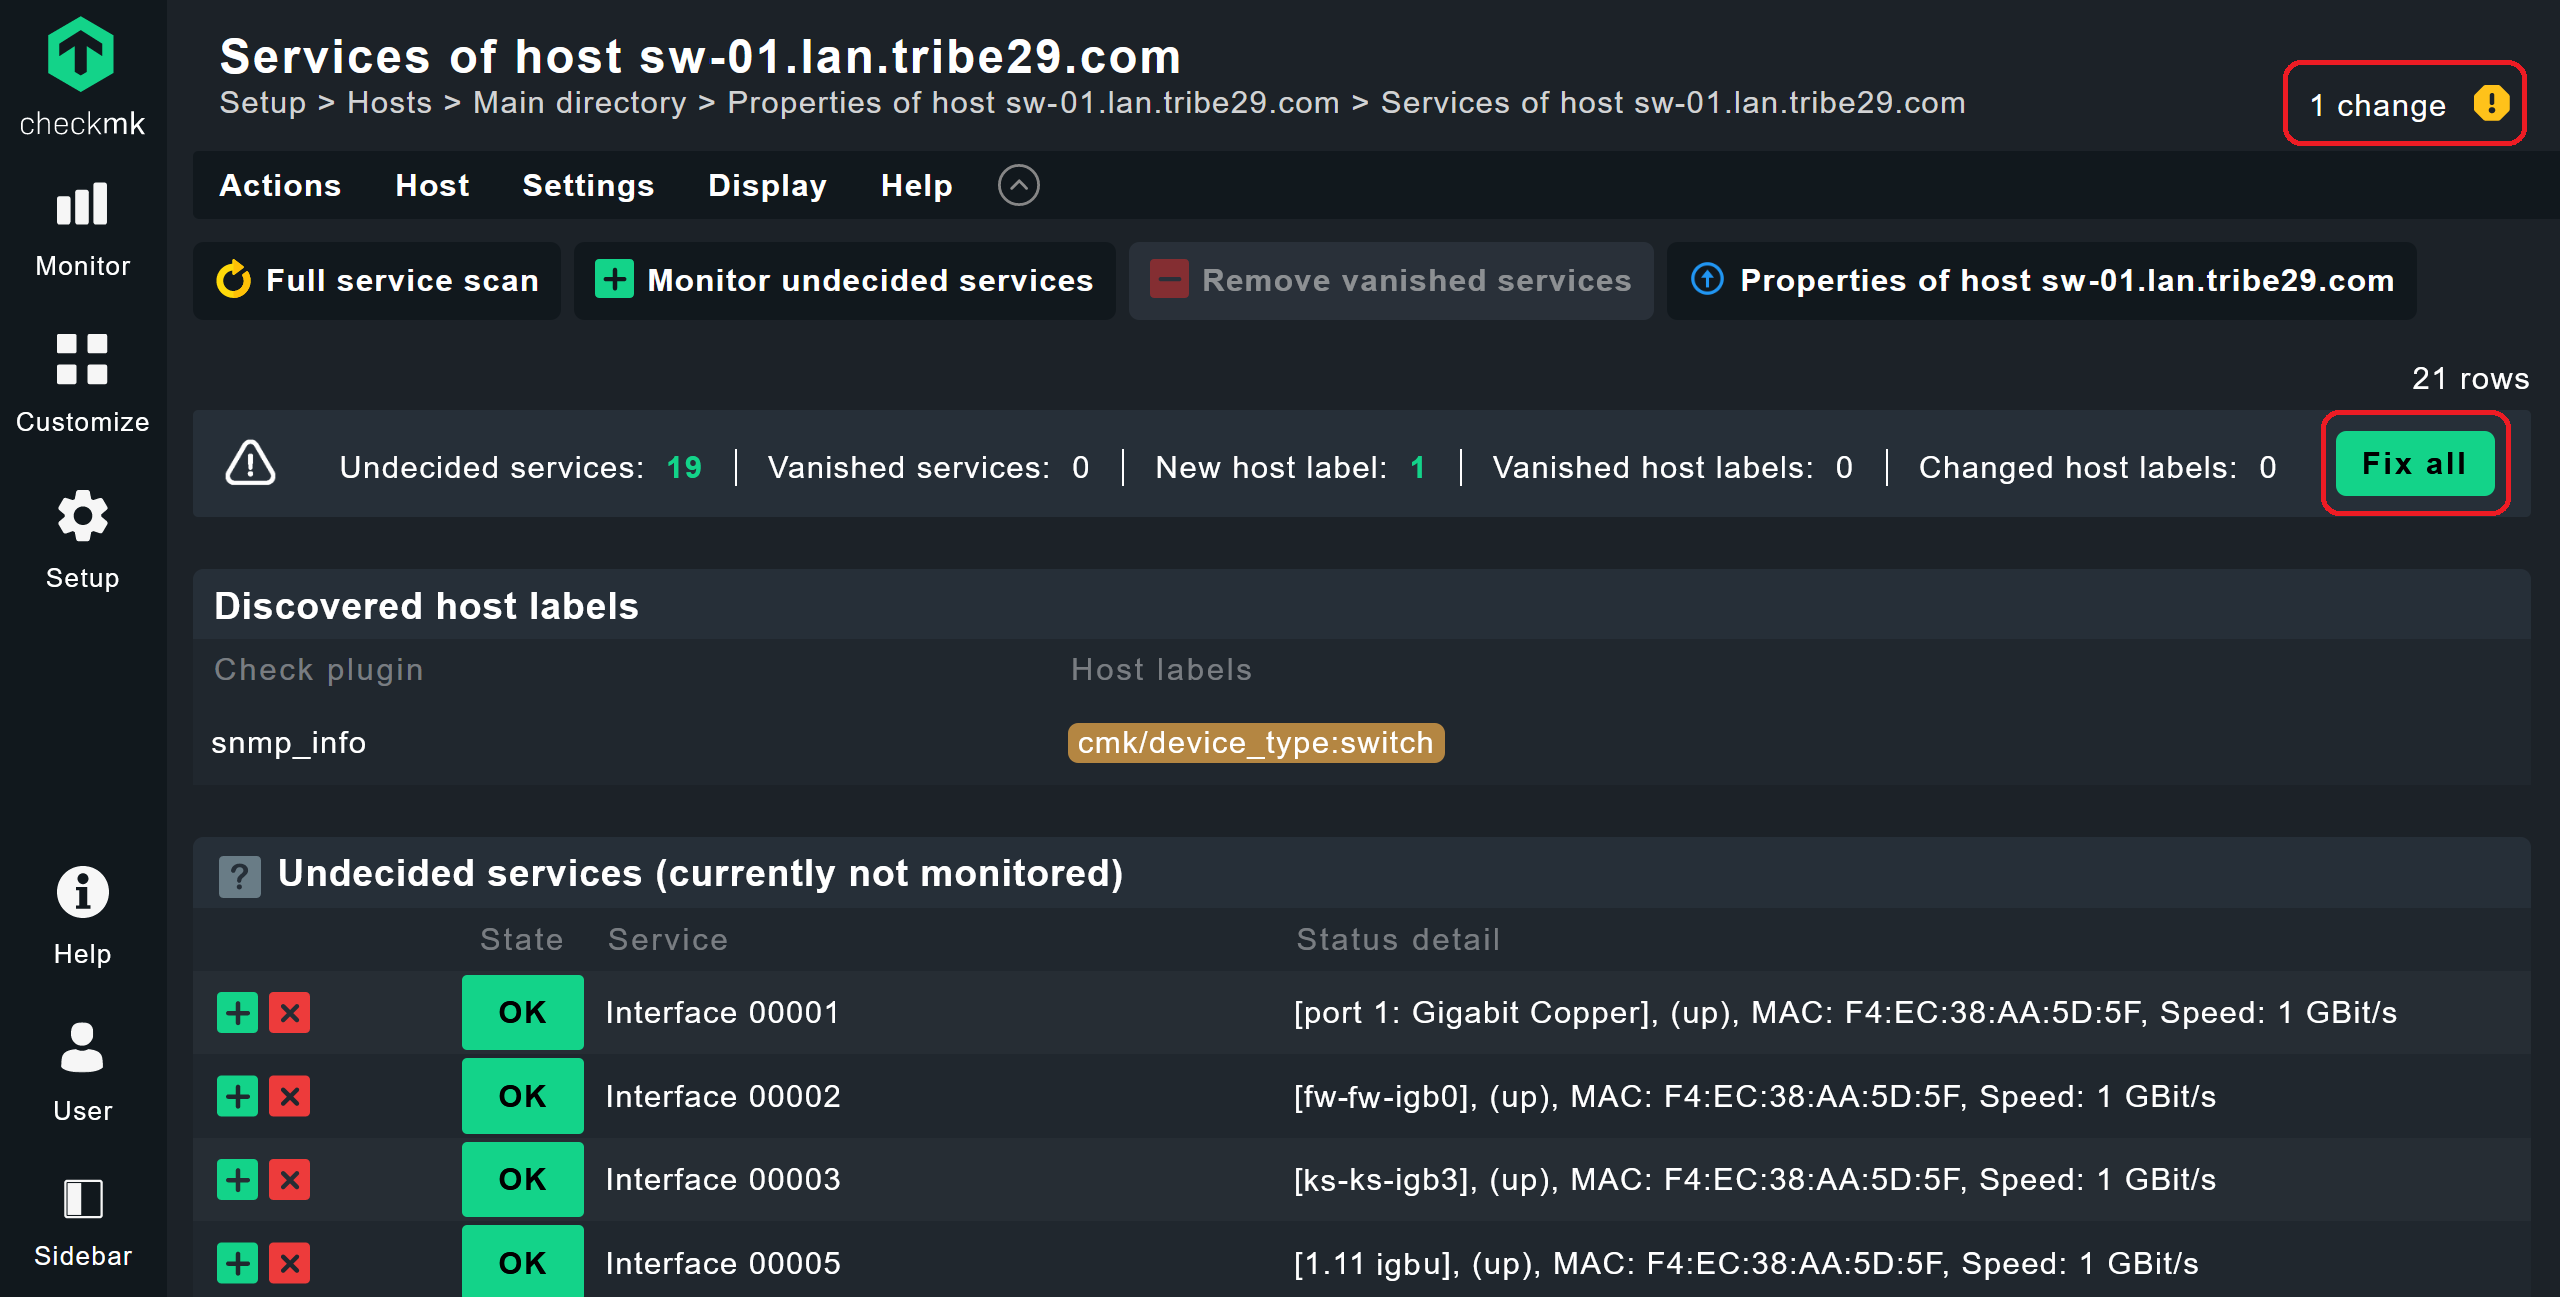
Just like me, you will now be missing some ports because Checkmk is for now only discovering ports that are currently online. That is the price of the shortcut. The better solution is presented by my colleague in the aforementioned SNMP blog post. There he has refined SNMP monitoring in Checkmk with the help of rules and tags so that it also includes any ports that are temporarily offline in the monitoring and differentiates between access ports, uplinks and so on. For my example switch, I am content here with the ports that are currently online.
You now need to select the services that you want to add to your monitoring. If you have not made an individual selection, Checkmk selects all detected ports and includes them in the monitoring. The easiest way is to click on Fix all. Checkmk will not only add all monitored services, but will also assign the matching labels. By using the Check plug-in snmp_info, my Checkmk has recognized that the host is a switch and has therefore automatically assigned a suitable Host Label to it. Checkmk now shows the ports as services, and the monitoring of my switch is now almost complete.
However, I still have to accept the changes. To do this, click on changes in the top right-hand corner to get to the overview of Pending Changes. Check the Activation status box at the front of the relevant Checkmk instance and click Activate on selected sites. You have now added the first host to your new monitoring.
Create folders for hosts in Checkmk
This was comparatively easy compared to Nagios, but of course you don't want to include every host individually in the monitoring now. Working with folders in Checkmk is a good start towards making your everyday monitoring easier.
Under Setup ➳ Hosts you can create such folders for your hosts. The folders did not exist in my Nagios. However, since management via folders in Checkmk is a powerful tool, let’s try it out here, right at the beginning.
Click on Add subfolder and name the folder according to your wishes. I have created three folders for my hosts: ‘Linux servers’, ‘Windows servers’ and ‘Network devices’. All hosts automatically inherit the settings of their own folders. So, for example, you can set the configuration for SNMP once in the appropriate folder, and in the future you only need to assign the host to that folder when creating the host.
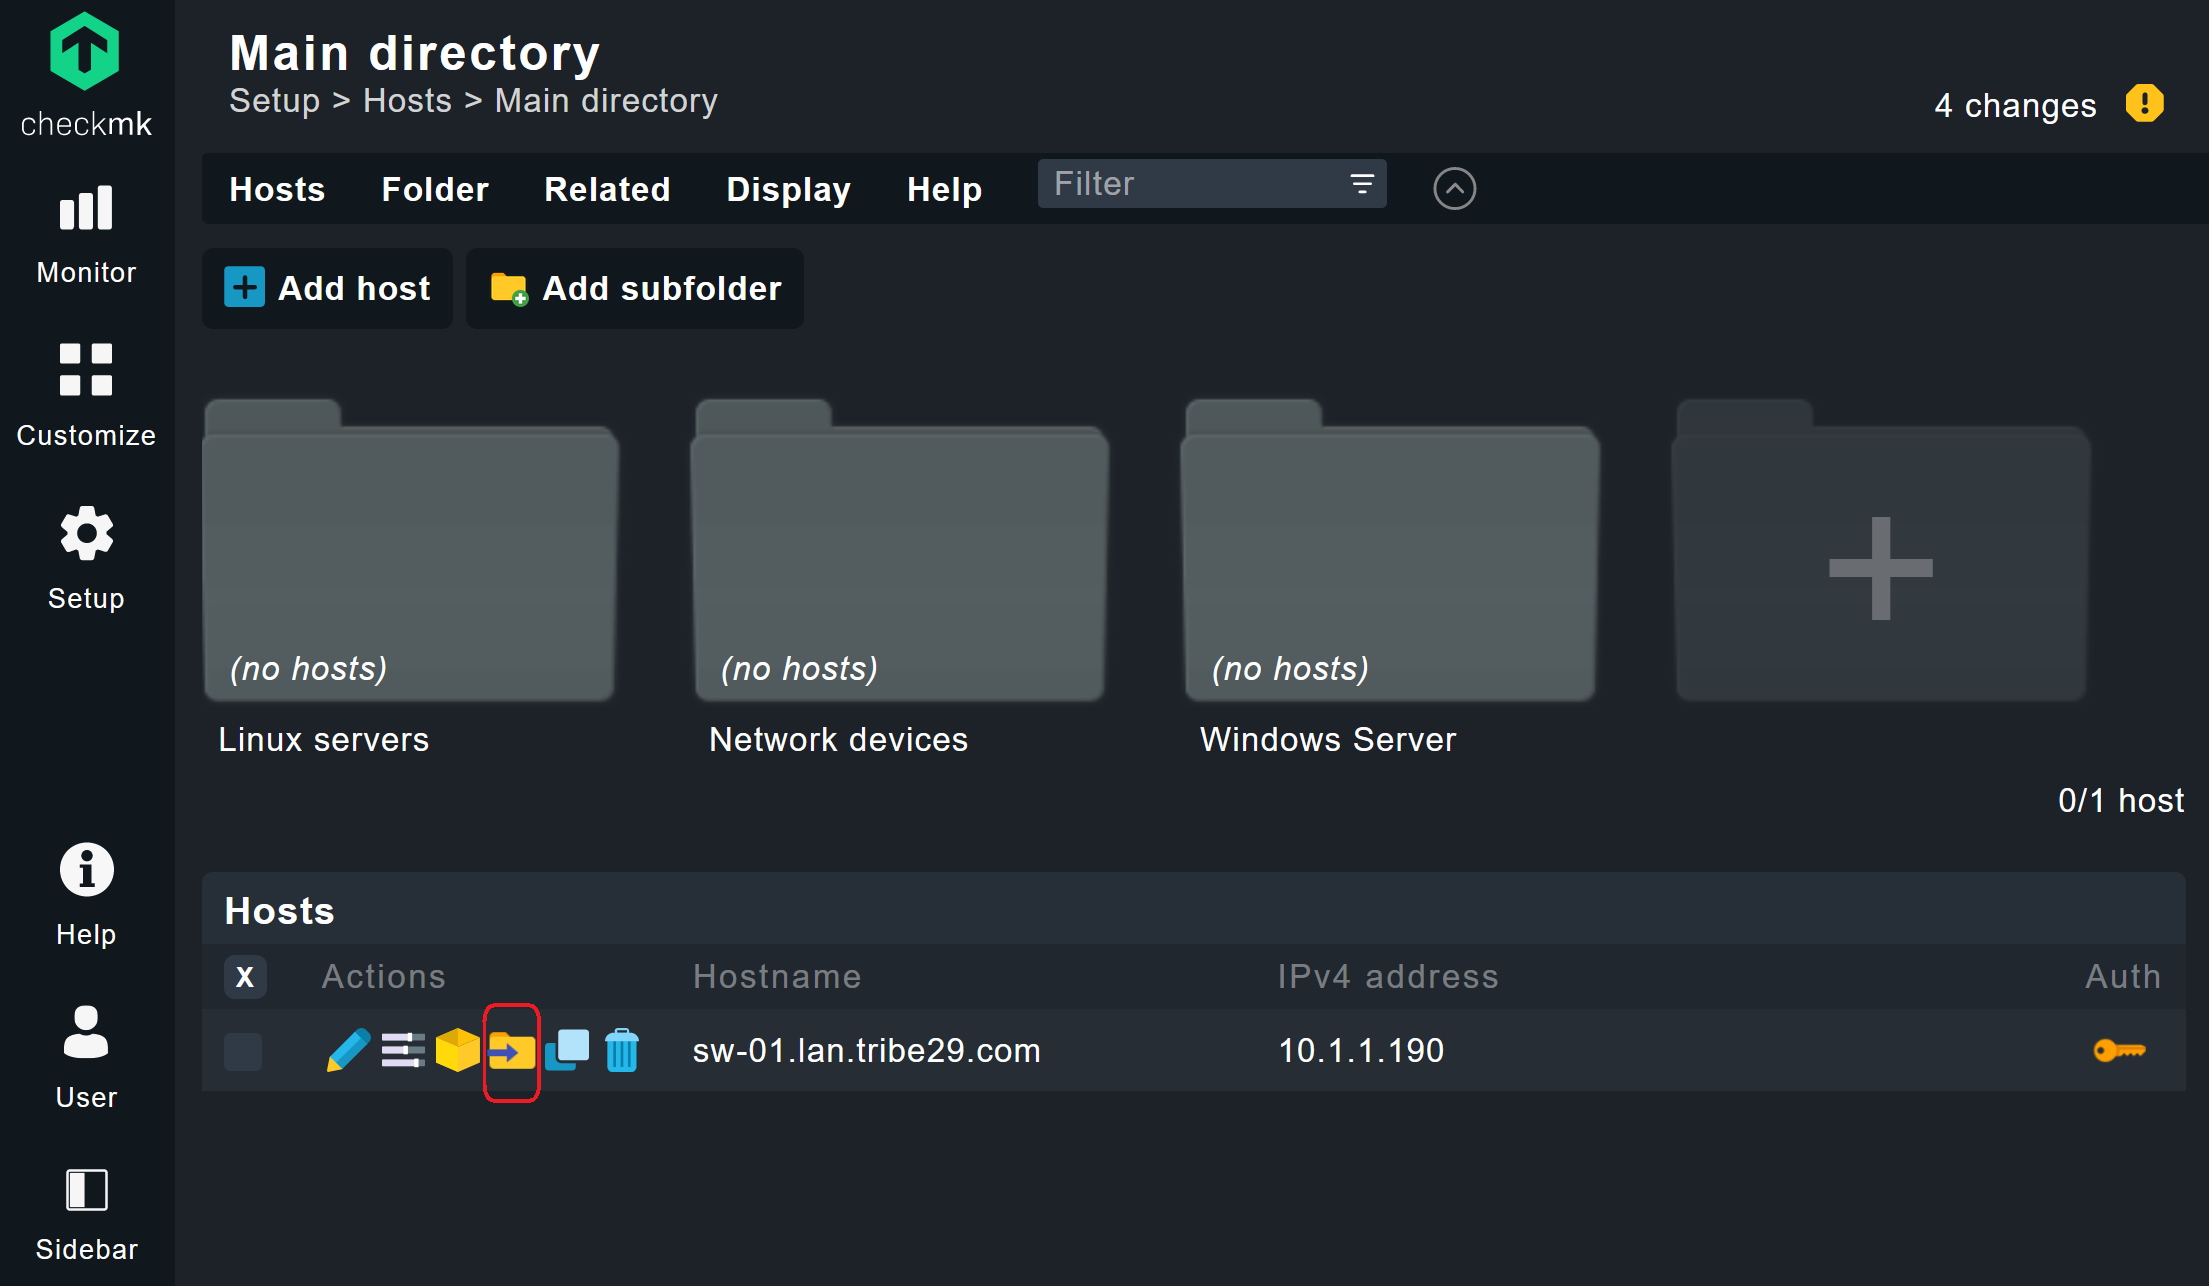
So, I have set ‘No agent’ and ‘SNMP v2 or v3’ as DATA SOURCES for my ‘Network devices’ folder, just as I previously did for my Cisco switch. In the future, I can then place my network devices into this folder during host creation and will no longer have to make any further configurations. In addition, you can assign existing hosts to the desired folders in the Main directory via the folder symbol with the arrow. I moved my Cisco switch directly into the folder.
Do not forget to accept the changes. You can easily build templates using the folders, so that you can later import a large number of hosts into the monitoring with just a few clicks. Checkmk also supports Bulk imports of hosts via CSV lists or automated scripts via the command line. However, it makes sense to include the first hosts in the monitoring via the GUI in order to gain experience with Checkmk.
In addition to the folders, with Labels and Tags Checkmk provides good functions for easily managing large monitoring environments with a large number of hosts.
Installing Checkmk agents on systems to be monitored
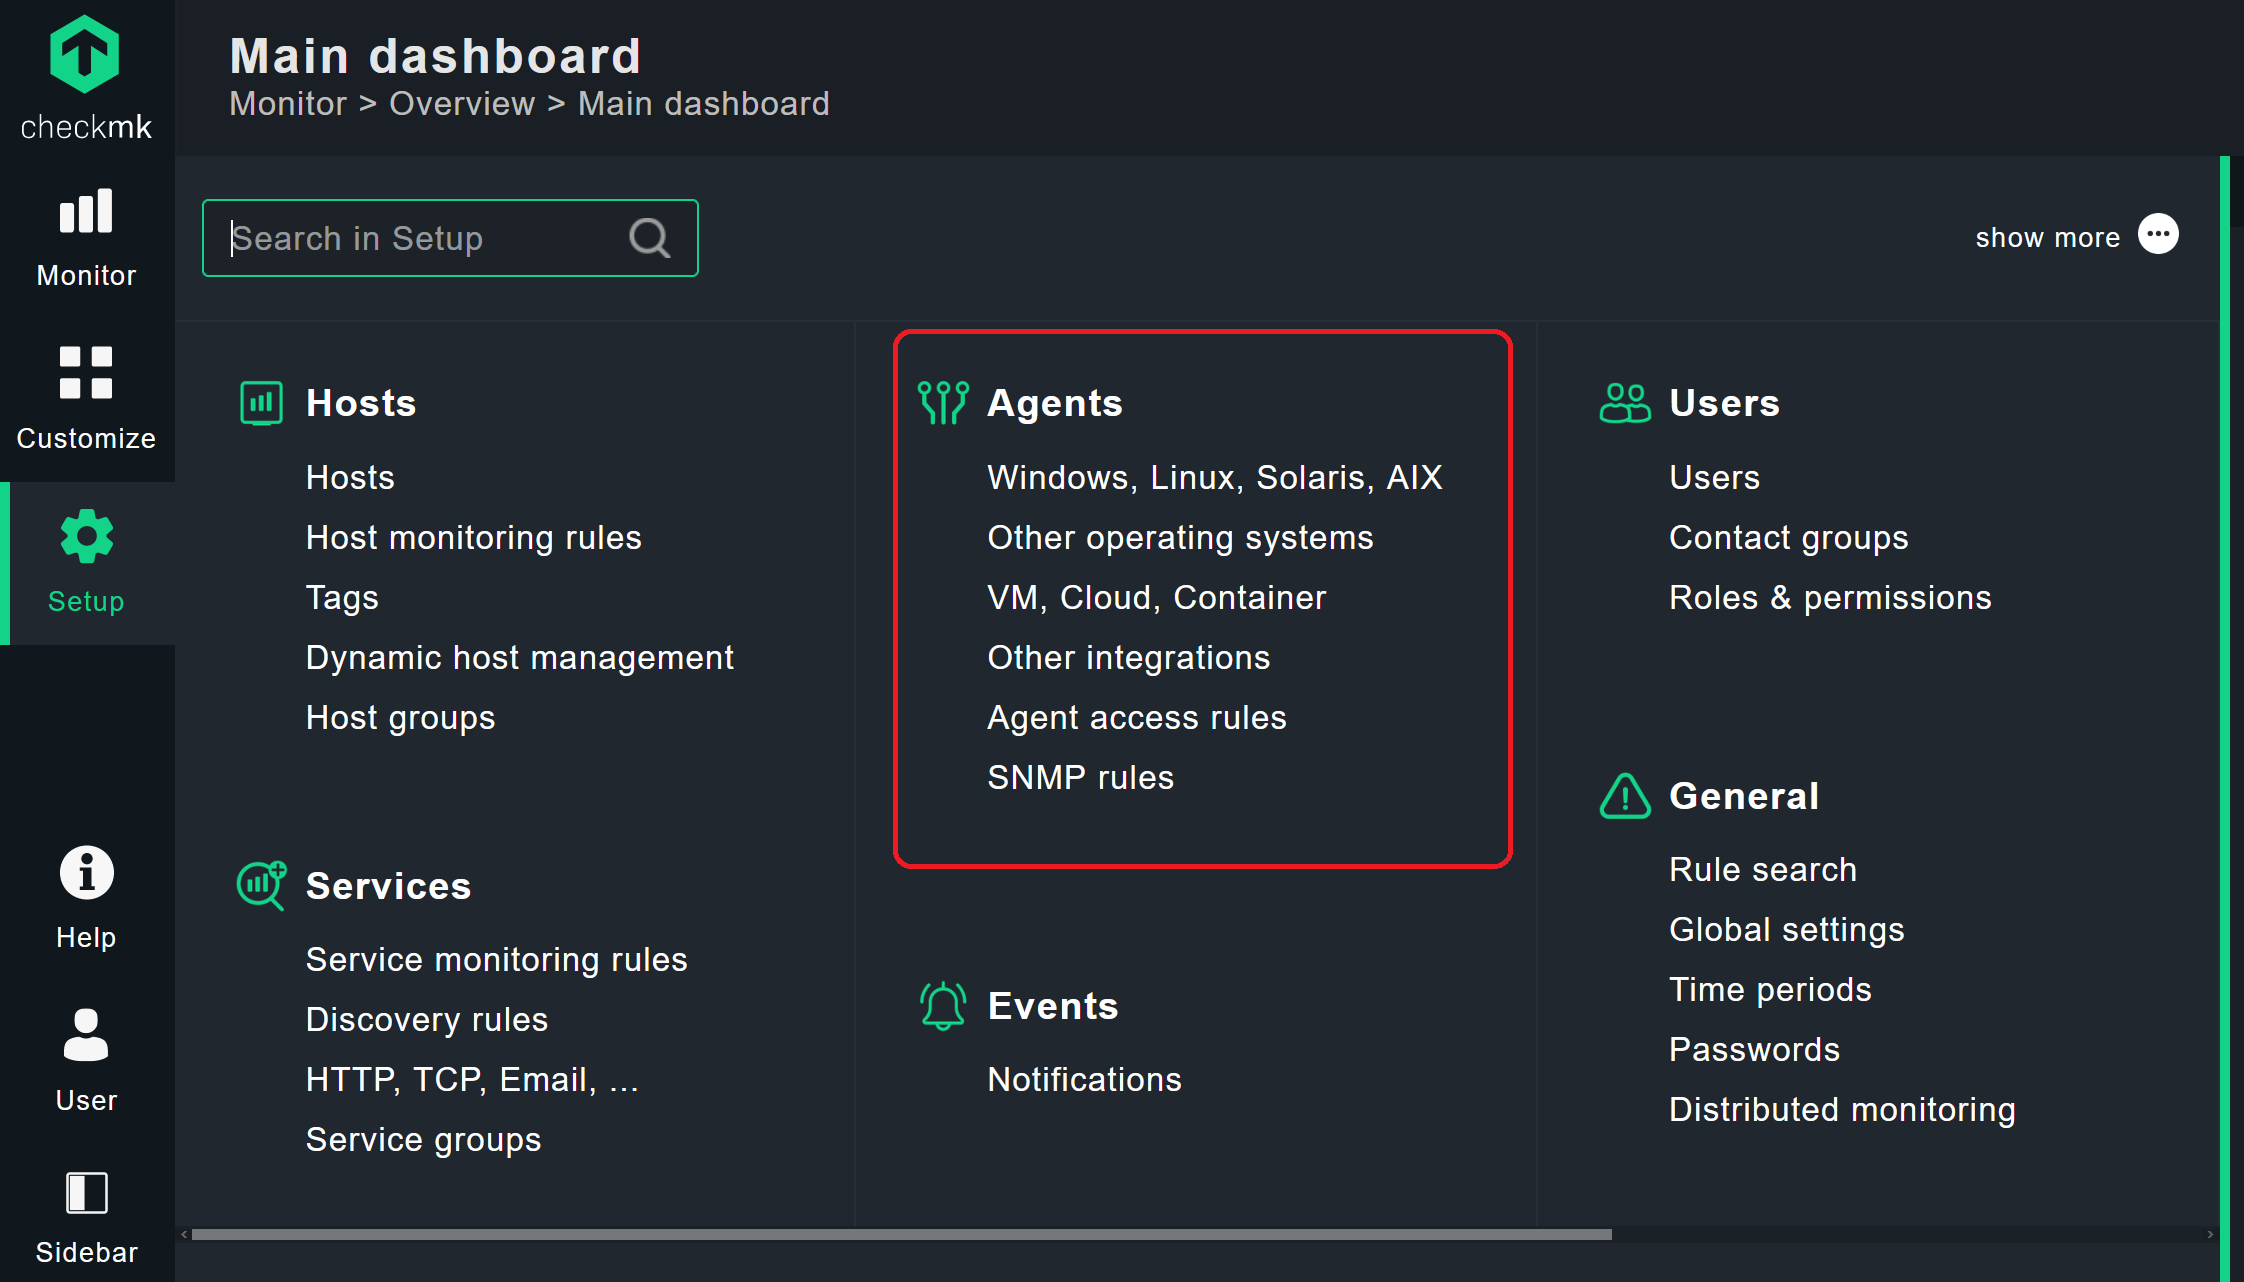
In the next step, you should provide your hosts with the appropriate Checkmk agents. To do this, you need root access to the systems. In Checkmk Raw, the agents are located under Setup ➳ Agents.
In my monitoring I have three servers that I want to monitor via agents — one production Linux and one Windows server, as well as my monitoring host system. For the Linux systems, I log in as root and install the corresponding agent package. On the Windows server, I execute the MSI file locally and install the Checkmk agent as a Windows service. In my example, I have thus ensured that i can pull the data from my servers using the Checkmk agents.
In the manual you will find detailed instructions on how to install the respective agents on your server platforms. Agent plug-ins are also available for many other systems for further in-depth monitoring. Since Checkmk extensions usually provide more information with less resource consumption, it is worth replacing old Nagios plug-ins with corresponding Checkmk plug-ins.
Also note that the Checkmk can also be extended with local checks. You can convert Nagios plug-ins into local checks for Checkmk. If there is no official plug-in for a system, you can adapt existing extensions from other monitoring tools to conform to the Checkmk guidelines. Many of our customers successfully implement this in practice. Please note, however, that tribe29 cannot guarantee support in this case.
Including systems as hosts in the monitoring
Once the agents are running on the systems, we will now be able to include those systems in the monitoring. For my small Nagios system and to introduce the principle, we will do this again via the GUI.
We'll start with our monitoring server localhost. Go to Setup ➳ Hosts again, open the corresponding folder and create the host with Add Host. Enter ‘localhost’ as the Hostname. This is already sufficient — you can leave the other fields blank. Without adjusting the host settings on your part, Checkmk always assumes that you want to monitor a host via the agent. So, I only need to enter the host name correctly and to have a reasonable name resolution in my network.
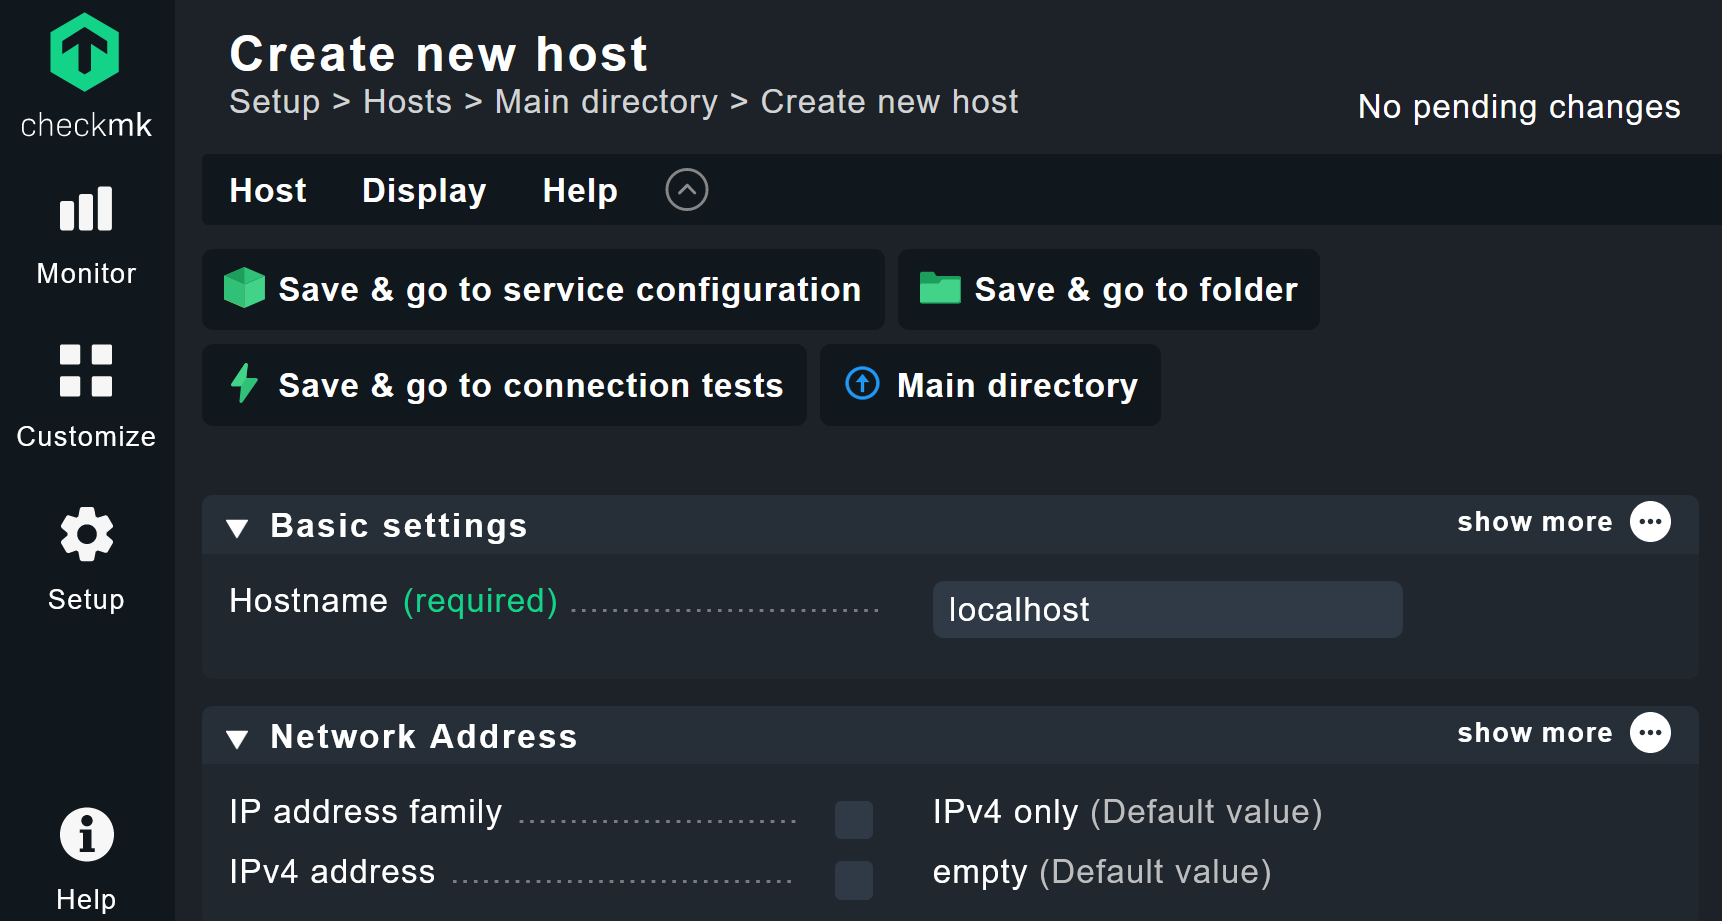
Click again on Save & go to service configuration to start the automatic service discovery. The remaining steps are identical to those used for monitoring the switch.
Don’t forget to accept the changes again afterwards. This is exactly the procedure that I used to add my localhost, my Windows server and my other Linux server.
Configuring host groups, users and other alarms
Checkmk naturally also provides the option of managing hosts and users in groups. There are also numerous alerting mechanisms. As already mentioned on the subjects of labels, tags and folders, these often go beyond the capabilities of Nagios and can be combined as desired.
More importantly, you no longer have to do this via the command line, instead you can perform it conveniently in the user interface. So, forget working with Nagios objects that you had to laboriously define using config files. Instead, you will find precise instructions in the Checkmk manual and can simply search there for the desired items such as user administration and alarm management of the hosts.
At this point, I have again created my six users in three contact groups, including contact details. I also quickly recreated the host groups. It’s up to you how you want to set up your Checkmk, but with the help of the manual, it’s relatively easy to customize Checkmk to your liking. Once you have configured your monitoring according to your wishes, you can complete the migration.
Completing the migration
You are nearly finished at this point. However, you are now monitoring some systems twice. Especially with my switch, Nagios and Checkmk are now accessing the SNMP agent. I have therefore switched off my Nagios instance and recommend you do the same. You can also delete the old Nagios agents from your hosts. As expected, Checkmk has found more services. Under Nagios there were 24 services, now there are 107, without the need for any manual configuration.

As mentioned earlier, this is really only one of several options for migrating away from Nagios. For very large environments, it may be worthwhile to migrate hosts all at once via a script from the command line. The Checkmk Livestatus interface can do this by reading data on all Nagios objects from your Nagios environment. However, it is relatively easy to create hosts with Checkmk, so the approach described here is usually safer and easier.
Your exciting journey with Checkmk has only just begun. As a Nagios user you will no doubt find your way around easily and I am sure you will not miss Nagios. As well as the Checkmk manual, you can attend a Checkmk training, or post in our forum if you want to go deeper or if you have any further questions.
Happy Monitoring!
