Checkmk as an alternative to Nagios
Replace your Nagios monitoring with Checkmk’s modern IT infrastructure monitoring and benefit from a powerful and highly-scalable monitoring solution that can also integrate your cloud and container environments.
Go with the time, go with Checkmk
Nagios was once an important standard solution for IT monitoring – however the IT world has changed a lot over the years – and Nagios has not. As a result, Nagios no longer meets the requirements expected from a modern IT monitoring – the configuration of individual systems is complex and monitoring with Nagios is not sufficiently-scalable. Further, the learning curve for Nagios is far too steep considering the little added value that the outdated tool delivers. In today's increasingly dynamic IT environments, monitoring has to be able to react flexibly and automatically to new challenges – and it needs to be easily scalable too.
To ensure that IT monitoring does not become a brake on the further development of your IT infrastructure or that you have to accept any potential blind spots in your monitoring of new IT assets, there is no way around the need for a more modern alternative. Checkmk is such a Nagios alternative because it allows for an easy migration from Nagios and offers numerous other advantages, such as:

-
An easy and fast installation of the software on diverse platforms or in a Docker container. No additional databases or web servers are required.
-
The capability of transferring all objects such as hosts, host groups and users from your existing Nagios monitoring to Checkmk.
-
Increased automation – for example, through the auto-discovery function, which automatically detects all services and also autonomously suggests metrics and thresholds for all relevant components.
-
An easy migration of existing Nagios plug-ins into a Checkmk monitoring.
-
Centralized configuration of the monitoring environment via Checkmk's web-based GUI – no experience in using the command line is required.
-
Scalable monitoring distributed across hundreds of sites and millions of devices, all manageable from a central master instance.
-
A centralized management of agents as well as automated updating via the Agent Bakery.
-
Modern monitoring concepts for monitoring cloud-native, volatile container environments and on-premises architectures.
-
Integration with enterprise business applications such as ServiceNow, Jira or Slack.
Some of the vendors we support
Reduce your time and effort spent on maintaining the monitoring

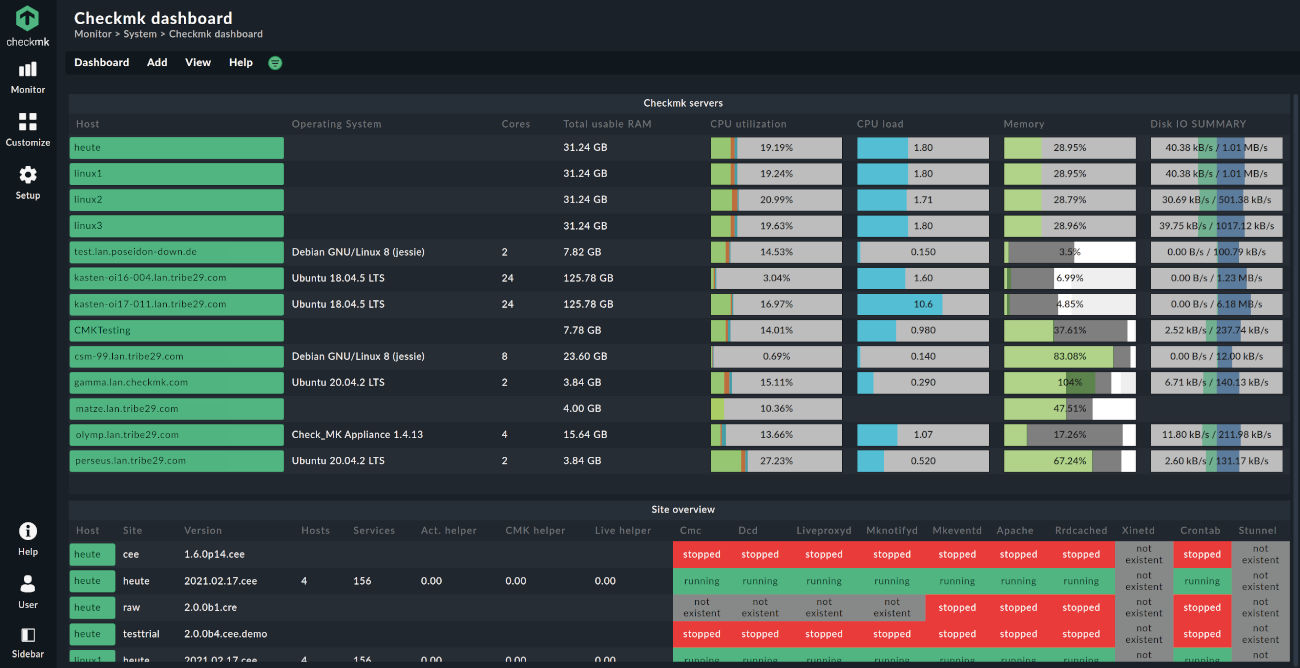
Not only can Checkmk be installed within minutes, it can also be configured with little effort. In addition to automatic detection and configuration of components, Checkmk suggests the necessary metrics and thresholds for the monitoring. A rule-based 1-to-n configuration noticeably reduces monitoring overhead, even in complex IT environments with thousands of hosts.
With Checkmk, the administration of your monitoring environment can be conveniently handled centrally – even across multiple locations – via a web-based GUI. Manual and therefore error-prone editing of configuration files is no longer necessary. The auto-discovery function identifies all services for your monitoring – you no longer need Linux knowledge for this. Checkmk not only has more than 1,900 plug-ins, but it also includes agent-based monitoring with automated, centralized agent updates via the Agent Bakery.
An open source Nagios alternative with an active user community
Checkmk has been available as an open source project since 2007, and from the beginning it has been developed together with the open source monitoring community. Checkmk is built on the basis of the Nagios core. Furthermore, Checkmk uses similar monitoring concepts to Nagios, i.e. it also uses hosts, services, availability status, schedulable downtimes, notifications etc. It is additionally possible to migrate your self-developed Nagios checks to Checkmk without any problems – no matter if it is an active check or if you use NRPE. In general, however, Checkmk will almost certainly provide a better alternative to Nagios. Read more about how to migrate from Nagios to Checkmk.

Checkmk has a large community and actively promotes its growth with community events and our forum. In addition to the official plug-ins, our users share and rate their own extensions on the Checkmk Exchange. For us, collaborating closely with our community is a foundation for successful monitoring.
Checkmk Community is fully open source and unconditionally free of charge. For organizations which need to monitor large environments we also have Checkmk Pro. It has a newly-developed monitoring core (the Checkmk Micro Core), which is significantly more powerful and thus has been optimally designed for use in larger environments. The Checkmk Micro Core supports your existing Nagios checks in addition to the Checkmk checks.
Highly-scalable monitoring with Checkmk
Checkmk Pro’s high-performance Checkmk Micro Core allows you to monitor thousands of services with a single monitoring server. This frees you from the need to maintain and synchronize multiple monitoring instances. Checkmk Pro is not only scalable across hundreds of sites and millions of devices, but it also supports a globally distributed architecture.
Checkmk’s highly efficient monitoring agents can run on even the smallest servers thanks to their low resource consumption. With 12 cores and 64 GB RAM, for example, 400k services can be monitored with Checkmk. Thanks to its more than 1,900 included plug-ins, Checkmk also supports thousands of devices from a wide range of manufacturers, which enables a straightforward configuration.
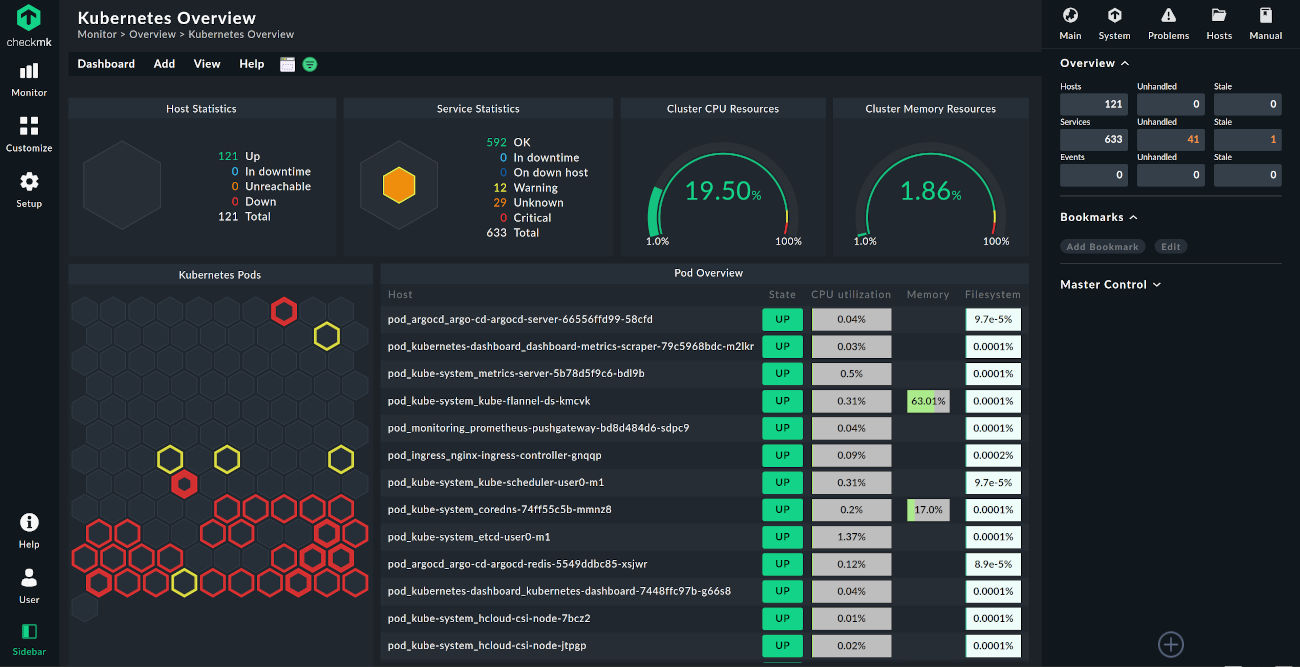
Consolidate cloud, container and infrastructure monitoring into a single tool
Checkmk is not only suitable for monitoring physical infrastructures, it can also provide you with an overview of your cloud, container or Docker environments. With Checkmk, you are able to collect all relevant data for monitoring your IT assets – both in centralized and highly distributed infrastructures – and integrate them centrally into a single tool. For example, metrics and events can be combined with a state-based monitoring to identify problems and so be able to resolve root causes at an early stage.
Great reasons to replace Nagios with Checkmk as your monitoring tool

Easy switch from Nagios to Checkmk
Migrate your Nagios environment to Checkmk with little effort – no experience with Checkmk needed.
Modern infrastructure monitoring
Checkmk supports cloud assets and container monitoring. Thanks to the integration with Prometheus Checkmk is also suited for DevOps.

Highly scalable
Checkmk is extremly scalable and you never lose the ability to administrate your monitoring from a central point.
Support of Nagios plug-ins
Checkmk supports all Nagios plug-ins and also comes with +1,900 official integrations that are ready for use, including agents for systems such as Linux, Windows, or macOS.
I am always surprised by how easily Checkmk can be used in day-to-day operations. Especially if you are familiar with other open-source tools, Checkmk is a boon. The administration of hosts is really simple.
Trusted by global brands and local organizations worldwide


Resources
Ready to explore the full feature set of Checkmk?
Download the free trial and see it in action.