Monitoring your network: Four rules to rule them all
 on Jan 30, 2020
Monitoring networks can be a painful task. However, by using the right tools, you can also set up a holistic monitoring easily and discover issues in your network, you likely didn't know about before.
After reading this blog, you will be able to focus on actually fixing issues or drinking coffee instead of configuring your monitoring. I will share my approach to network monitoring from 20+ years experience as a network specialist in the hope that you will spend less money on external consultants trying to fix the wrong things, and instead discover where your real bottlenecks and performance problems are.
Note: This post is based on Checkmk 1.6. If you use Checkmk 2.0 and want to set up a holistic network monitoring, you find all information in the blog post 'Network monitoring with Checkmk: 3 rules to rule them all'.
Keeping track of all interfaces of your switches without being overwhelmed with false alerts can be challenging. There are a few tricks to adjust your automated network discovery and alerting, so you end up with a comprehensive overview and don't have to spent too much time on getting your network monitoring started.
Often performance problems are based on network issues and if worse comes to worst, companies do not have a network monitoring in place that would help them to mitigate these issues. You end up with admins and consultants wasting hours trying to fix a problem at the wrong place and organizations suffering serious losses because of under-performing networks.
No matter, if you consider your network infrastructure small or large, it's a good idea to monitor all interfaces in your network. Only that way you can discover problems like broken patch- and installation cables, dirty fiber optics, defective firmware and configuration errors like duplex mismatches. You might think that this is not the case in your network, but maybe you just did not find these problems yet.
Making that happen in reality can be tricky, because there are a lot of ports and sysadmins already have a lot of things on their plate anyway. Just doing a port scan usually will not work. For instance, access ports (ports with an end-user) will go offline, if they switch the connected computer off. By default, this leads to a false alert in most monitoring tools, because it is totally fine, if an end-user turns off their computer. Also, there is no way, you can look into every port and manage them individually
This blog shows you a simple way on how to set up Checkmk to get your network monitoring on the road. It takes a few preparations around naming your ports within your switches and only four rules within Checkmk. All the steps will be explained in more detail below. This is just a suggestion and there are other ways, of course. In case you get stuck or you think there are alternative ways, we hope that you share your experience in the comment section or our forum.
In the end, you should have a complete view and only get alerts, when it is really time to act.
Setting up your network: Name important ports
Before we can start to work with rules to improve the discovery and the monitoring, it is important that you have a name concept in place for your network interfaces that allows you to distinguish between access (for end-users) and non-access ports.
This is not just handy for the people looking at the ports in the dashboards, because they can then make better sense of the data. But is also necessary to automate the differentiation between ports in your monitoring, so that i.e. alerting can be handled depending on port type.
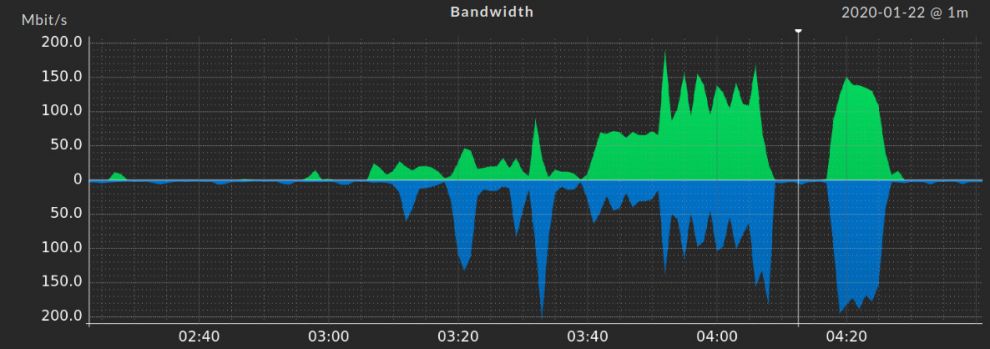
By default, ports do not have names. Instead, you will typically see a list of interfaces that contain numbers or technical descriptions, similiar to the examples here:

This alone is not yet suitable to apply granular rulesets to configure your monitoring and is also the reason, why it is hard to find the important ports through any kind of Auto-Discovery with Checkmk. So, before you can start with proper monitoring, you need to prepare your network.
First thing to do is to name the most important interfaces within your network devices. Name them in a human-readable way, for example. “Uplink core3”, “esx1-vmnic3” or “Uplink MPLS 10 Mbit”. You can also name them based on a purpose or a location like "Uplink Berlin". But stay as consistent as possible. It is also important that the name does not contain just numbers (letters plus numbers are fine), otherwise the rules we create will not work. I explain the details later on in the text.
Keep in mind that you are also naming them for rules you will use later:
- Every named port is considered important: State- or Speed changes are monitored. Error thresholds are imposed.
- Every port that you leave unnamed will be treated as an access port. We will only monitor Errors for these ports and ignore State- or Speed changes (so it can go offline without creating an alert).
You can set the names in a switch directly, e.g. for Cisco by the description command in the interface context or for HPE/Aruba with the name command.
This sounds like quite some preparation, but it will be worth it, because your important ports will then be documented. If something happens, you will know which device is affected. Network documentation with live monitoring on top of it!
Once you prepared your ports, it is time to configure the monitoring. The steps until here are helpful for every network monitoring — from now on, we will focus on how to easily set up a complete network monitoring with Checkmk.
Implementing the Network Monitoring: Four rules to rule them all
If you tried setting up a network monitoring just with the Auto-Discovery function of Checkmk, you will get a list of all Ethernet ports that are currently online. Then, Checkmk monitors these ports (and really just them) on the State, Speed and Error rate and will alert you, in case that these values change. As mentioned, not all of these ports will stay online forever and will then cause alerts. These are potential false-positives and these will only make people start ignoring the alerts from your monitoring.
The following five steps will guide you how to set up a holistic network monitoring within Checkmk with only four rules. After that you should have an overview over your network and only get alerts, if something is really wrong.
Step 1: Differentiate between Description and Alias by creating a Tag
Unfortunately SNMP allows for two tables for interface names: description and alias. It is vendor and sometimes even device-specific, which table is used. In the preparation part, we have already set the important interface names either using the description or name command, other vendors may have even different commands or even just a GUI to do the same thing. Now we need a way to tell Checkmk which table needs to be used for a host. I use a host tag as a virtual light switch to select either the alias or description table. Using a host tag it allows us not only to tag single hosts, but also complete folders. So expanding and adjusting will be easy.
- Open the Web Administration Tool (WATO) module Tags and create a New tag group. This group will later help us in step 5 with switching between the Alias and Description table of your network devices.
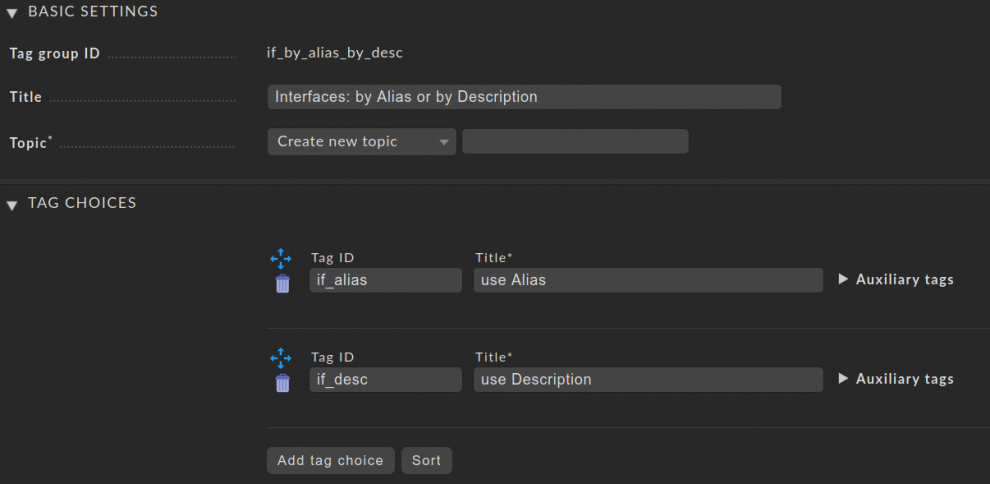
- In the Basic Settings choose "if_alias_desc" as Tag group ID and set "Interfaces: by Alias or by Description" as Title. Leave Topic as it is.
- in the menu Tag Choices click twice on the button Add tag choice to add the two fields. For the first Tag ID write "if_alias" with the Title "use Alias", and for the second use "if_desc" as Tag ID with the Title "use Description". This allows you to tag your switches (or better the folders) as needed. It should look something like in the screenshot below.
- Save the tag, accept the changes in Checkmk and you should see the new Tag if you click on Tags in WATO under Tag groups.
By defining "if_alias" as the first tag choice, Checkmk will by default use Alias as a tag - this is great as most hardware vendors use the Alias table.
Step 2: Discover and monitor all network interfaces and ports
Now it's time to set up two new rules that are very similar to each other. I start with creating a rule for handling the interfaces using the Alias table as source for the interface names.
- In WATO ➳ Host & Service Parameters, enter Network Interface and Switch Port Discovery in the search bar there to find the rule you need. You should find it under Discovery - Automatic Service Detection. Click on Network Interface and Switch Port Discovery.
- In the new page click on Create rule in folder: Main directory. Now you can configure the required rule.
- Use the comment field as needed for your documentation purposes. Also, you can copy the URL to this article into the Documentation URL field.
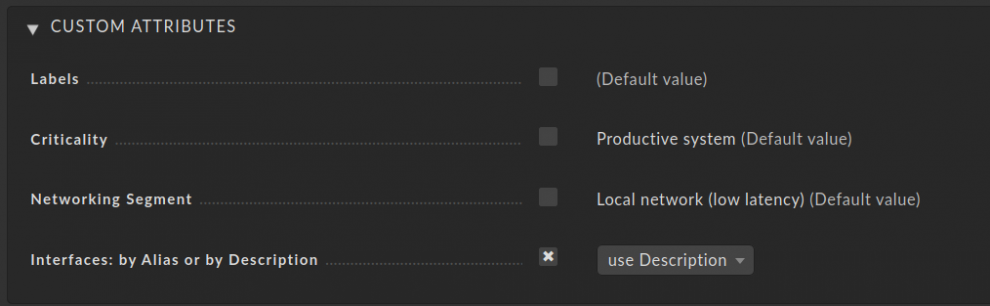
- Activate Appearance of network interface and choose Use alias.
- Tick the checkbox Network interface port states to discover. Activate all available options except for 9 - admin down. This way all port states are included. But why not option 9? Well, it has some drawbacks which would go way beyond this article, but luckily it is not needed for the concept shown in this article
- Activate Network interface port types to discover below and enable all available to make your monitoring complete (move all from left to right).
- In the Conditions section choose for Host tags the previously created Interfaces: by alias or by description, click on tag condition, and choose is and use Alias.
- Finally, save this rule.
It should then look like this:
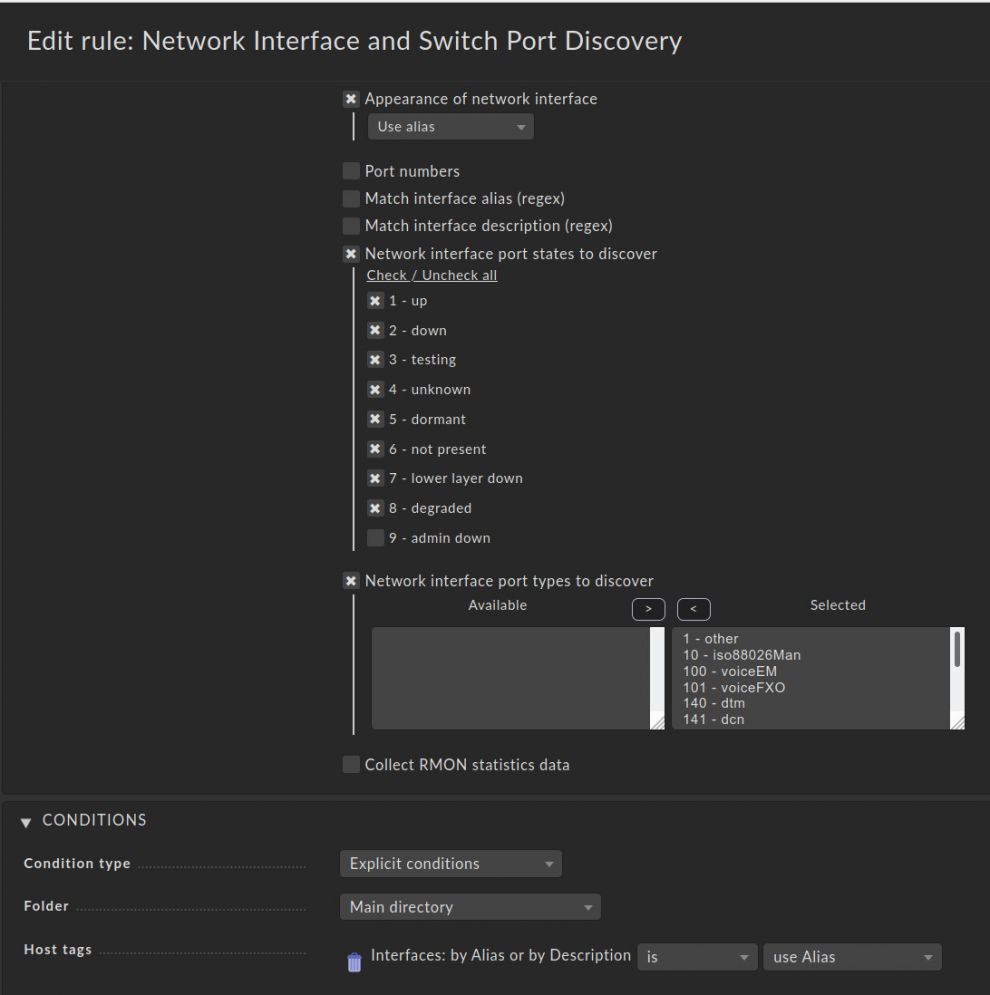
This way you monitor all ports in your network, even when they are offline. This rule however only applies to devices that have the Host tag "use Alias" set - which is our default.
Next, we need a similar rule for the network devices that provide the interface name in the description table. For this, you can simply clone the previous rule and modify it a little bit:
- After you saved the rule in the step above, you will be in the rule overview. Here you can clone the first rule from above by clicking the clone button

- You only need to modify the host tags condition to use Description instead of use Alias. Under Appearance of network interface you need to choose Use Description as well. The rest can stay the same.
- Save the rule.
After that, you are done with a complete monitoring of your ports, and we only need to handle the access ports.
Step 3: Monitoring your Access Ports
I strongly recommend including the access ports into your network monitoring. However, ignore State and Speed changes on your access ports, and only monitor the Error rate. That way you will not receive any notifications from your monitoring, if someone turns off their computer. But you will still get informed, in case there are errors on a port. That can be an indicator for a broken cable or another issue and you should have a look into it.
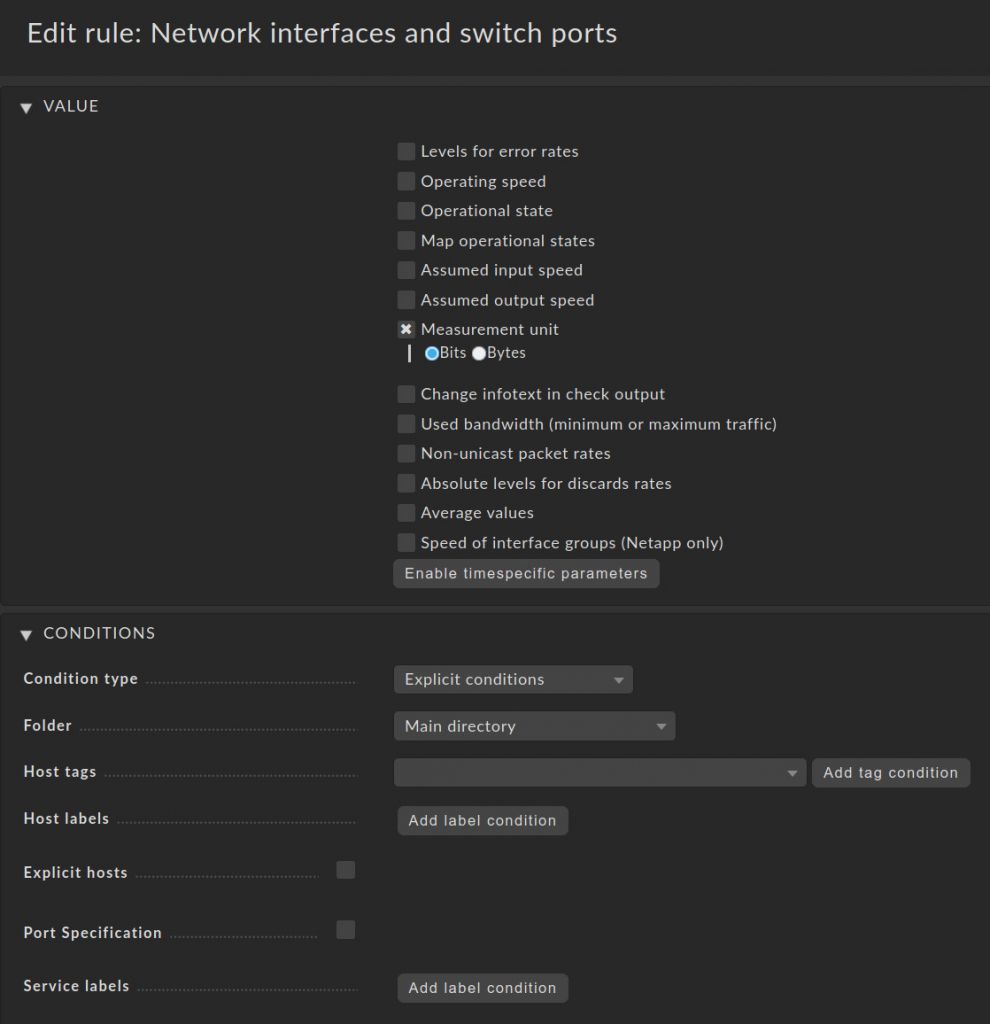
For this, we create the third rule for our network monitoring. As before, in WATO go to Host & Service Parameters. This time search for the rule Network interfaces and switch ports. You should find it at the lower end under Networking. Click on it and create a rule in the Main directory with the following configuration:
- Use the comment field as needed for your documentation purposes.
- Under Values, enable Operating speed and select ignore speed in the menu.
- Just below it, enable Operational state and set it to Ignore the operational state.
- Go down to Conditions and set the Port Specification to: \d+
- Save the rule.
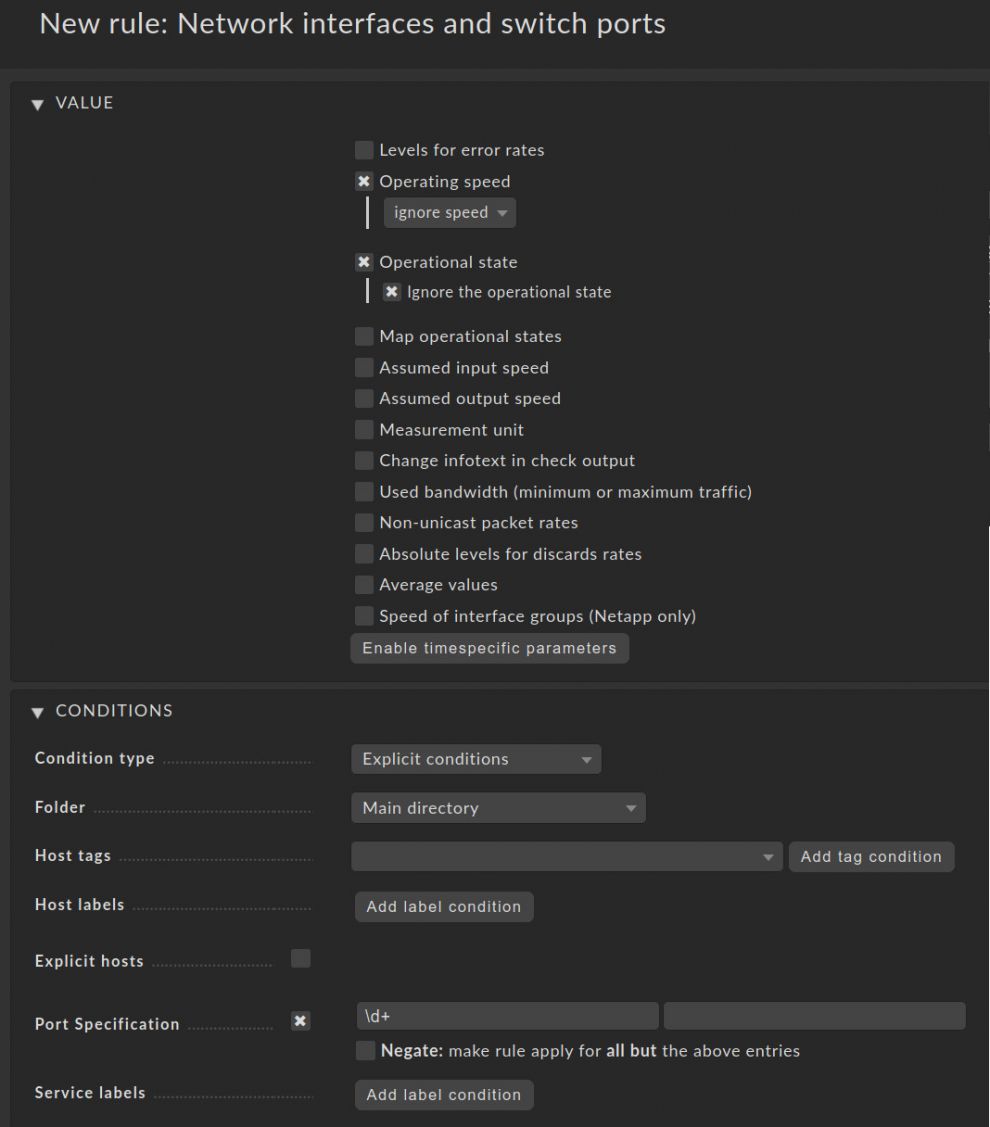
And here comes the magic! In the condition, we are using a simple regular expression to identify the access ports. \d+ will match for all interfaces that just contain numbers and do not have letters in them. Only our unnamed access ports will be affected by the condition as they typically only consist of numbers. That's why it is important to have a proper naming scheme, because this way you can easily identify and handle access ports.
This trick works most of the time. But some vendors use technical naming schemes instead of just an index number. In those cases, you can add further appropriate regular expressions to the Port Specification field as needed. For example, if a vendor names their interfaces "GigabitEthernet 1/0/1", the regular expression GigabitEthernet will match all interfaces, which start with "GigabitEthernet".
Step 4: Show the right data for network traffic
Normally network traffic is measured in bits per second. But a long time ago a Checkmk developer decided, that bytes per second is the default way to go. We consider changing that sooner or later.
We have to address this here with our fourth rule:
- Add another rule for Network interfaces and switch ports (yes, same ruleset from before under Networking).
- You can leave all things empty. Only set Measurement unit to Bits. Don't set any condition.
- This way you create a global rule for your monitoring. Global means that it is located in the main directory and will always be the last rule, which Checkmk handles.
- Save it. This was the last rule!
Step 5: Configure your Folders or Hosts to use Alias or Description
As a last step, you can now use the tag from the step 1 to configure your hosts (or more efficiently the Folder) to tell Checkmk, which hosts use Alias or Description for the naming of their network interfaces.
We have set use Alias as the first value in the tag group, this is the default. Look at some hosts in your monitoring (you might have to run a service discovery) to see, if you get the information you expected. In case you will just get interface numbers, you probably should switch this host or folder to use Description instead by using the tag from step 1. You can put all network devices into one folder as a host inherits all attributes from its folder. Thus, the host tag is getting passed on to all hosts in it and you do not waste time by handling each host individually.
You can group your hosts in Checkmk into folders. By this a host inherits all attributes from its folder. Thus, the host tag is getting passed on to all hosts in it and you do not waste time by handling each host individually. Normally it makes sense to choose a folder structure on a per device-type base.
After you adjusted the devices to the matching tag choice, (re-)discover your hosts. Ideally you have now a long list with interfaces.
Please note that status okay of unnamed Access Ports does no longer mean that a port is online, as we only monitor error rates on these ports.
Monitor your whole network within minutes
This blog demonstrated a way how to monitor your network and include all ports. As a result, you should have an efficient and complete view over your network and all interfaces. Also, you will only get the alerts that matter. All this is based on naming your important ports and a few rules within Checkmk.
There are a few challenges along the way, of course — every IT is different. But these four rules have helped me discover many problems in networks, which no one knew before about. Not having to handle Alias and Description separately would be an early Christmas present for me — but everyone who deals with SNMP knows it is a necessary evil.
The preparation seems a bit over the top in the beginning, but a naming scheme is a real benefit and help you with many issues. For instance names like “Uplink MPLS 10 Mbit” can be used for further bandwidth usage thresholds, but that is not part of this article.
In case you got stuck or you find a better way, we are happy to hear your opinion. Let us know about your experience.
And a last word about error rates: Don’t change the build in error thresholds of 0.01 and 0.1 percent. They will show you issues that you weren’t aware of before. If there are errors: Track them down and fix them! There is only one reason to increase the threshold: WLAN Access points as WLAN is a shared medium. Shared with the neighboring access point, the microwave and solar flares. So here it can make sense to increase the threshold.
Happy monitoring!
