How to Set Up Comprehensive SQL Server Monitoring
Today, most desktop, mobile, cloud, IoT, and other applications rely heavily on databases. To support these, SQL server deployments, capacities, and workloads have continued to grow. As this happens, businesses need to ensure that the data systems are meeting the required performance requirements.
Usually, customers and users demand high availability, effective services, and fast fixes whenever there are issues. Towards this, SQL server monitoring provides valuable insights into the server health, performance, and usage metrics.
TL;DR:
Monitoring SQL servers is essential for ensuring high performance, availability, and efficient resource use.
- It provides insights into server health, identifies performance bottlenecks, and helps prevent costly downtimes.
- Key components and metrics, from CPU and memory usage to query performance and indexing, guide optimization decisions.
- Continuous monitoring allows proactive planning for future growth and resource allocation while reducing infrastructure costs.
- Effective solutions like Checkmk simplify data collection, provide actionable insights, and support multi-database and cloud environments.
What is an SQL server?
SQL (Structured Query Language) is a query language that is used in relational databases. It is the language that writes the queries to manipulate or retrieve data from the relational databases.
An SQL server is the relational database management system (RDBMS) tool or software such as Microsoft’s MSSQL, Oracle DB, and PostgreSQL that stores, processes and manages data.
Additionally, the server executes the SQL queries and commands to manipulate the relational database. In practice, the SQL server will host the database and the SQL applications, while it also performs and manages all the database operations.
What is SQL server monitoring?
SQL server monitoring is the continuous or real-time gathering and analysis of performance, resource utilization, usage, and event metrics of a database server.
In addition to identifying performance problems, inadequate or underutilized resources, and other issues, it provides insights that admins can use to fine-tune and enhance the performance. An ideal and effective monitoring tool should also send alerts whenever monitored metrics cross certain defined thresholds.
This enables accurate diagnosis and troubleshooting in addition to an immediate response to problems. Further, it shows resource usage and trends over time, hence enabling DBA teams to plan and prepare for the future.

Who monitors SQL servers?
SQL servers are monitored by in-house Database Administrators (DBA), internal or external teams looking after the servers. Generally, any organization with a database server should ideally monitor their systems, regardless of the size.
An organization without adequate in-house skills may engage a third party or outsourced DBA to provide support where necessary.
While the in-house or outsources DBAs have the task of ensuring that the database platform is running smoothly, other departments should also participate. For example, if there are issues with the network, the IT infrastructure team should address them.
Why do you need to monitor SQL servers?
Monitoring any server is a must-do. Therefore, monitoring SQL servers is one of the major activities that help to get a view of the database platform. It provides insights that enable teams to address availability and performance issues, hence preventing costly system failures. While the monitoring goals may differ from one organization to another, below are some key reasons why it is essential.
Provide insights into server health
Gain valuable insights into the SQL server health, performance, and usage metrics. The resource utilization monitoring enables the admins to identify optimization opportunities and determine if there is a need for additional resources. Additionally, teams can use the insights to fine-tune the SQL servers for the best cost-effective performance.
Other than checking if the server is operating optimally, the SQL server monitoring will also identify unusual activities. Determining how the server is functioning provides the opportunity to optimize the performance, address any issues, and identify fine-tuning opportunities. It also helps to determine the requirements to meet future needs.
Minimize performance issues and downtimes
Identify and address bottlenecks and a wide range of issues that could degrade performance or result in an outage. Teams can address the performance issues early and quickly before they result in an outage. Additionally, SQL server monitoring allows the DBA and IT teams to optimize the systems and improve the speed and user experience while preventing outages.
Proactive or continuous monitoring keeps the teams with an up-to-date status of the server. By preventing major problems from happening, the teams have more time to work on more important business tasks instead of fixing preventable problems. Ideally, the SQL server database performance monitoring helps you to keep your SQL server and services running smoothly while reducing the risks of unexpected downtimes.
Plan for future growth
Monitor resource usage and capacity trends to prepare and plan for the future. Besides performance, the monitoring can provide other useful information critical in planning for future needs as the database grows. For example, it can provide insights into a wide range of metrics including storage usage, high-impact queries, resource-intensive queries, buffering pool utilization, and other issues that have an impact on performance.
Reduce the infrastructure costs
The monitoring enables teams to optimize the existing resources, hence reducing the need to invest in additional hardware and software components. This allows you to maximize the infrastructure components and prevent you from unnecessarily investing in more resources.
Optimize wait time and improve service delivery
Increase response times and performance of the SQL server by collecting, analyzing, and taking corrective action. In addition to observing the response times, the monitoring may reveal other useful information such as CPU, memory, or I/O capacity constraints, long wait times, and other metrics. Consequently, this provides you with the opportunity to troubleshoot the server, reconfigure or add more resources, and hence improving the response times.
Ideally, SQL server monitoring is vital for all organizations whether small, medium or large organizations, who are looking for opportunities to improve database queries performance, maximize server uptime, process the queries much faster, and ensure availability and high productivity.
What should you monitor on an SQL server?
Understanding the SQL Server architecture, its components, and how they interact with each other is essential as it guides you on what to monitor. You should also know why you want to monitor a particular metric or service. Additionally, as there are so many things that you can monitor, you should have a goal of what you want to achieve. Otherwise, you may monitor SQL server metrics and services that do not impact the performance and therefore not support your objective.
Key metrics on the software side include but are not limited to wait statistics, index fragmentation, buffer cache, security, etc. Additionally, it is essential to keep track of the software versions and maintenance needs.
The best strategy is to identify the set of metrics that will assist you in achieving your performance goals, and this may differ from one organization to the other. Usually, some common metrics are monitored. These provide adequate information to perform basic troubleshooting and optimization. Some commonly monitored metrics in SQL servers include processor and memory usage, disk activity, and network traffic.
However, for complex systems and advanced troubleshooting, you may be required to monitor additional metrics to observe specific areas and help in finding the root cause of the problems.
Besides the SQL server components, you need to also monitor additional metrics in the operating system. For example, for a Windows server, you can monitor the
- Processor time, processor utilization, and processor queue length.
- Network usage, network interface, user connections etc.
- Paging, page life expectancy, page reads and writes per second, lazy writes, etc.
- Total server memory, buffer cache hit ratio, batch requests, etc.
Key SQL Server Components
A typical SQL server comprises four major components, regardless of whether it is hosted on-premises on the cloud. These include Protocol or Network, SQL server Storage Engine, Query Processor, and the SQLOS (SQL operating system).
The Query processor and storage engine are parts of the database engine, which is one of the major components of an SQL server. In practice, the SQL database engine's main role includes creating and executing stored procedures, triggers, views, and other database objects.
SQLOS – the SQL operating system
SQLOS is a part of MSSQL that coordinates various activities between the SQL server and the operating system. Typical functions include CPU scheduling, memory management, background services, logical I/O, and others. In particular, the background processes monitor the system for deadlocks while also checking the resources and freeing any memory not in use.
Monitoring the SQLOS is essential in ensuring optimal resource utilization and when they are underutilized or require an upgrade. It involves observing metrics such as CPU activity, memory allocation, and others.
Protocol and Network
Network and associated protocols allow users to connect to the SQL server. The speed of connection has an impact on the overall performance and user experience. As such, it is essential to monitor the network traffic to see if there are issues that would degrade performance. This helps to identify signs of any unusual traffic and bottlenecks.
Further, monitoring the protocols is essential in ensuring that they are in order and not reducing the performance and efficiency of the SQL server.
Query Processor
The SQL Server query processor also known as a relational engine comprises various components that manage the query execution. Generally, the query processor will retrieve the data from storage depending on the input query, after which it processes it and provides the results.
Amongst the functions, its performances include managing the memory, buffer, task, query processing, and more. It is also responsible for locking and isolating the pages, tables, and rows for the data the query requires.
The monitoring involves analyzing the queries being processed, the resources they use, and the time it takes. Another area is analyzing the query plans that the server uses to execute the queries. Lastly, there is a need to analyze the rate of generating execution plans.
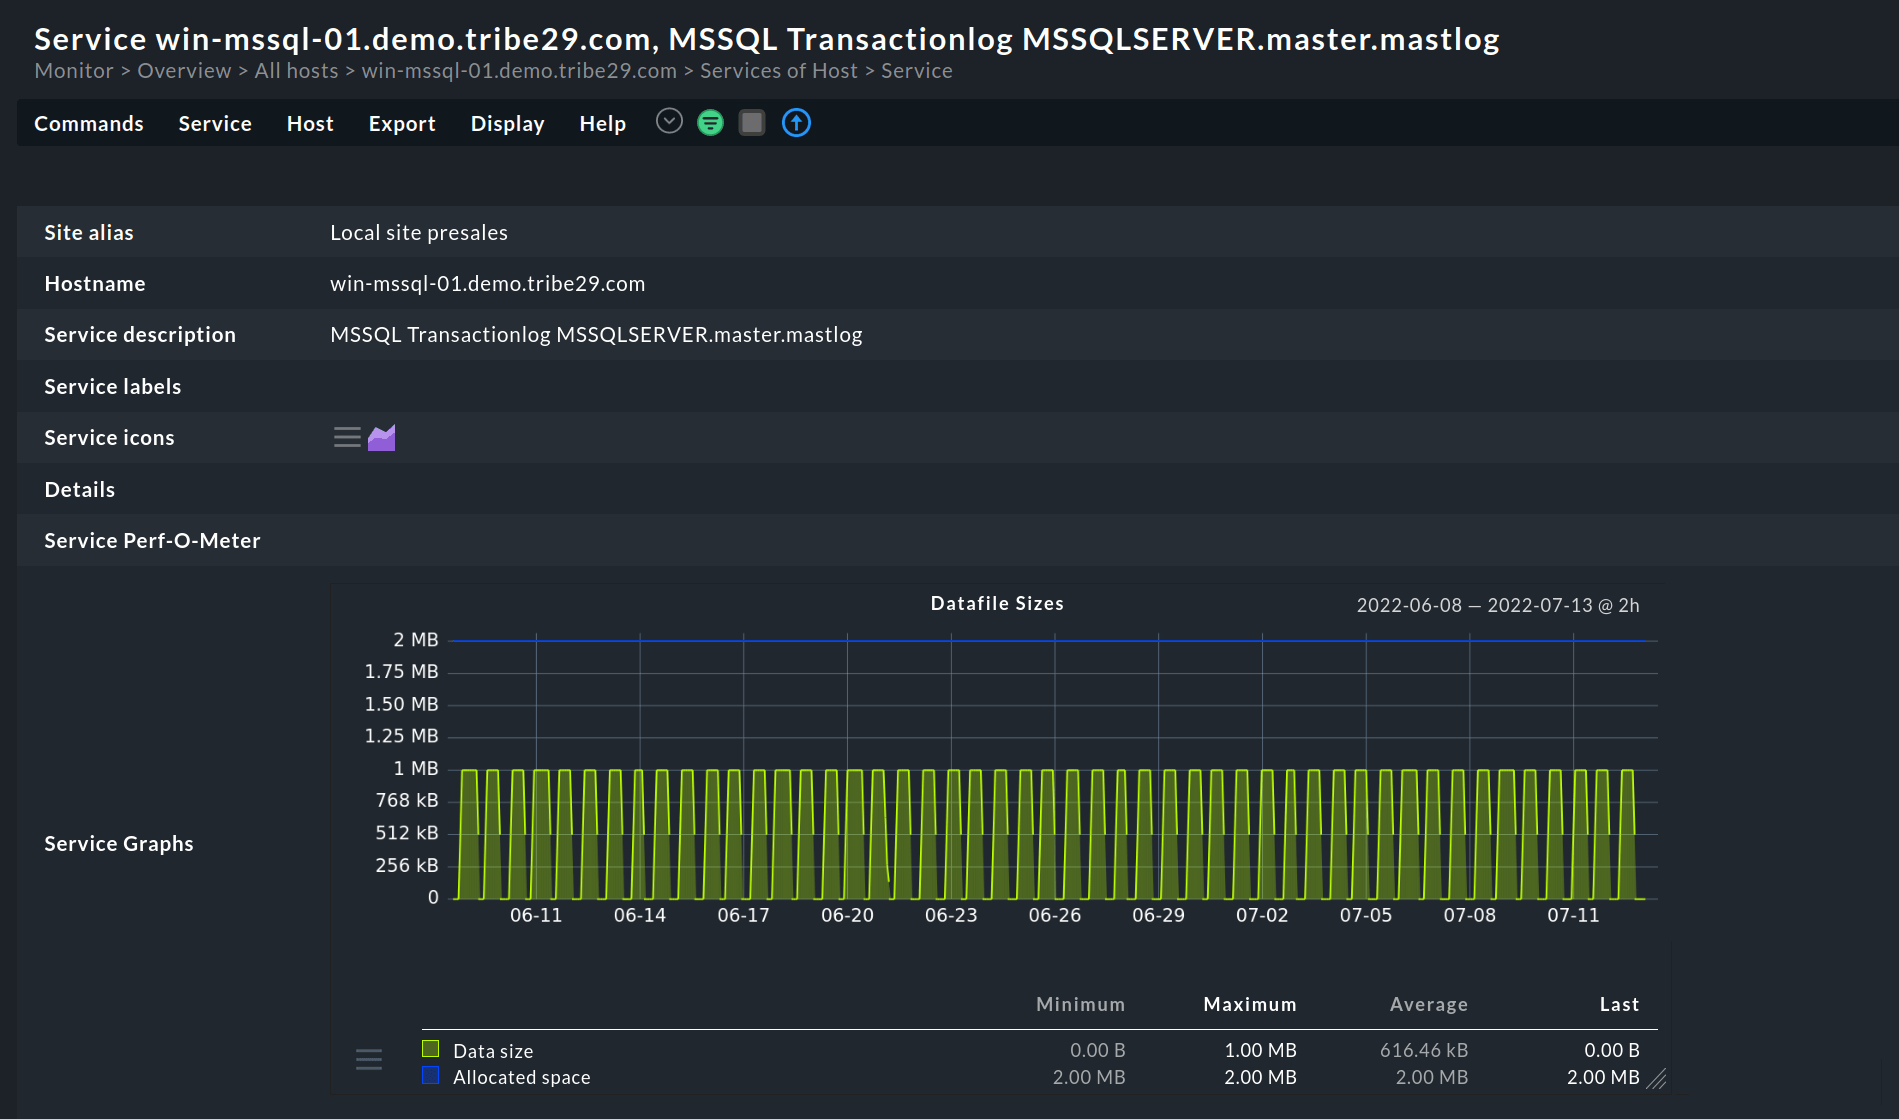
Storage engine
The storage engine is responsible for file management, handling transactions, accessing various database objects, and more.
Monitoring the engine ensures that the functions are optimal. If not functioning properly or as expected, the DBA teams can address the bottlenecks. Some metrics to monitor include file access, storage capacity, allocation, and performance.
What metrics should be monitored on an SQL server?
Monitoring the SQL server performance provides useful insights that enable you to make informed decisions and get the best out of your data platform. While there are plenty of metrics, you have the option to choose what is important for your particular environment, applications, and goals.
Generally, the SQL server metrics fall into the following five major categories:
- Transaction
- Buffer Cache Metrics
- Locks metrics
- Resources
- Indexing
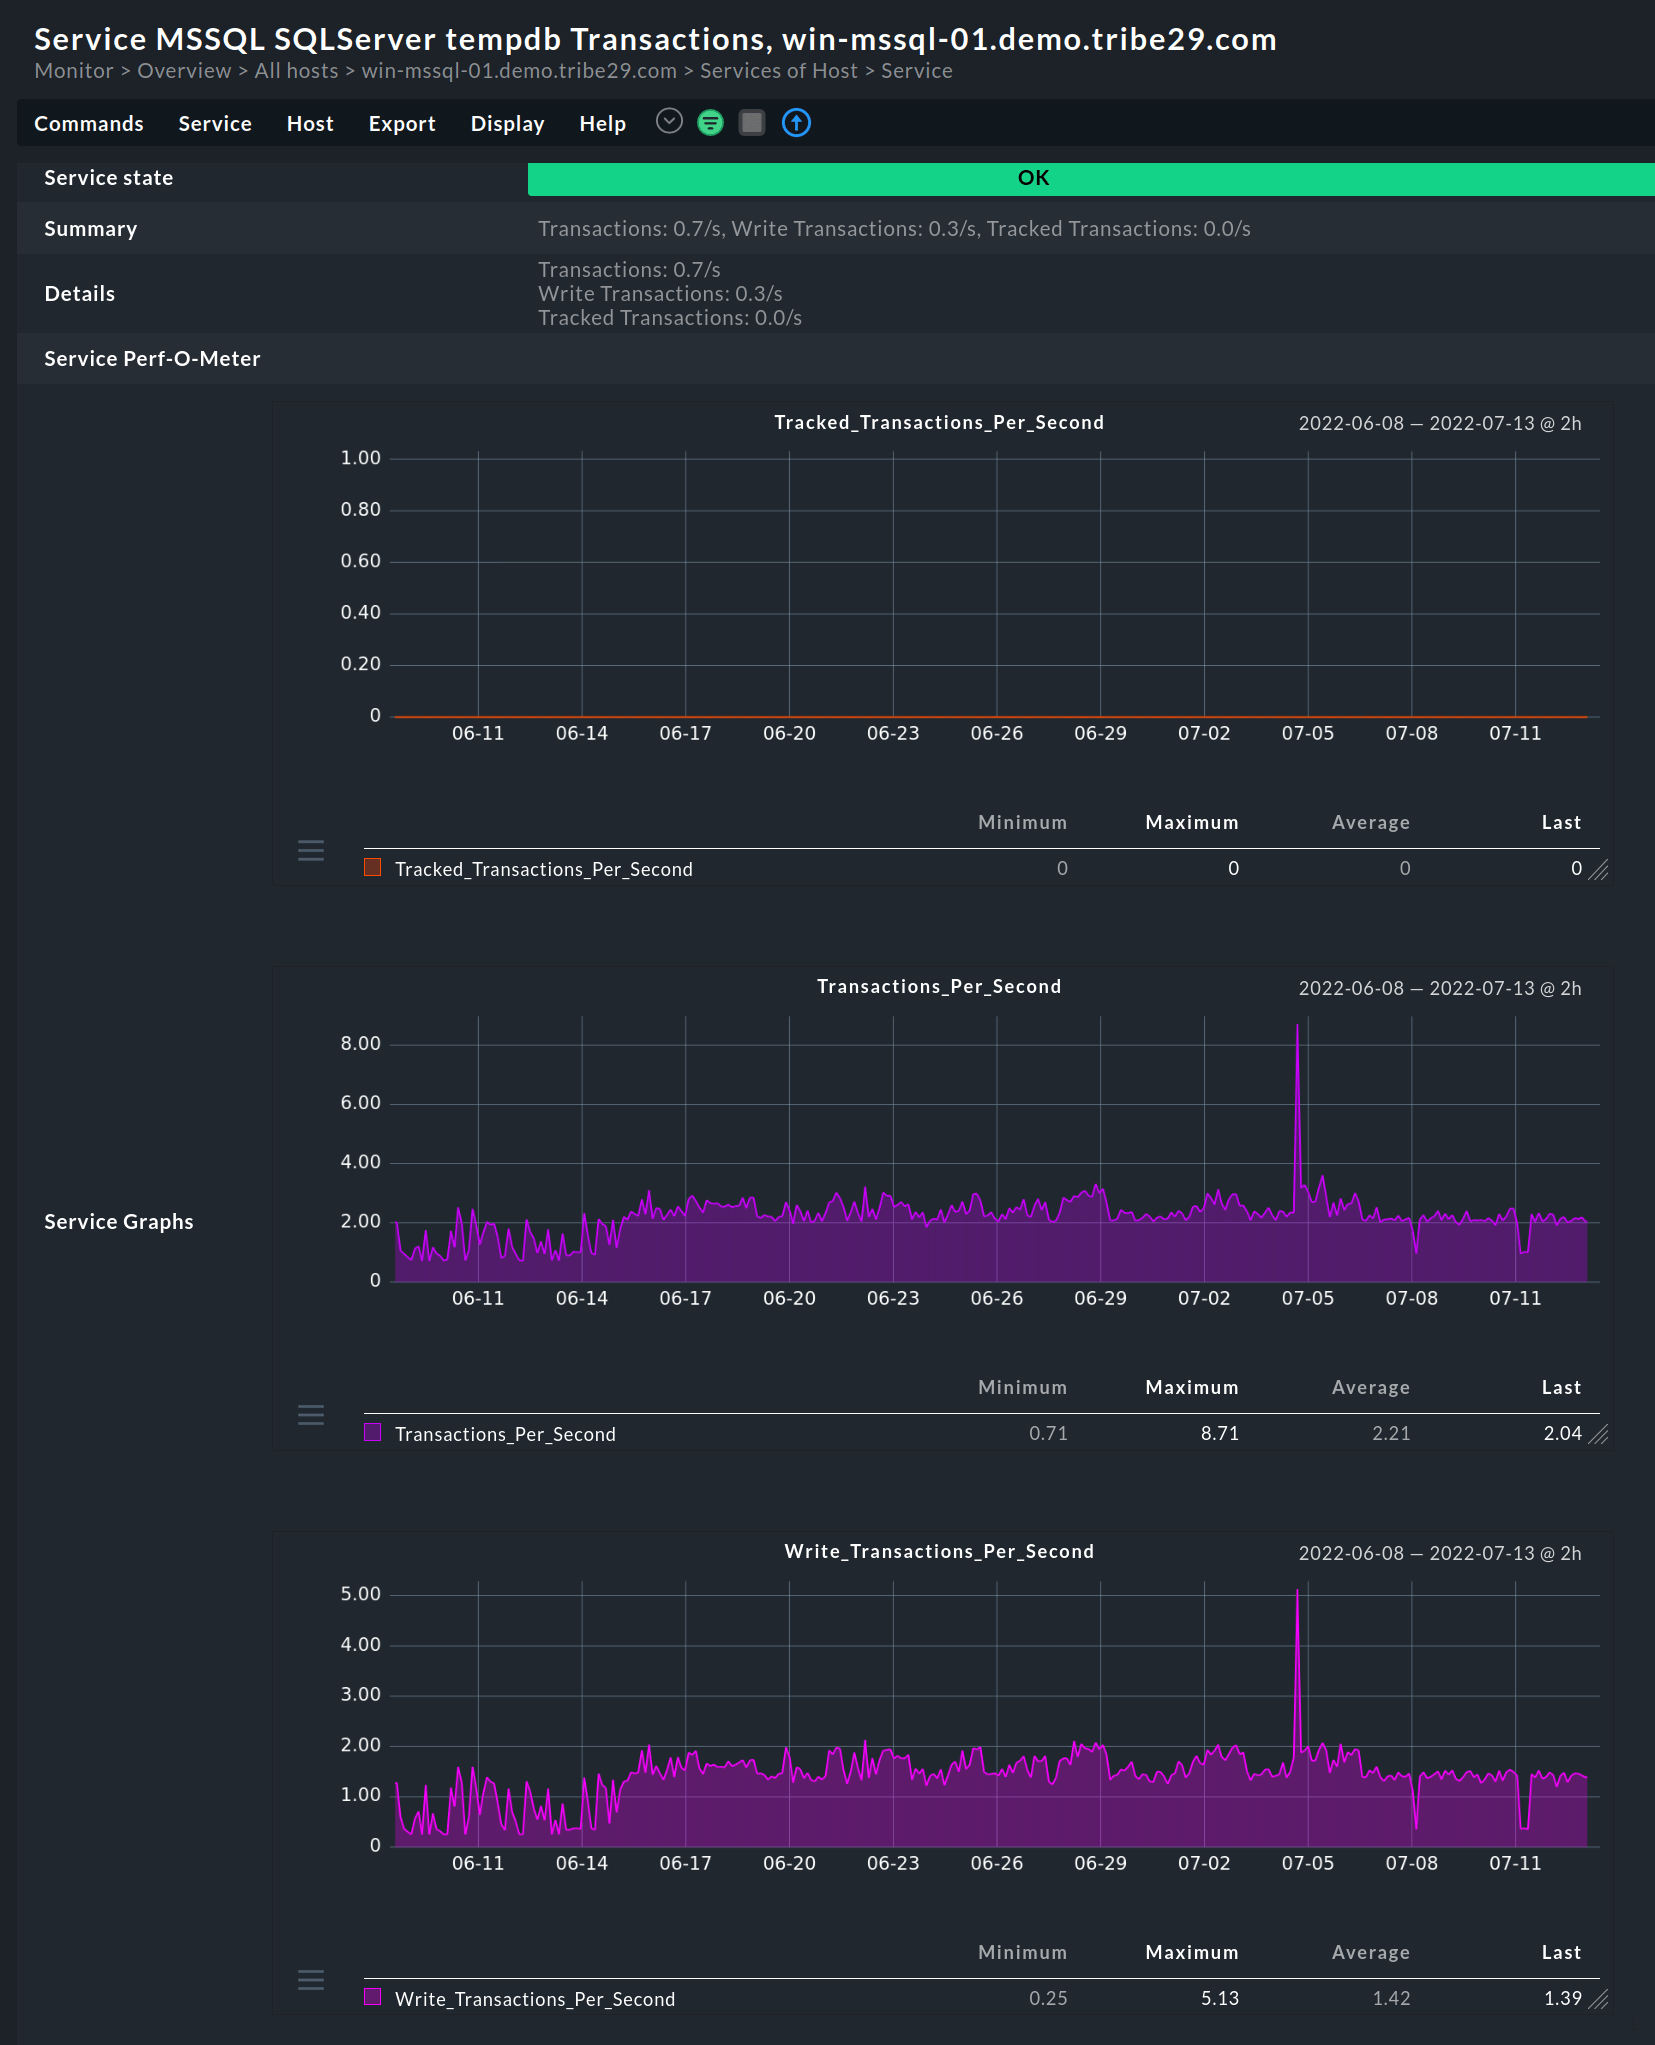
Transact SQL (T-SQL) metrics
The T-SQL is an extension of the conventional SQL which adds extra functions to the SQL server. It interacts with relational databases and provides features such as transaction control, error handling, row processing, and more. In practice, there are several metrics to monitor within the T-SQL. These include:
Batch requests per second
Monitoring batch request per second provides a high-level view of the database usage. It shows the number of batch requests the database engine encounters per second.
In practice, a batch may include a single or several SQL statements, but will have the same effect. Furthermore, even a batch that calls a stored procedure is still considered a single batch request.
To get better insights, the best practice is to measure other related metrics such as the elapsed time, memory usage, and others.
SQL compilations per second
The compilations per second refer to the number of times the server compiles the SQL queries in one second. In practice, the SQL server will compile and cache queries before the execution. Ideally, it should compile a query only once and then re-use or reference it in the future.
Monitoring the compilations per second shows if the server is referencing the cached queries only once or several times. If only once, it means that it is compiling for each batch request and the number of compilations/second will be almost equal to that of the batch requests/second. Ideally, the compilations per second should be 10% or less than the total number of batch requests per second.
SQL recompilations per second
SQL recompilations per second refer to the number of times the server recompiles the queries in one second. Whenever the SQL server is restarted, or there are changes in the database data or structure, the existing execution plan may become invalid.
In such a case, the execution plans are recompiled. While the recompilation enables the execution of the T-SQL batches, you may not receive the same performance benefits, such as reduced execution time, offered by the previous compilation.
It is therefore essential to observe the trends in the recompilations per second and determine if this has an impact on performance. If there is a drop-in performance as the number of recompilation per second increases, you may consider adjusting the threshold baseline to lower the rate.
Last elapsed time
The last elapsed time gives an insight into the amount of time, in microseconds, the SQL server took to perform the most recent execution of a plan or task. Usually, the SQL server will compile the T-SQL queries or statements and then cache them as execution plans. The activity reduces latency and hence helps to improve the server performance. By monitoring the cache, it is possible to establish how long it takes for the server to execute the queries.
Buffer cache metrics
When executing queries, most of the processes take place between the database and the buffer cache. As such, monitoring the buffer cache provides insights into activities between the two. Ideally, the SQL server should perform as many read/write operations as possible in the memory instead of the slow disk drive.
The key metrics to monitor include:
Buffer cache hit ratio
The buffer cache hit ratio compares the number of times the buffer manager pulls pages from the cache versus straight from the disk. It is essential to monitor the metric and identify optimization areas.
Usually, a low buffer cache ratio could lead to high latency. And you can increase the size by allocating more memory. Although there is no standard metric for the buffer cache ratio, it is recommended to have a minimum of 95 when looking for high performance. However, a value of 90 is also suitable for a wide range of applications.
Checkpoint pages per second
The checkpoint pages per second refer to the number of pages that a Checkpoint action writes to the disk per second. Once a page is modified, it will remain in the buffer cache as a dirty page until checkpoint time. At the checkpoint, the buffer manager then moves all the dirty pages to the local disk drive to free up space.
Monitoring checkpoint pages/sec or the rate at which the buffer manager moves the pages to the disk is critical in determining if the resources are adequate or not.
Page life expectancy
The page life expectancy shows how the buffer manager is performing the read and write operations in the memory. For example, it shows the time in seconds that a page stays in the buffer cache without a reference.
According to the Microsoft standard, the page life expectancy (PLE) should not be less than 300 seconds for every 4 GB of memory allocated to the server. With more RAM, you can have a higher PLE threshold. To calculate the value, use the formula below.
PLE (Page Life Expectancy) threshold = ((Buffer Memory Allocation (GB)) / 4) * 300
For example, if you allocate 10 GB RAM to the SQL server, the PLE value will be
PLE threshold = (10 / 4) * 300 = 750 seconds
In practice, the SQL server often flushes the pages at a checkpoint or when there is a need for more space in the buffer cache. In the latter case, the SQL will flush the infrequently accessed pages.
Monitoring the number of pages flushed out per second at checkpoint enables you to determine if this is the cause of high turnover and hence low life expectancy.
It provides you with the opportunity to reconfigure and reach an optimal setting. If the monitoring shows reducing PLE values as the workloads increase, it indicates that the memory is inadequate, and you may need to add some more.
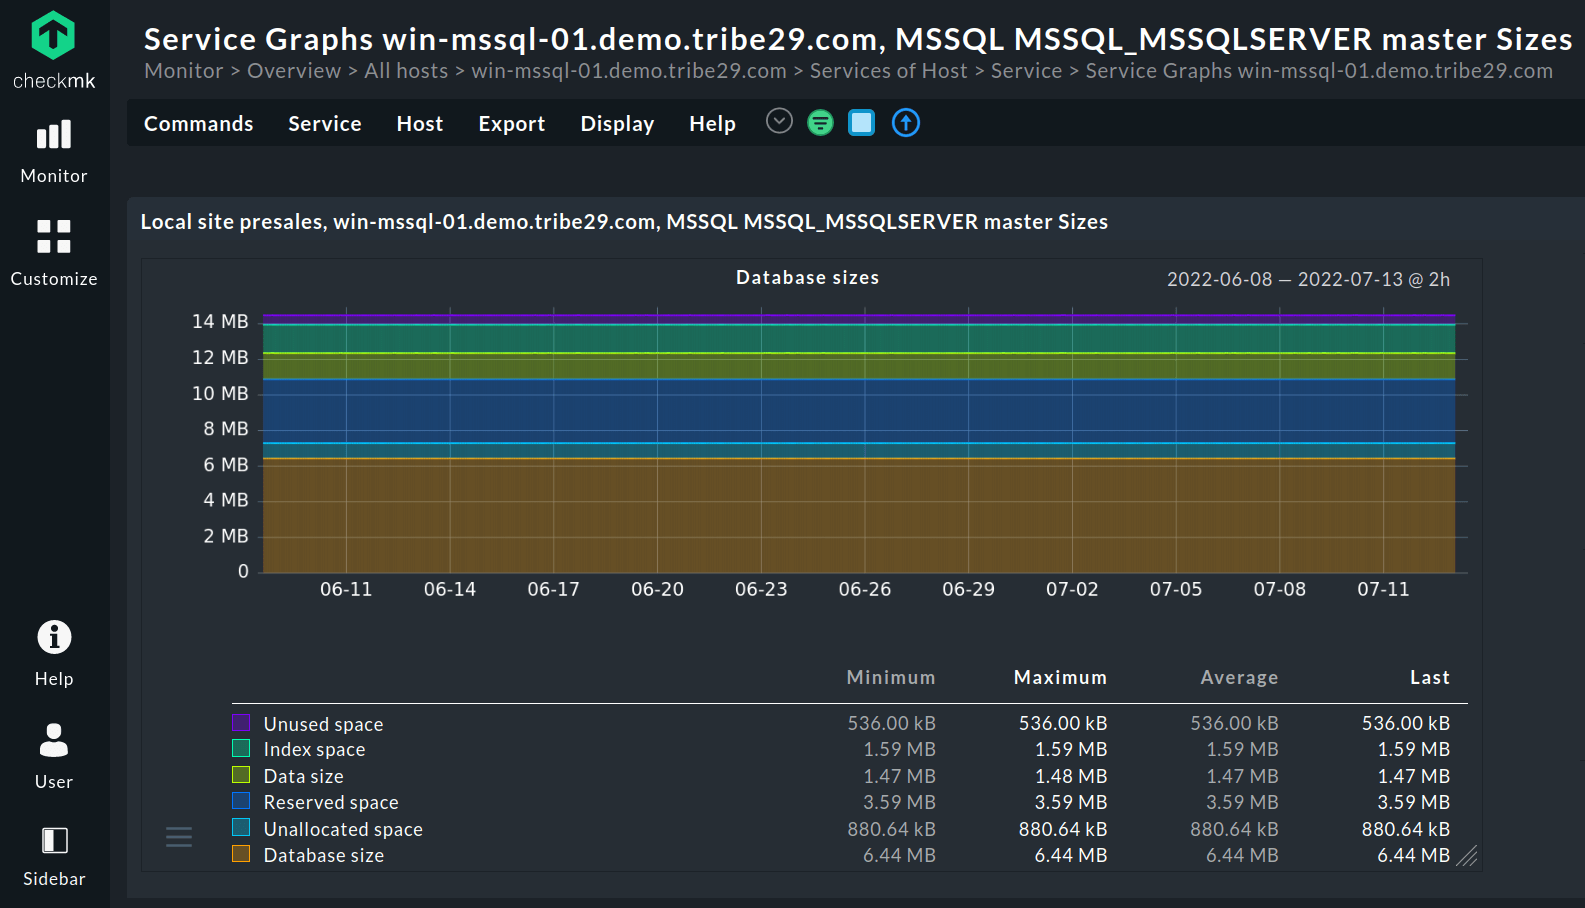
Table Resource metrics
It is essential to monitor SQL server tables and how they use the available resources. It helps to determine if there is enough system memory, storage, and other resources.
The monitoring measures metrics such as the amount of memory in kilobytes that a table uses. It also checks the space a table’s data or indexes occupy.
Memory-optimized tables
An SQL server uses memory-optimized tables which support low latency, and high throughput transactions. Generally, the memory-optimized tables enhance the read and write speeds.
Monitoring the rate of satisfying queries from the in-memory tables as well as the resources the process uses helps you to determine if the process is optimal or may require some adjustments.
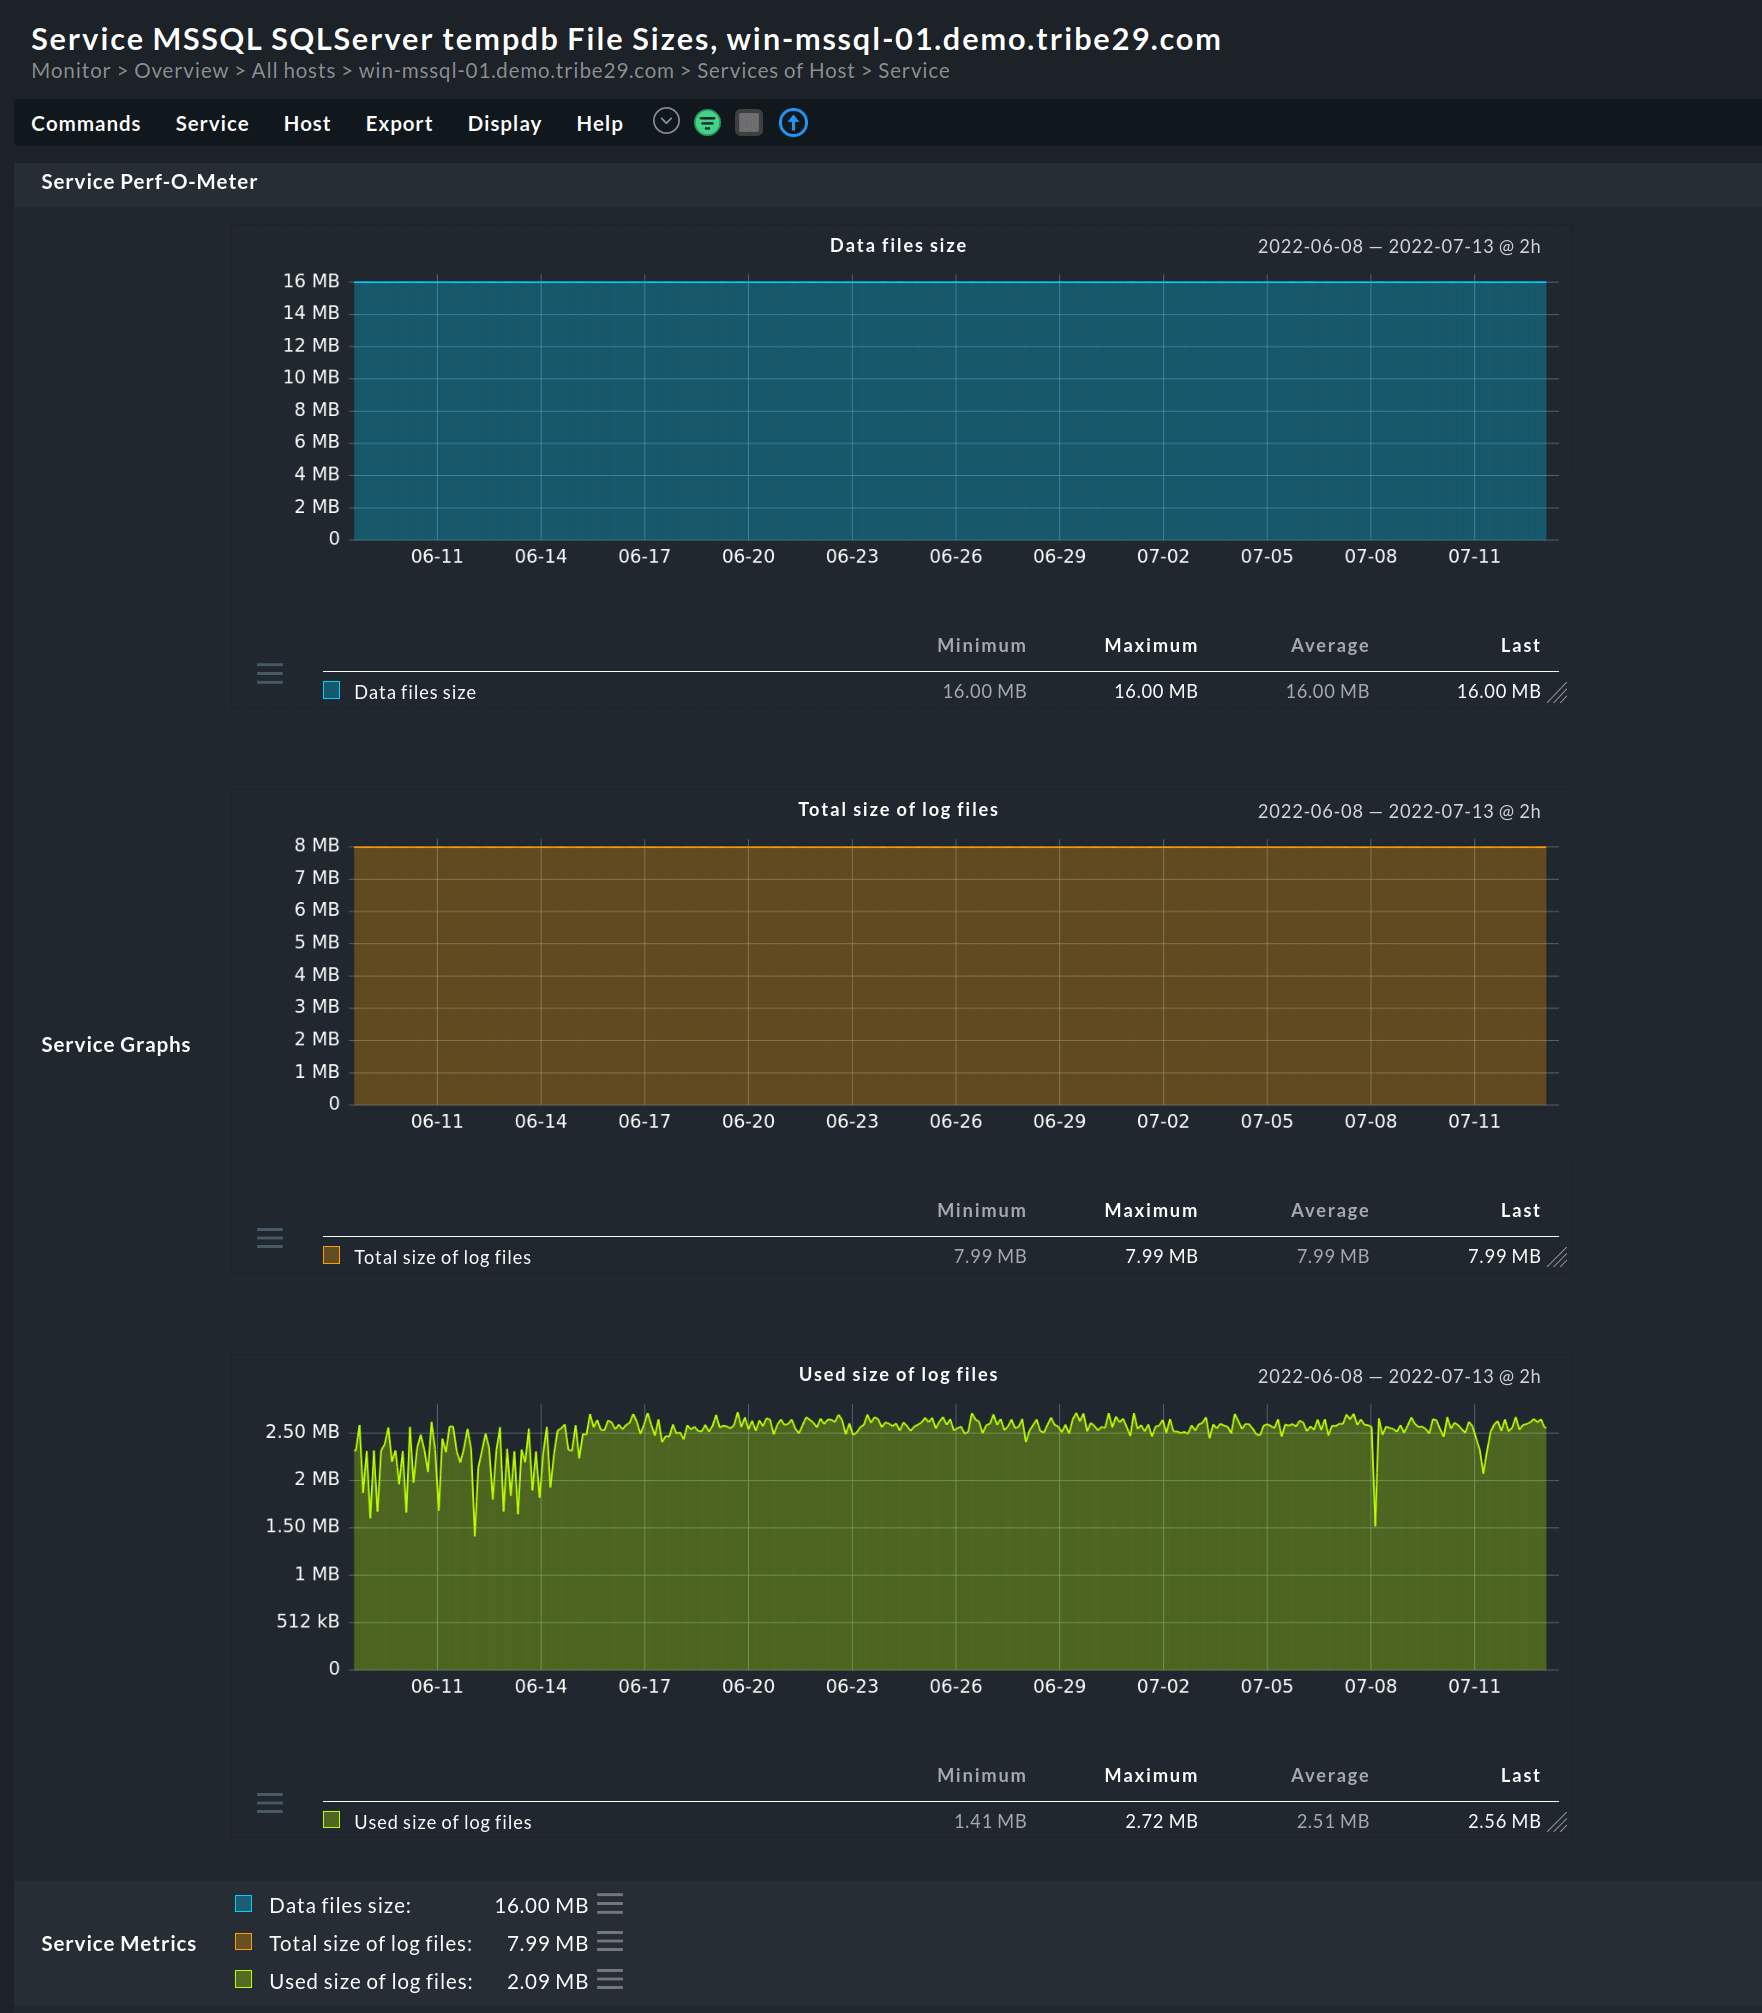
Disk usage
Monitoring the disk usage keeps you up to date with the storage space, including getting a warning when running out of space. You are then able to take action in good time and avoid costly performance issues. The monitoring should find out the amount of storage space that the data and indexes in a given table use.
Resource Pool metrics
The resource pool is a representation of the server's physical resources such as CPU, memory, I/O, and others. You can look at the resource pools as virtual SQL server instances. When configuring the resource pools, the admins often set some limits for the CPU, memory, and disk I/O resources based on your application's requirements. After configuring, you must ensure efficient utilization of the resources and that the users are getting an acceptable performance.
The best strategy is to monitor the resources in each pool and adjust them when necessary.
CPU Usage %
The CPU usage percent is the percentage of the SQL server’s CPU that all workloads in a specific resource pool use. You can specify the minimum and maximum CPU percent for the given resource pool. By monitoring the CPU usage % you can determine the consumption trends by most of the common users. You also see how different settings impact performance and can therefore adjust the min, max, and hard limit (CAP) values to optimize and customize the server performance for specific tasks.
Disk I/O operations
The Disk I/O operations include the disk read and write activities, two of the main metrics are the input and output time. It is essential to monitor these metrics, since they indicate the time it takes to read or write data to and from the resource pool. The disk read I/O per second refers to the number of disk read operations done within the last second per resource pool. While the disk writes, I/O refers to the disk write operations.
Disk queue length
The disk queue length refers to the number of read/write requests on the queue for a specific disk. It is essential to monitor this metric since it has an impact on performance. If the value is high, it means that the process of reading and writing the disk is slow, hence a high latency.
One of the potential solutions is to add more disk capacity, but this needs to be done after checking other metrics such as file and wait statistics, which also impact the read\write speeds.
Memory pages per second
The memory pages per second is a useful metric whose value is crucial in determining if there are faults that could be slowing down the performance. The monitoring is crucial in determining a wide range of memory issues. A high value is an indication of a high rate of paging memory to and from the disk.
Latch wait time
An SQL server uses latches to protect the in-memory data. It also helps to maintain the integrity of the data in the various shared resources. There are generally buffer and non-buffer latches. Observing the latches enables you to view the statistics and identify the causes of the delays.
Whenever the I/O system is unable to keep pace with the rate of active requests for an extended period, a latch wait delay occurs. In such a situation, it also takes longer to fetch the data from the disk drive and copy it into the memory.
Metrics for locks
Whenever there is a query against a row, page, or table of a dataset, the systems enable a lock that prevents other processes from modifying the data being worked on.
Lock waits per second
A high number of waits per second means that the system will have to wait for a longer period for the unlocking and could lead to performance issues.
Although a high number of locks is an indication of a problem, this will depend on the server capacity. For example, a server handling about 100 requests per second will have fewer locks compared to one with 2 million updates per second.
Average lock wait time
Resources accessed by multiple users are usually locked by the SQL server to avoid misreads. To prevent other users from waiting for too long to access the resources, the average wait lock time should be as short as possible.
Monitoring the average lock wait times provides an opportunity to identify delays and which queries take longer to release locks.
Indexing
Indexing enhances the speed of searching data from the database. As the amount of data increases, the index grows and the SQL server may split the index to make it more efficient. However, this will increase resource usage and may lead to inefficiencies.
Monitoring the indexes enables the teams to keenly observe the index-related metrics, hence taking the necessary actions to ensure efficient query handling.
Metrics to monitor
Page splits per second
The monitoring checks the number of page splits occurring per second due to an increase in data. Usually, the indexes are stored on pages just like the data. As data grows, the indexes will increase. But as the page gets too full, the SQL server will create another index page, and move some rows from the full page onto the new one.
Since this process may consume a significant amount of resources, it is important to monitor and take action if the number of splits per second is high. Unfortunately, too many page splits may reduce the performance as it leads to fragmentation.
Fragmentation %
Fragmentation is when the order of the data in the index differs from the order of how data on the disk is stored. Generally, this leads to slow performance as the system needs more time to match the index and corresponding data.
Causes of fragmentation include growing data, page splits, and changes in the index after updating, inserting and deleting entries.
Monitoring is one way of determining the extent of fragmentation, and a useful metric to observe is the fragmentation percentage. This refers to the percent of order pages in the index. If the fragmentation is high, it will slow performance, and you could address this by rebuilding the index.
Connection metrics
Maintaining a reliable client connection is critical in ensuring the proper execution of queries. You should therefore monitor the connections and address them to ensure reliable performance and availability.
User connections
The metric refers to the number of users successfully connected to the SQL server when the measurement is taken. Monitoring the connections and correlating with other metrics provides you with the opportunity to discover optimization areas.
How do you start monitoring your SQL Server environment?
Ideally, the best and most effective practice is to use a reliable monitoring solution. Then you have everything in one place and a lot of insights. Otherwise, you can log in on every system and check manually, but this provides you with fewer data, no correlation, etc.
While you can monitor a few issues manually, this is cumbersome and ineffective, especially if you have many SQL servers in your environment.
If you are using a monitoring tool, you need to have a good strategy, and this requires following some proven steps.
Step 1: Discover the SQL servers
Discover all SQL servers that you need to monitor. The initial discovery, especially if you are new to the environment, helps you to identify the number and physical location of SQL servers in your environment.
Step 2: Create an overview of your SQL Server environment
Map out all the key assets and components that make up and support the SQL server ecosystem. One of the best practices is to identify all the SQL infrastructure components, and then document them.
After this, monitoring and managing is a lot easier and is even better if you have managed to capture as many assets and components as possible.
Step 3: Determine the metrics to monitor
Establish the SQL server metrics that you will monitor. Usually, the database platform has so many metrics that you can track and gain insight into a wide range of key areas across the ecosystem.
Ideally, you need to track the major hardware and software resources, as well as other critical performance metrics. Typical components include the CPU, RAM, storage disk drive, network, and others. Additionally, it helps you to monitor the capacity, which enables you to plan for future upgrades.
Besides the hardware, you need to track the software configurations and the impact on the performance.
Step 4: Identify an effective monitoring tool
Look for tools that best match your monitoring goals. Since SQL server deployments may differ from one organization to the other, it is vital to lay a monitoring strategy that best captures all the key components that directly impact your database performance.
Step 5: Start monitoring while fine-tuning your strategy
Deploy your monitoring tool and strategy to determine the overall health of your database platform. Monitor all the key metrics that would impact the SQL server's health and performance.
Evaluate your SQL server monitoring strategy and make adjustments to improve its efficiency. Depending on your configurations, you may start receiving a lot of alerts, some of which are false alarms, duplicates, and others.
Overwhelming alerts will eventually result in slow response time and the inability to deal adequately with the key issues.
Which is the best SQL Server monitoring software?
It is good practice to deploy effective SQL server monitoring tools that only provide alerts when there are problems. A good monitoring solution should also notify you when there is excessive usage of resources such as CPU, RAM and disk, as well as when there are issues with other performance metrics.
It is important that a tool provides precise monitoring with minimal effort and support a variety of databases and environments. If a monitoring tool is too time-consuming in its usage, it puts database system administrators under immense time pressure, and this leads to gaps in the database monitoring.
One of the best SQL monitoring tools is Checkmk. The tool comes with a wide range of monitoring plug-ins, which makes it very easy to collect and analyze metrics data.
Further, the easy to set up and flexible tool integrates well with Microsoft SQL, Oracle Database, PostgreSQL, MariaDB, and IBM DB2. This allows you to set up a comprehensive monitoring solution for your SQL servers with just a few clicks. This enables you to quickly set up and monitor SQL servers with Checkmk.
All the necessary plug-ins can be accessed via Checkmk's graphical user interface and likewise installed with just a few clicks.
Additionally, Checkmk is highly scalable and suitable for all types of organizations. For example, Swisscom uses Checkmk to monitor huge Oracle databases with several thousand services per host without any problems.
You can also monitor databases in the cloud with Checkmk – you can easily monitor AWS RDS for example. Monitoring integrations in NoSQL databases such as Redis, MongoDB, or Couchbase are also available.
Checkmk is also suitable for cross-team use and provides database administrators with easy access to the DevOps world thanks to its deep Prometheus integration. At the same time, developers also benefit from the data from Checkmk and can monitor the interactions of databases and applications.
What are the common issues and challenges when monitoring SQL servers?
DIY or home-built solutions may appear as favorable and low-cost alternatives for server monitoring. However, these could be ineffective, time-consuming, and costly in the long run.
While some organizations opt to use in-house developed or manual monitoring solutions to cut costs, this approach is ineffective, especially when there are many instances. Another problem with the in-house tools is the inability to fully monitor SQL servers spread across on-premises, cloud, and hybrid infrastructures.
The lack of a proper SQL server monitoring tool prevents the efficient operation of the database system. In particular, the admins may delay deploying new processes, especially if they spend most of the time performing manual, time-consuming tasks.
Because of the ineffectiveness, the DBAs will struggle to fix frequent problems instead of spending their time finding and addressing the root causes.
The problem with DIY SQL server monitoring solutions
While implementing a DIY SQL server monitoring solution may seem attractive and a way of reducing costs, it has various challenges. As such, it may not deliver as requires in the long term, and below are some of the issues you are likely to encounter.
Collects too much data
Collecting too much data: Some tools collect a lot of data, including information that does not relate to the performance of the SQL server. Analyzing this data takes longer, hence reducing the efficiency of the monitoring efforts. An ideal tool should be fast while providing relevant information and preferably actionable insights on performance data.
Gathers inadequate metrics information
Gathering inadequate metrics information: Similarly, a tool that provides little information may not deliver, hence will be ineffective. Without adequate information, the DBA teams will have challenges making the right or effective conclusions.
Also, they may spend a lot of time and effort unnecessarily to solve a small issue that requires less investment.
Increases management overhead
Monitoring increases the administrative workload significantly. It causes too many unnecessary alerts that the DBAs have to address and thus waste a lot of time. With precise alerts, this time could be used for other tasks.
Uses more resources
Although the impact of the monitoring tool is negligible on the SQL server performance, there are cases where resource usage is high. The impact largely depends on the environment, whether the server is hosted in-house, on the cloud, or in a hybrid IT infrastructure. For example, for a cloud-based server, the monitoring tool may use significant bandwidth.
The tool’s network traffic may end up competing with the actual database applications, hence reducing the response speeds. Similarly, a tool that uses more CPU and memory will degrade performance. Usually, this is a challenge when there are limited resources.
Increases technical debt
Besides spending time developing the in-house monitoring tool, the maintenance cost and other challenges could be high. The in-house solutions are prone to many challenges including lack of documentation, developers who leave the company, scaling issues, and more.
For example, without documentation, it may not be possible to know which developer worked on a certain part of the solution. Also, when the programmers leave the company, it becomes a challenge or very expensive to maintain the solution.
Final Thoughts on monitoring SQL servers
Databases have become critical components of today’s desktop, mobile, industrial and other applications. Ensuring high efficiency and availability is therefore critical in providing excellent user experience and business operations.
Poorly performing SQL servers not only reduce the efficiency of the organization's internal operations, but also the external customer services.
One of the best ways to keep track of the performance, detect issues, and provide an opportunity for DBAs to provide fast fixes is to deploy effective SQL server monitoring.
However, to achieve continuous SQL server monitoring, you need an effective tool that can collect all the relevant metrics and provide you with actionable insights.
Ideally, the monitoring enables admins to quickly identify critical performance issues on the server. In particular, an effective tool provides the ability to drill down and analyze a wide range of performance metrics.
FAQ
How do I monitor Microsoft SQL Server?
Microsoft SQL Server can be monitored by automated tools such as Checkmk. The comprehensive and highly customizable tool can monitor a wide range of metrics, collect valuable data and provide actionable insights. Since the goal of monitoring may differ from one environment and applications to the other, you can customize Checkmk to only monitor the tools relevant to your objectives.
The tool helps you to set up precise alerts, visualize the performance, identify problems and optimize your resources to get the best ROI. It also enables you to manage existing and potential performance risks.
How do I run SQL Activity Monitor?
The activity monitor can be started in various ways. These include:
- Clicking the activity monitor icon on the SQL Server Management Studio toolbar.
- Going to the Object explore and right-click the SQL server instance and select the Activity monitor.
- Using the keyboard shortcut Ctrl+Alt+A
- Setting the Activity monitor to automatically open when the SQL Server Management Studio is launched.
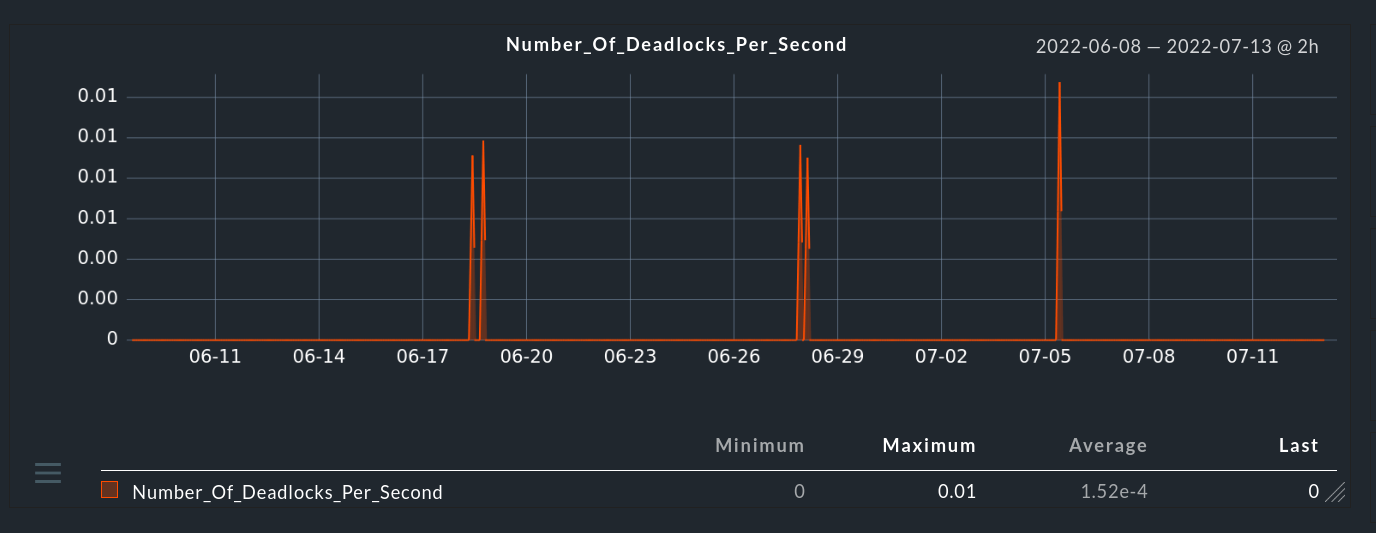
What is a SQL Server deadlock, and how does central monitoring help resolve it?
A deadlock occurs when two or more database transactions hold exclusive locks on different resources (such as specific tables or rows), and each transaction attempts to acquire a lock on the resource held by the other. This creates a permanent standstill where neither process can proceed until the database engine terminates one of the queries. Traditional monitoring might only alert you to high CPU or long wait times after the damage is done. A central monitoring tool like Checkmk queries the relational engine's lock statistics in real time to log the deadlock event, helping DBAs isolate the conflicting queries so they can rewrite application code or optimize indexing to prevent future structural conflicts.
Why does high index fragmentation degrade SQL performance, and when should monitoring trigger an alert?
As data is inserted, updated, or deleted, the logical order of pages within an index becomes disorganized, leaving gaps and scattering data across the disk (index fragmentation). This forces the SQL storage engine to perform significantly more disk I/O operations to read the same amount of data, drastically slowing down query response times. Monitoring the fragmentation percentage is essential, but triggering alerts on every fragmented table causes massive alert fatigue. Effective monitoring strategies configure thresholds to send warning alerts only when fragmentation on critical, high-volume tables exceeds meaningful thresholds, signaling the moment DBAs need to schedule an index reorganize or rebuild task.
How should you set up monitoring for a single host running multiple SQL Server instances?
When a single physical or virtual host runs multiple parallel SQL server instances, standard operating system monitoring (tracking aggregate host CPU or total RAM) becomes insufficient. It cannot differentiate which database instance is causing a resource bottleneck. To resolve this, specialized monitoring systems such as Checkmk utilize instance-specific service discovery. By deploying specialized agent plugins that securely connect to each named instance or database port, the platform builds separate, isolated performance profiles on a single dashboard. This allows administrators to track metrics like the buffer cache hit ratio or batch requests per second for each individual database suite independently.