Reduce Performance Bottlenecks with CPU Monitoring
Monitor the utilization of all your devices in your network thanks to CPU monitoring from Checkmk and detect performance bottlenecks, even if they are only temporary.
CPU monitoring for almost any system

-
Prevent disruptions due to CPU bottlenecks on all your IT systems
-
Collect CPU metrics (load, utilization, temperature) via SNMP or Checkmk agent
-
Set up custom alerts for critical temperatures to prevent CPU failures
-
Monitor CPU metrics of a Docker/LXC container in your Kubernetes instance to detect high usage at an early stage
-
Generate detailed reports and graphs to detect problems in systems early
-
Checkmk supports out of the box a variety of vendors and sensors to monitor CPUs on your network
Some of the vendors we support
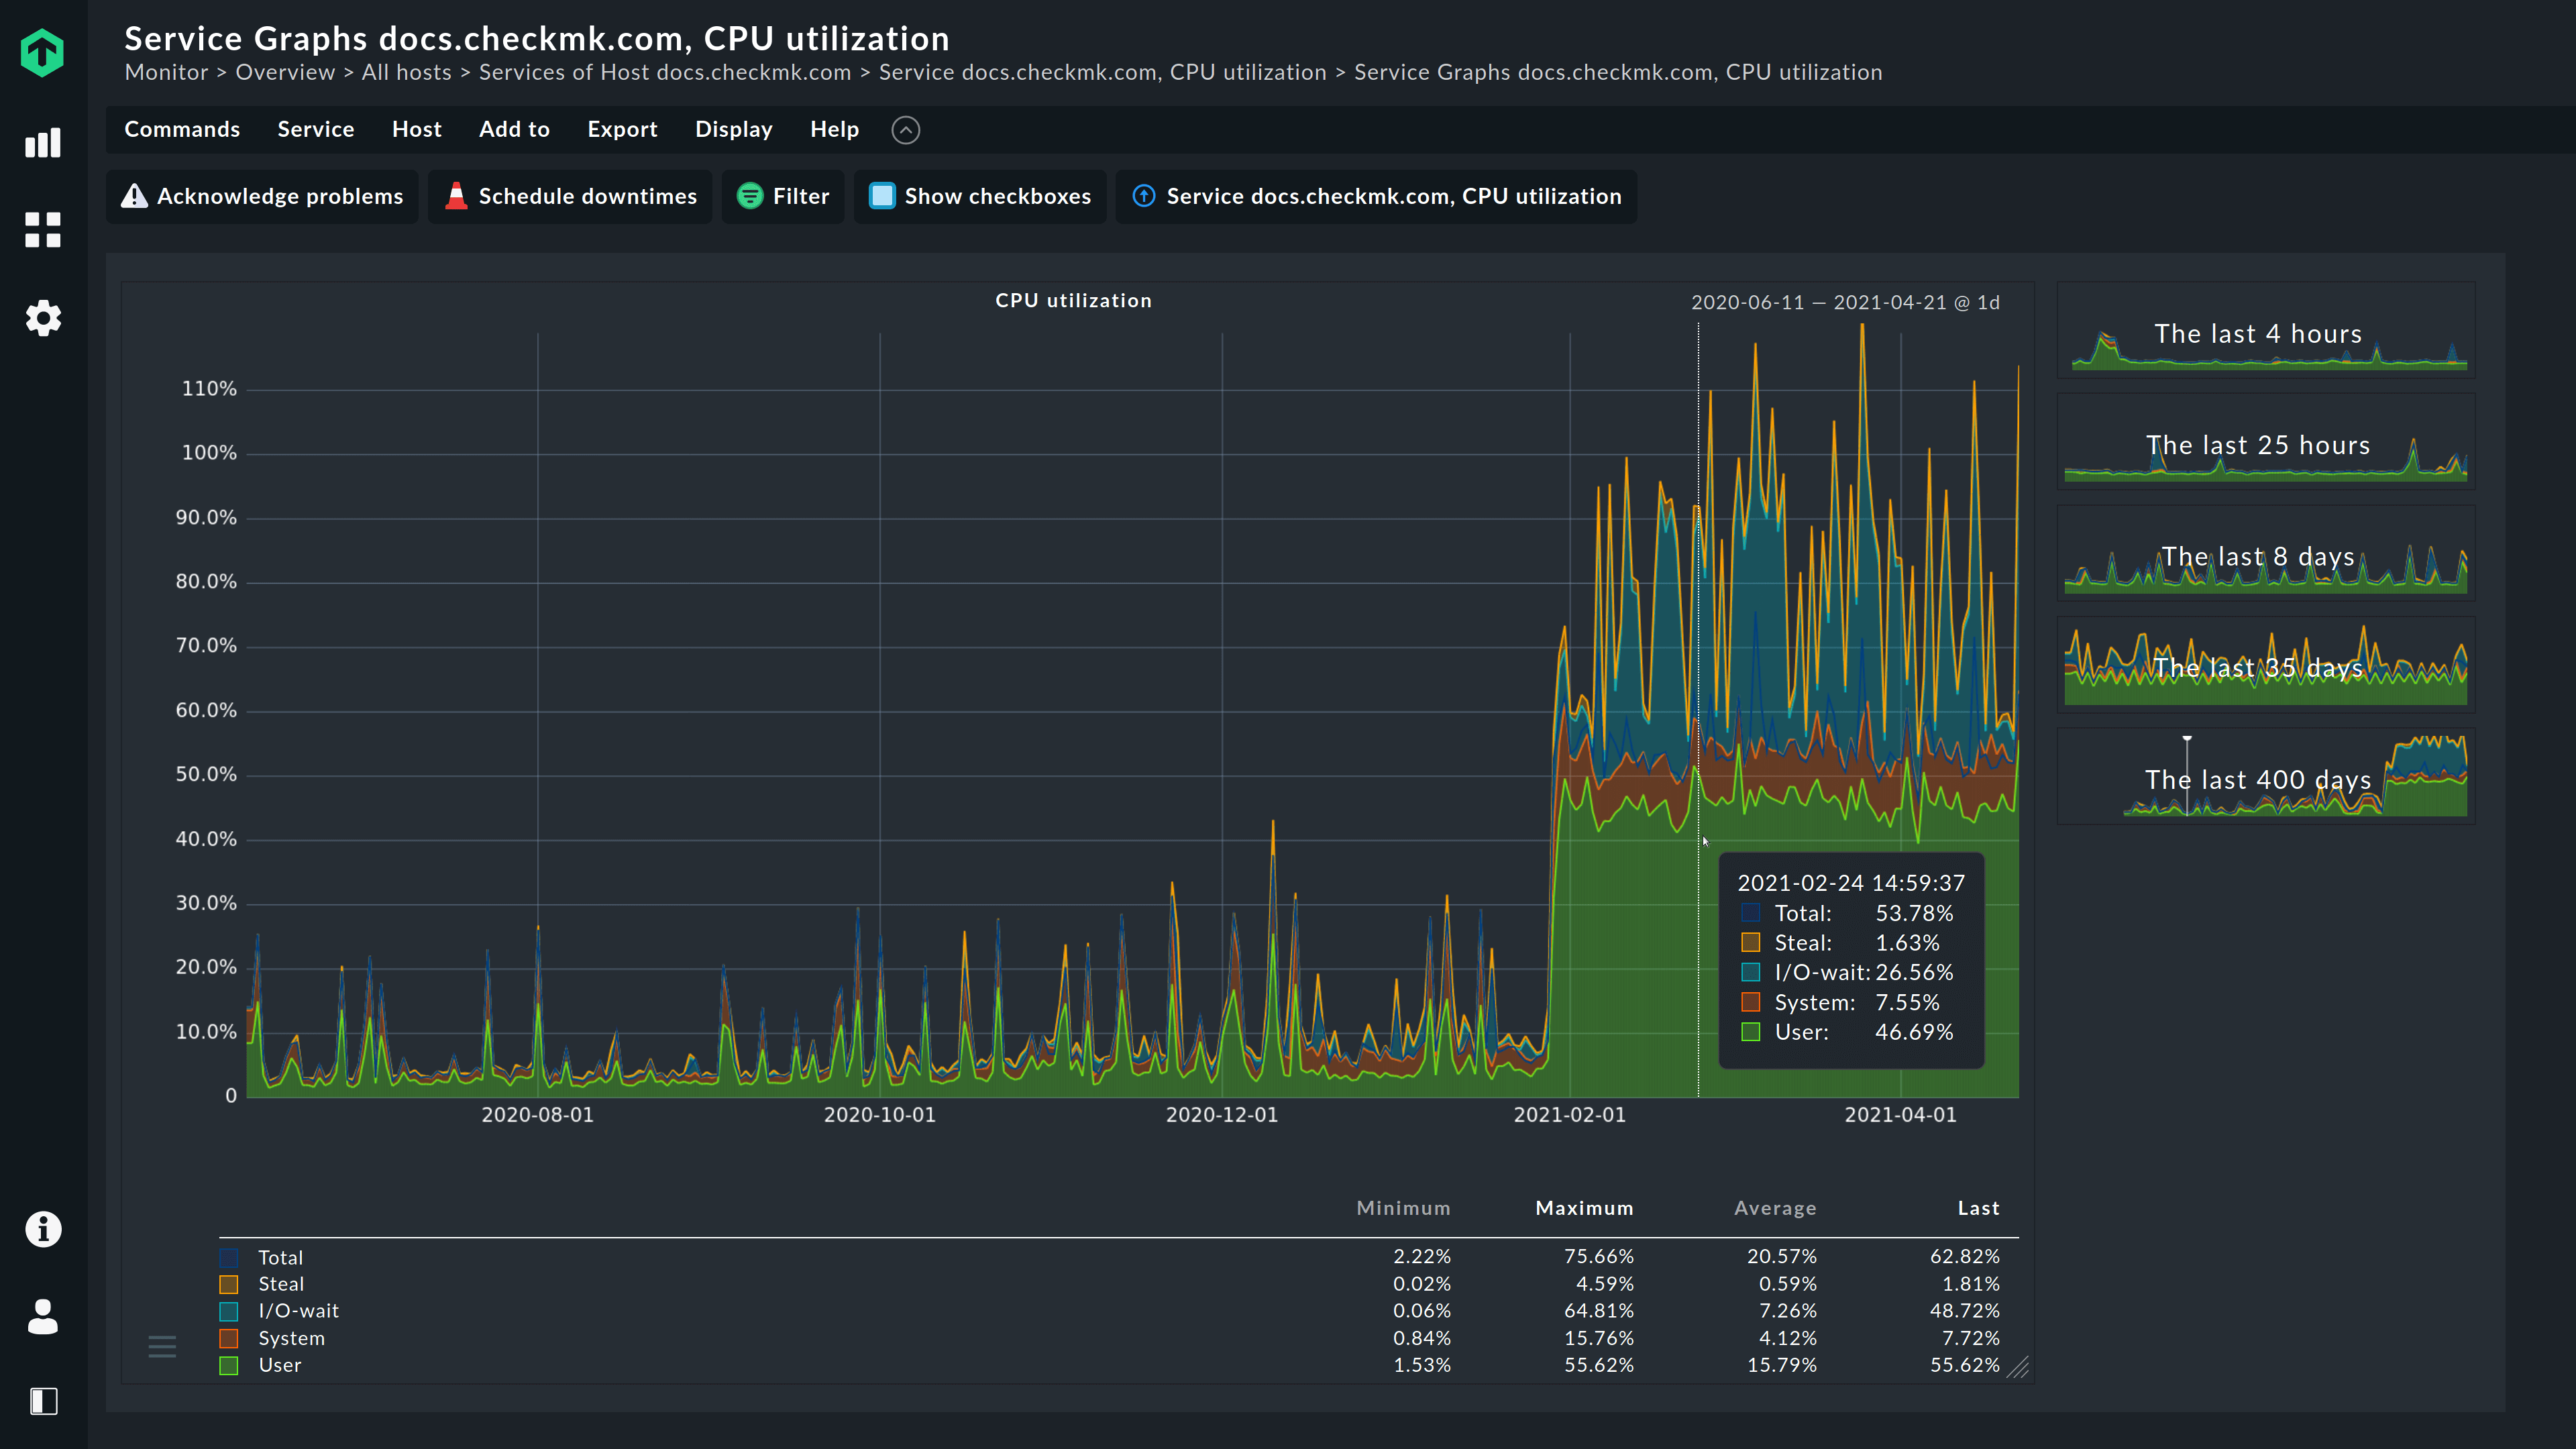
Monitor vital CPU metrics
CPU utilization is the percentage of computing time that is currently consumed by computing. In Unix systems, the CPU load is the number of processes that the CPU is currently computing and those that were waiting for the CPU to compute them.
Monitoring with Checkmk enables you to track all key CPU metrics:
- Monitor CPU utilization and CPU load of all the hosts in your IT environment
- Prevent overheating by monitoring CPU utilization and CPU temperatures
- Visualize CPU metrics and create custom alerts to detect anomalies early
- Generate detailed reports and custom graphs to pinpoint problems in the systems
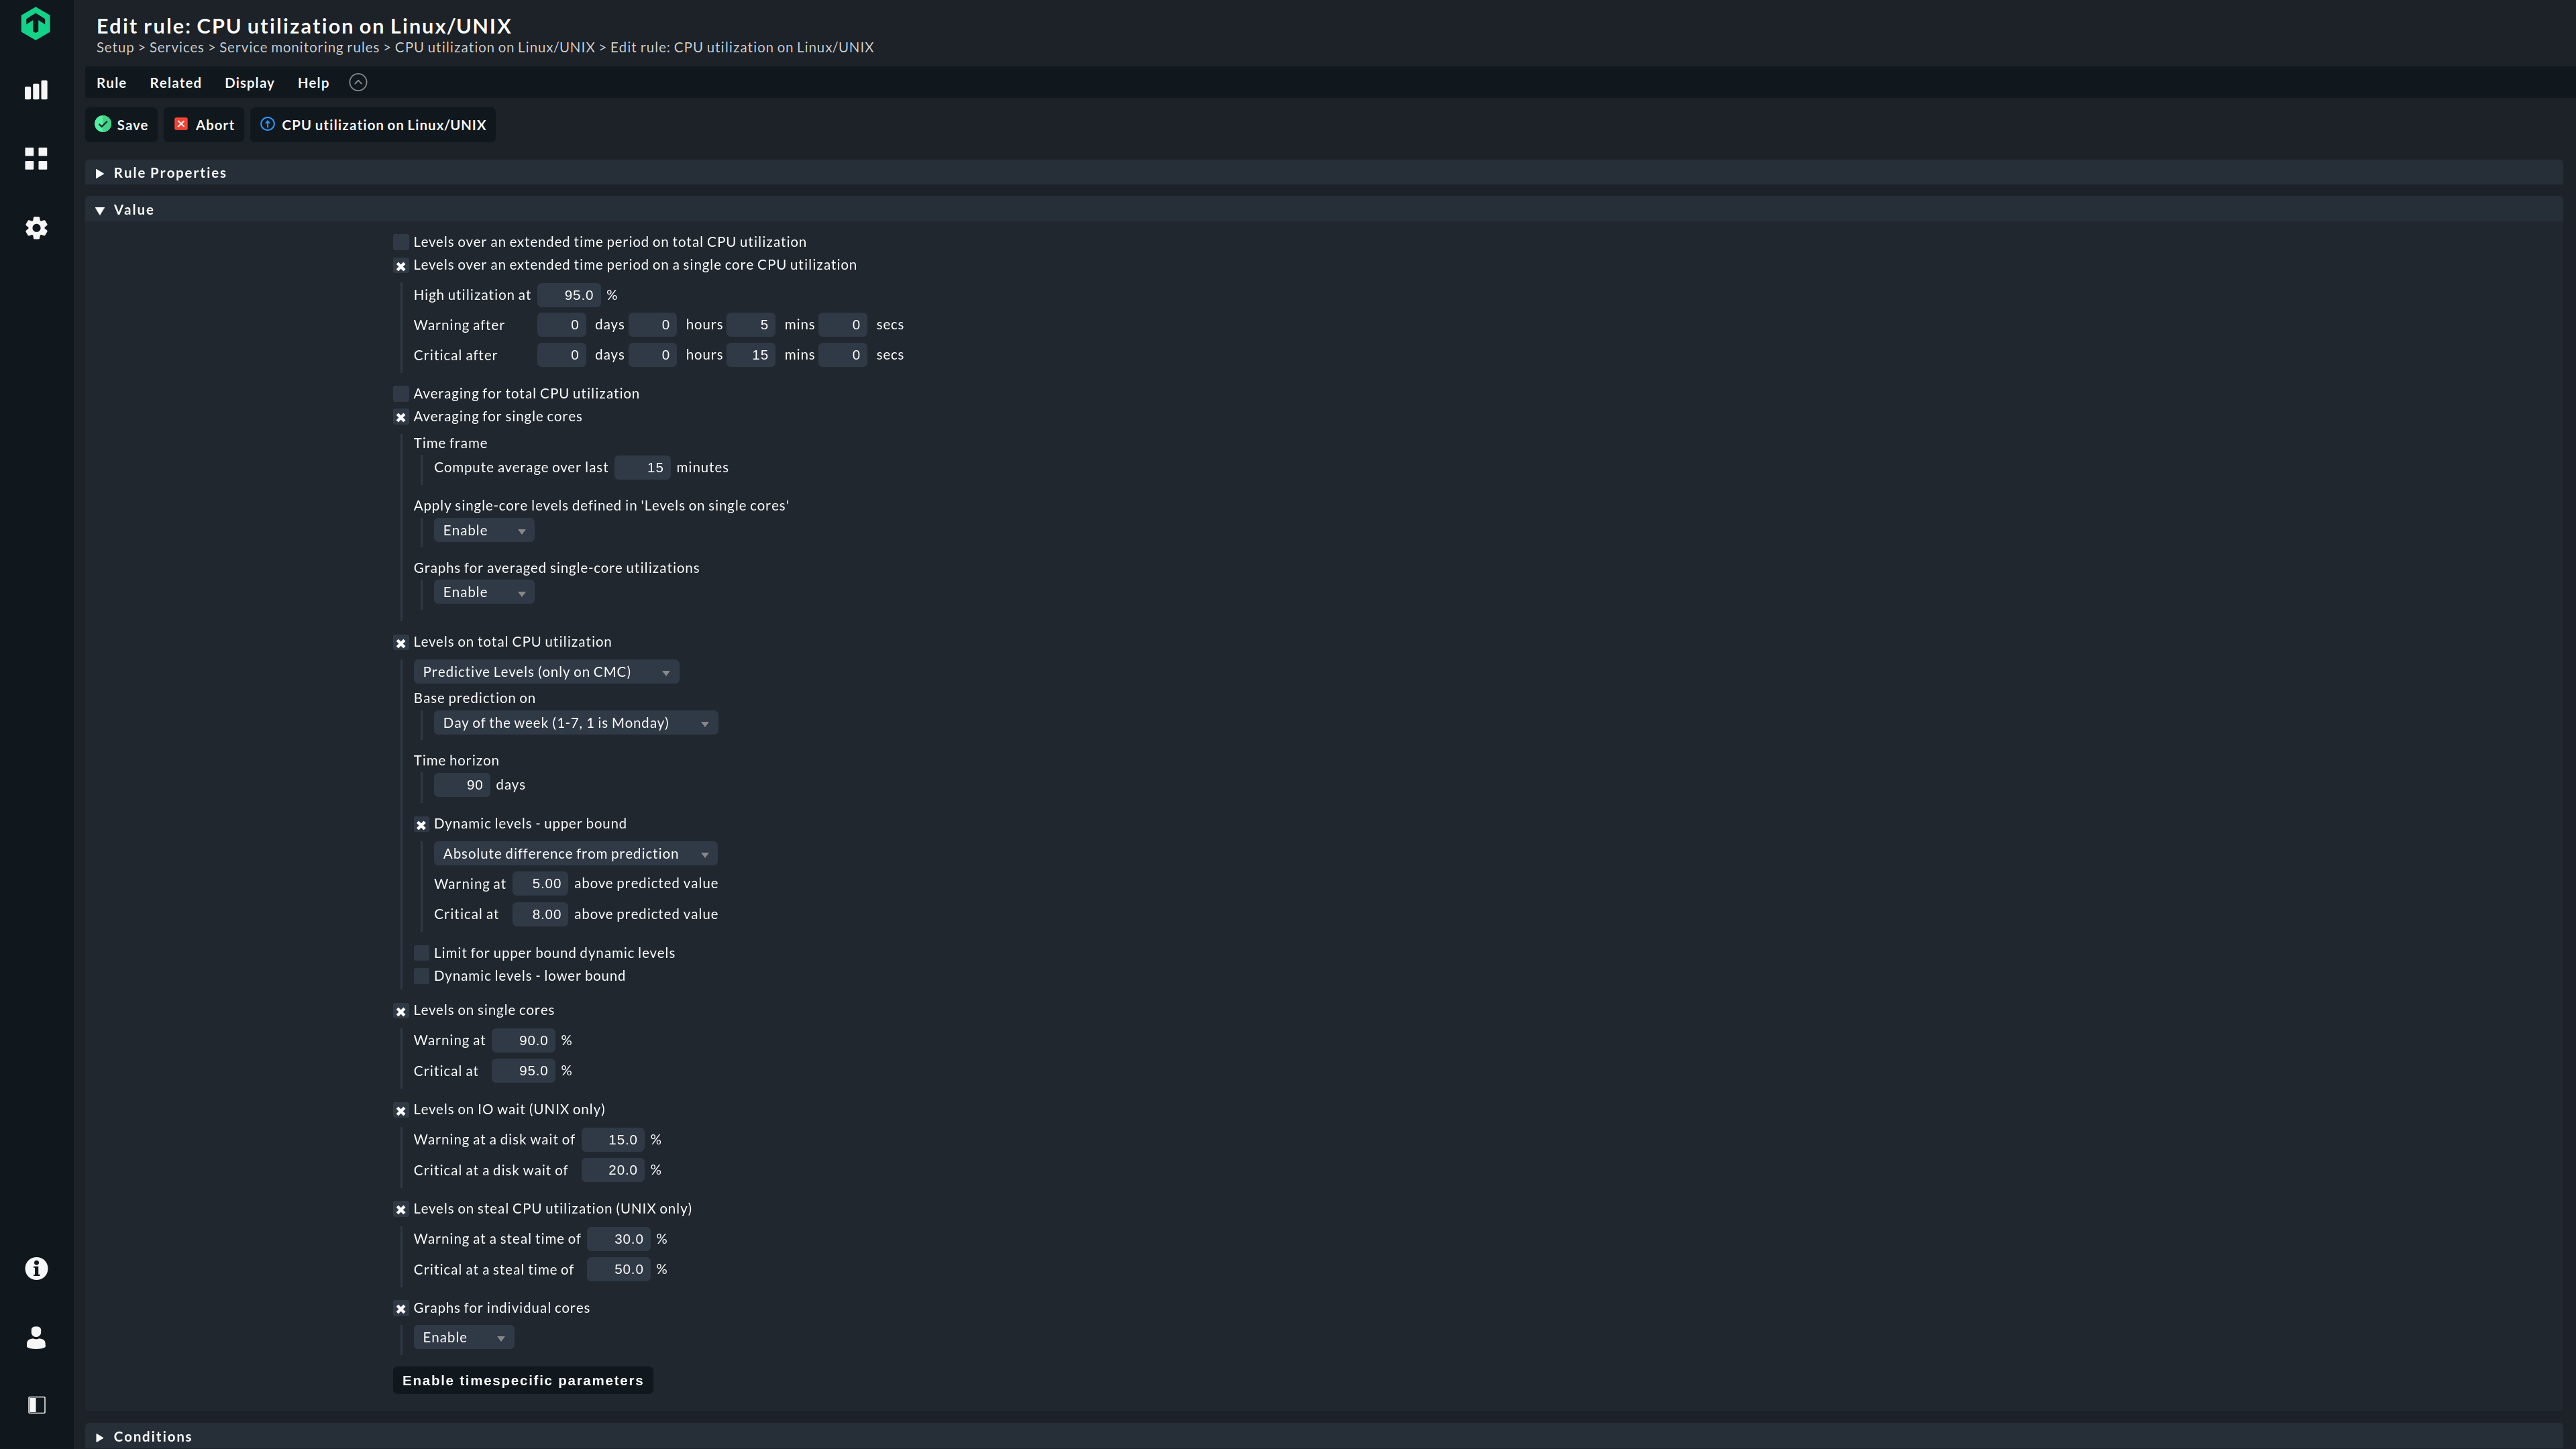
Implement CPU monitoring at scale with custom rules
Checkmk offers system administrators numerous configuration options for fine-tuning their CPU monitoring.
- Use pre-configured checks, set up Checkmk to automatically alert you when CPU utilization is too high
- Set custom thresholds according to your own specifications
- Implement CPU monitoring at scale in your IT environment with custom rules
Get a detailed overview of your CPU inventory
Checkmk enables you to see detailed information about CPU load and utilization of your systems at once. It provides you with the number of CPUs, their cores, the maximum speed and the average load they are running on, for each of the hosts that are being monitored. So you are able to overview all CPU related information in your environment at one glance.

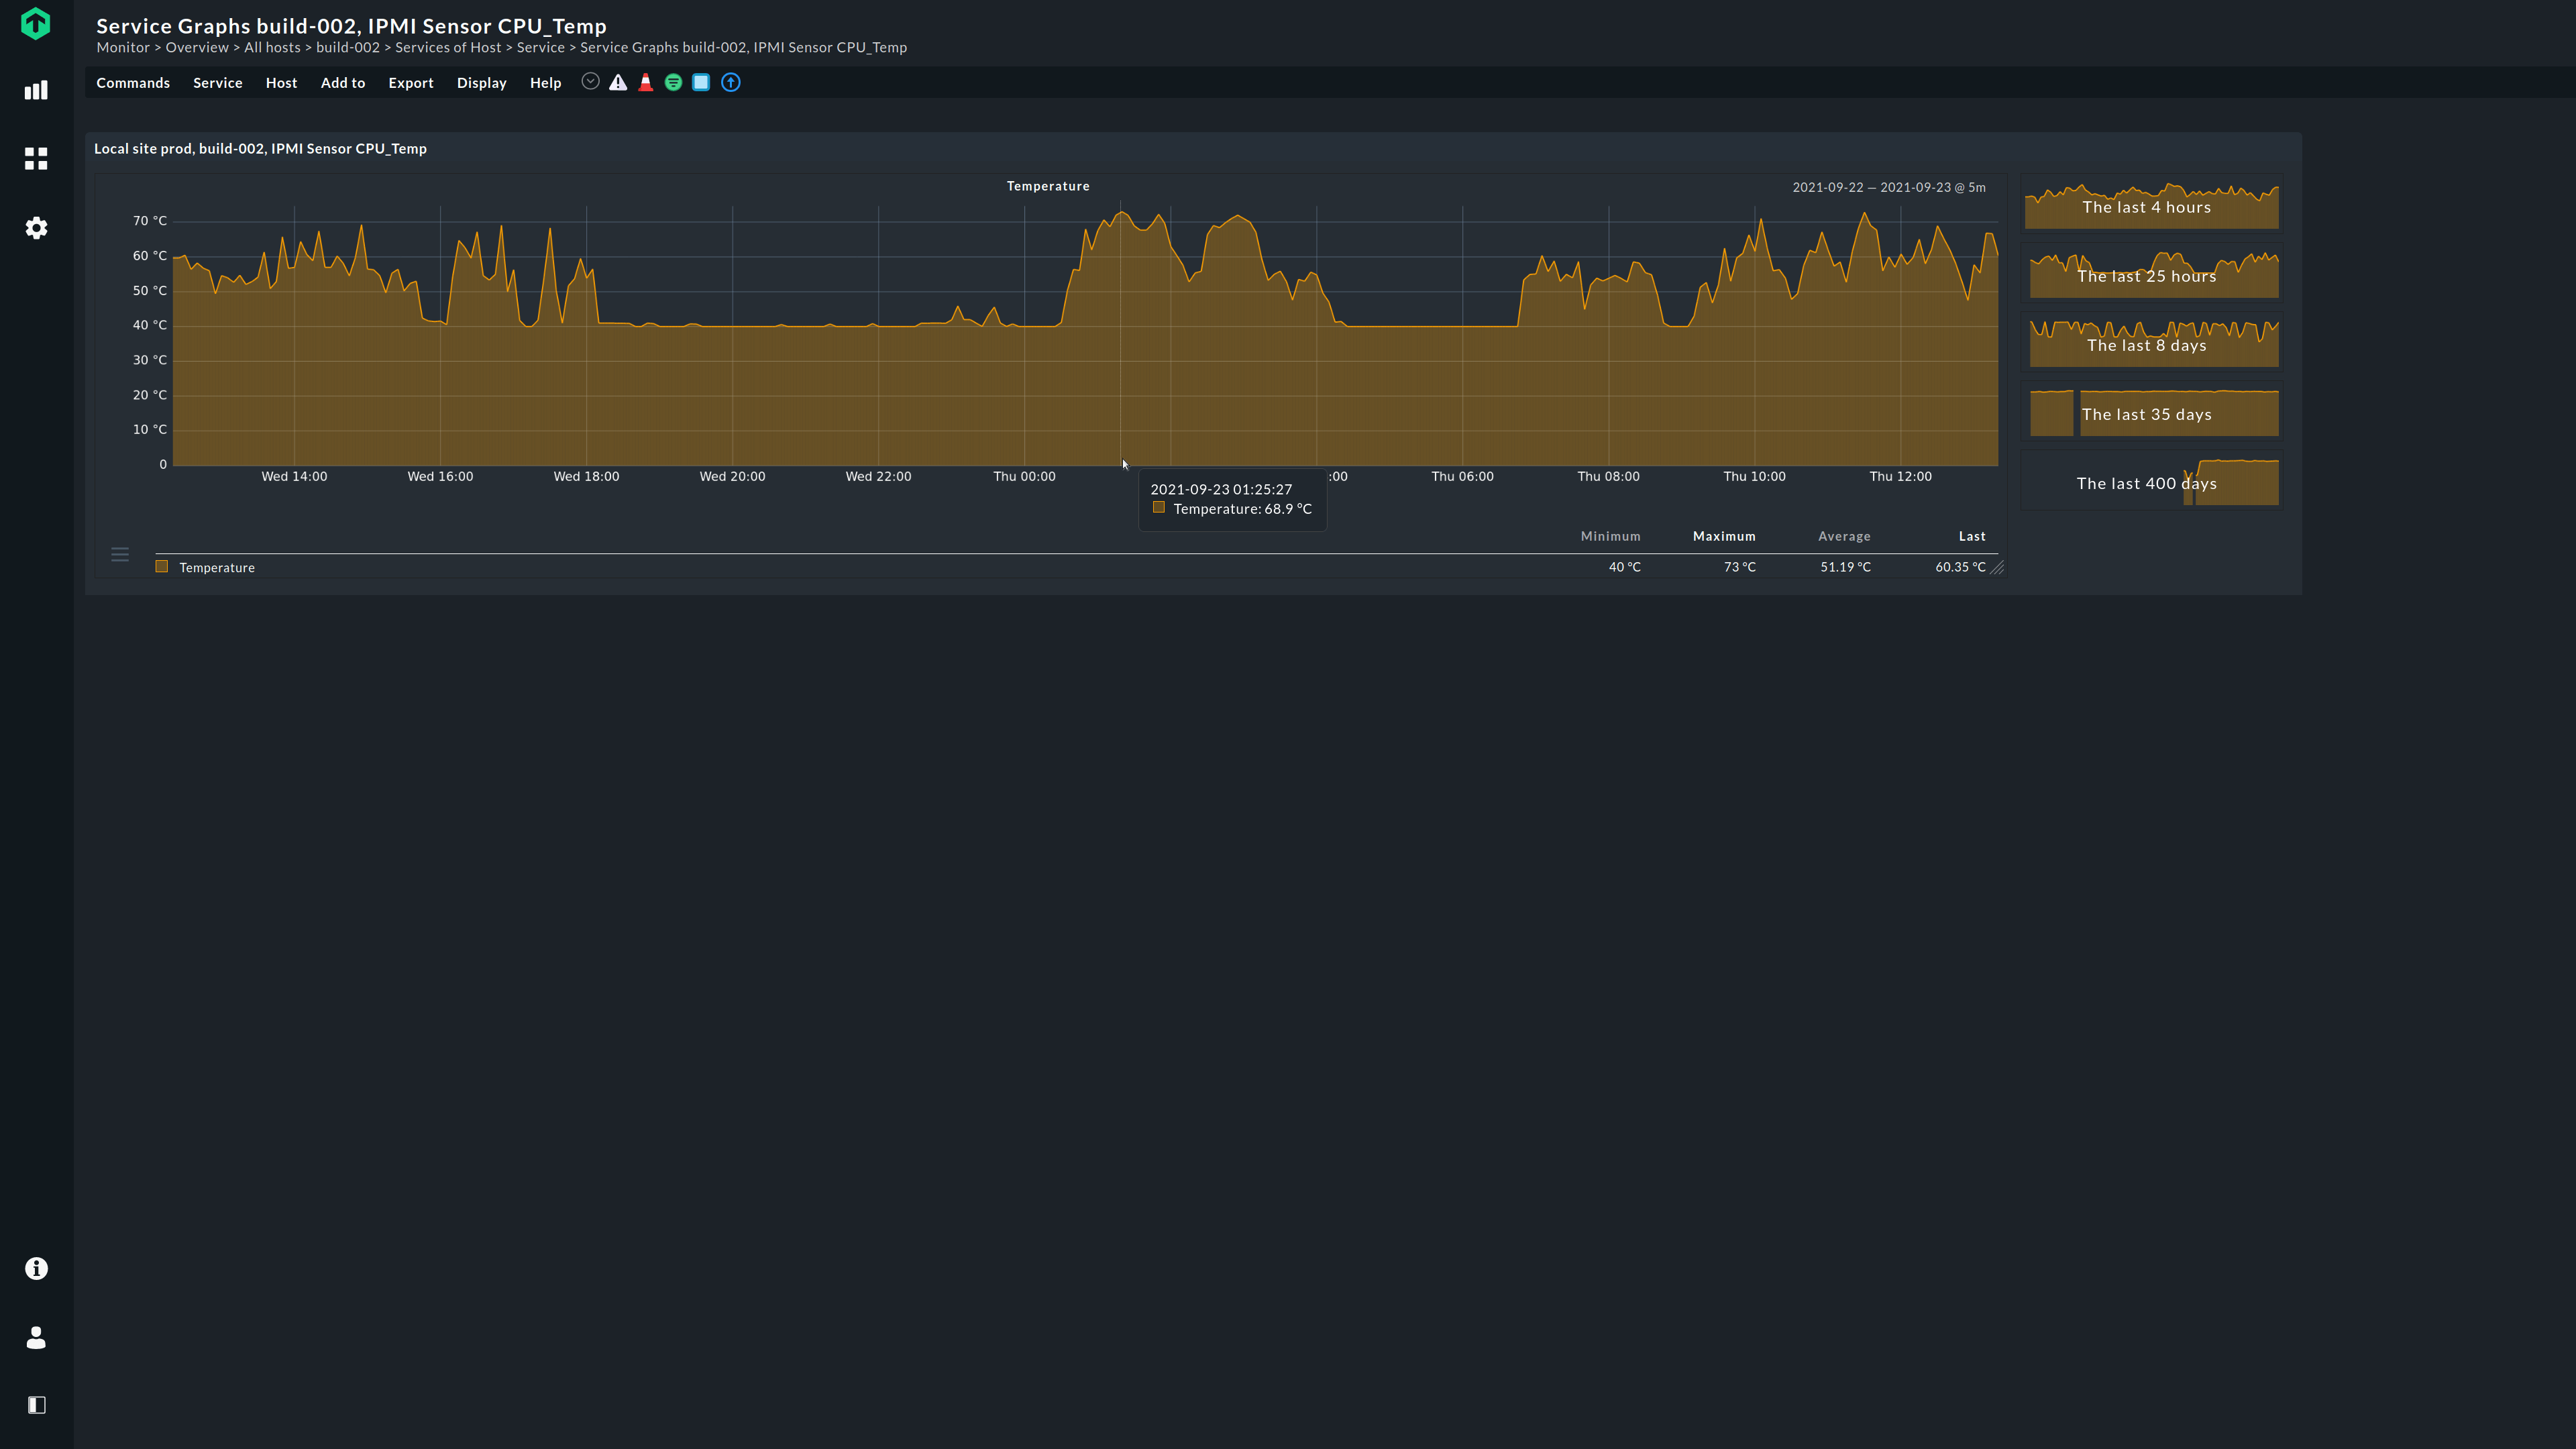
Monitor CPU temperatures
Checkmk supports a variety of vendors and sensors out of the box to check the temperatures of CPUs on your network.
- Protect your CPUs from damage due to overheating and overload by keeping an eye not only on utilization but also on CPU temperatures
- Set custom alerts for CPU temperature to prevent unwanted system downtimes
- Create custom dashboards to monitor CPU temperatures in your system and identify root-cause of high CPU temperature with respect to other metrics such as CPU load and utilization
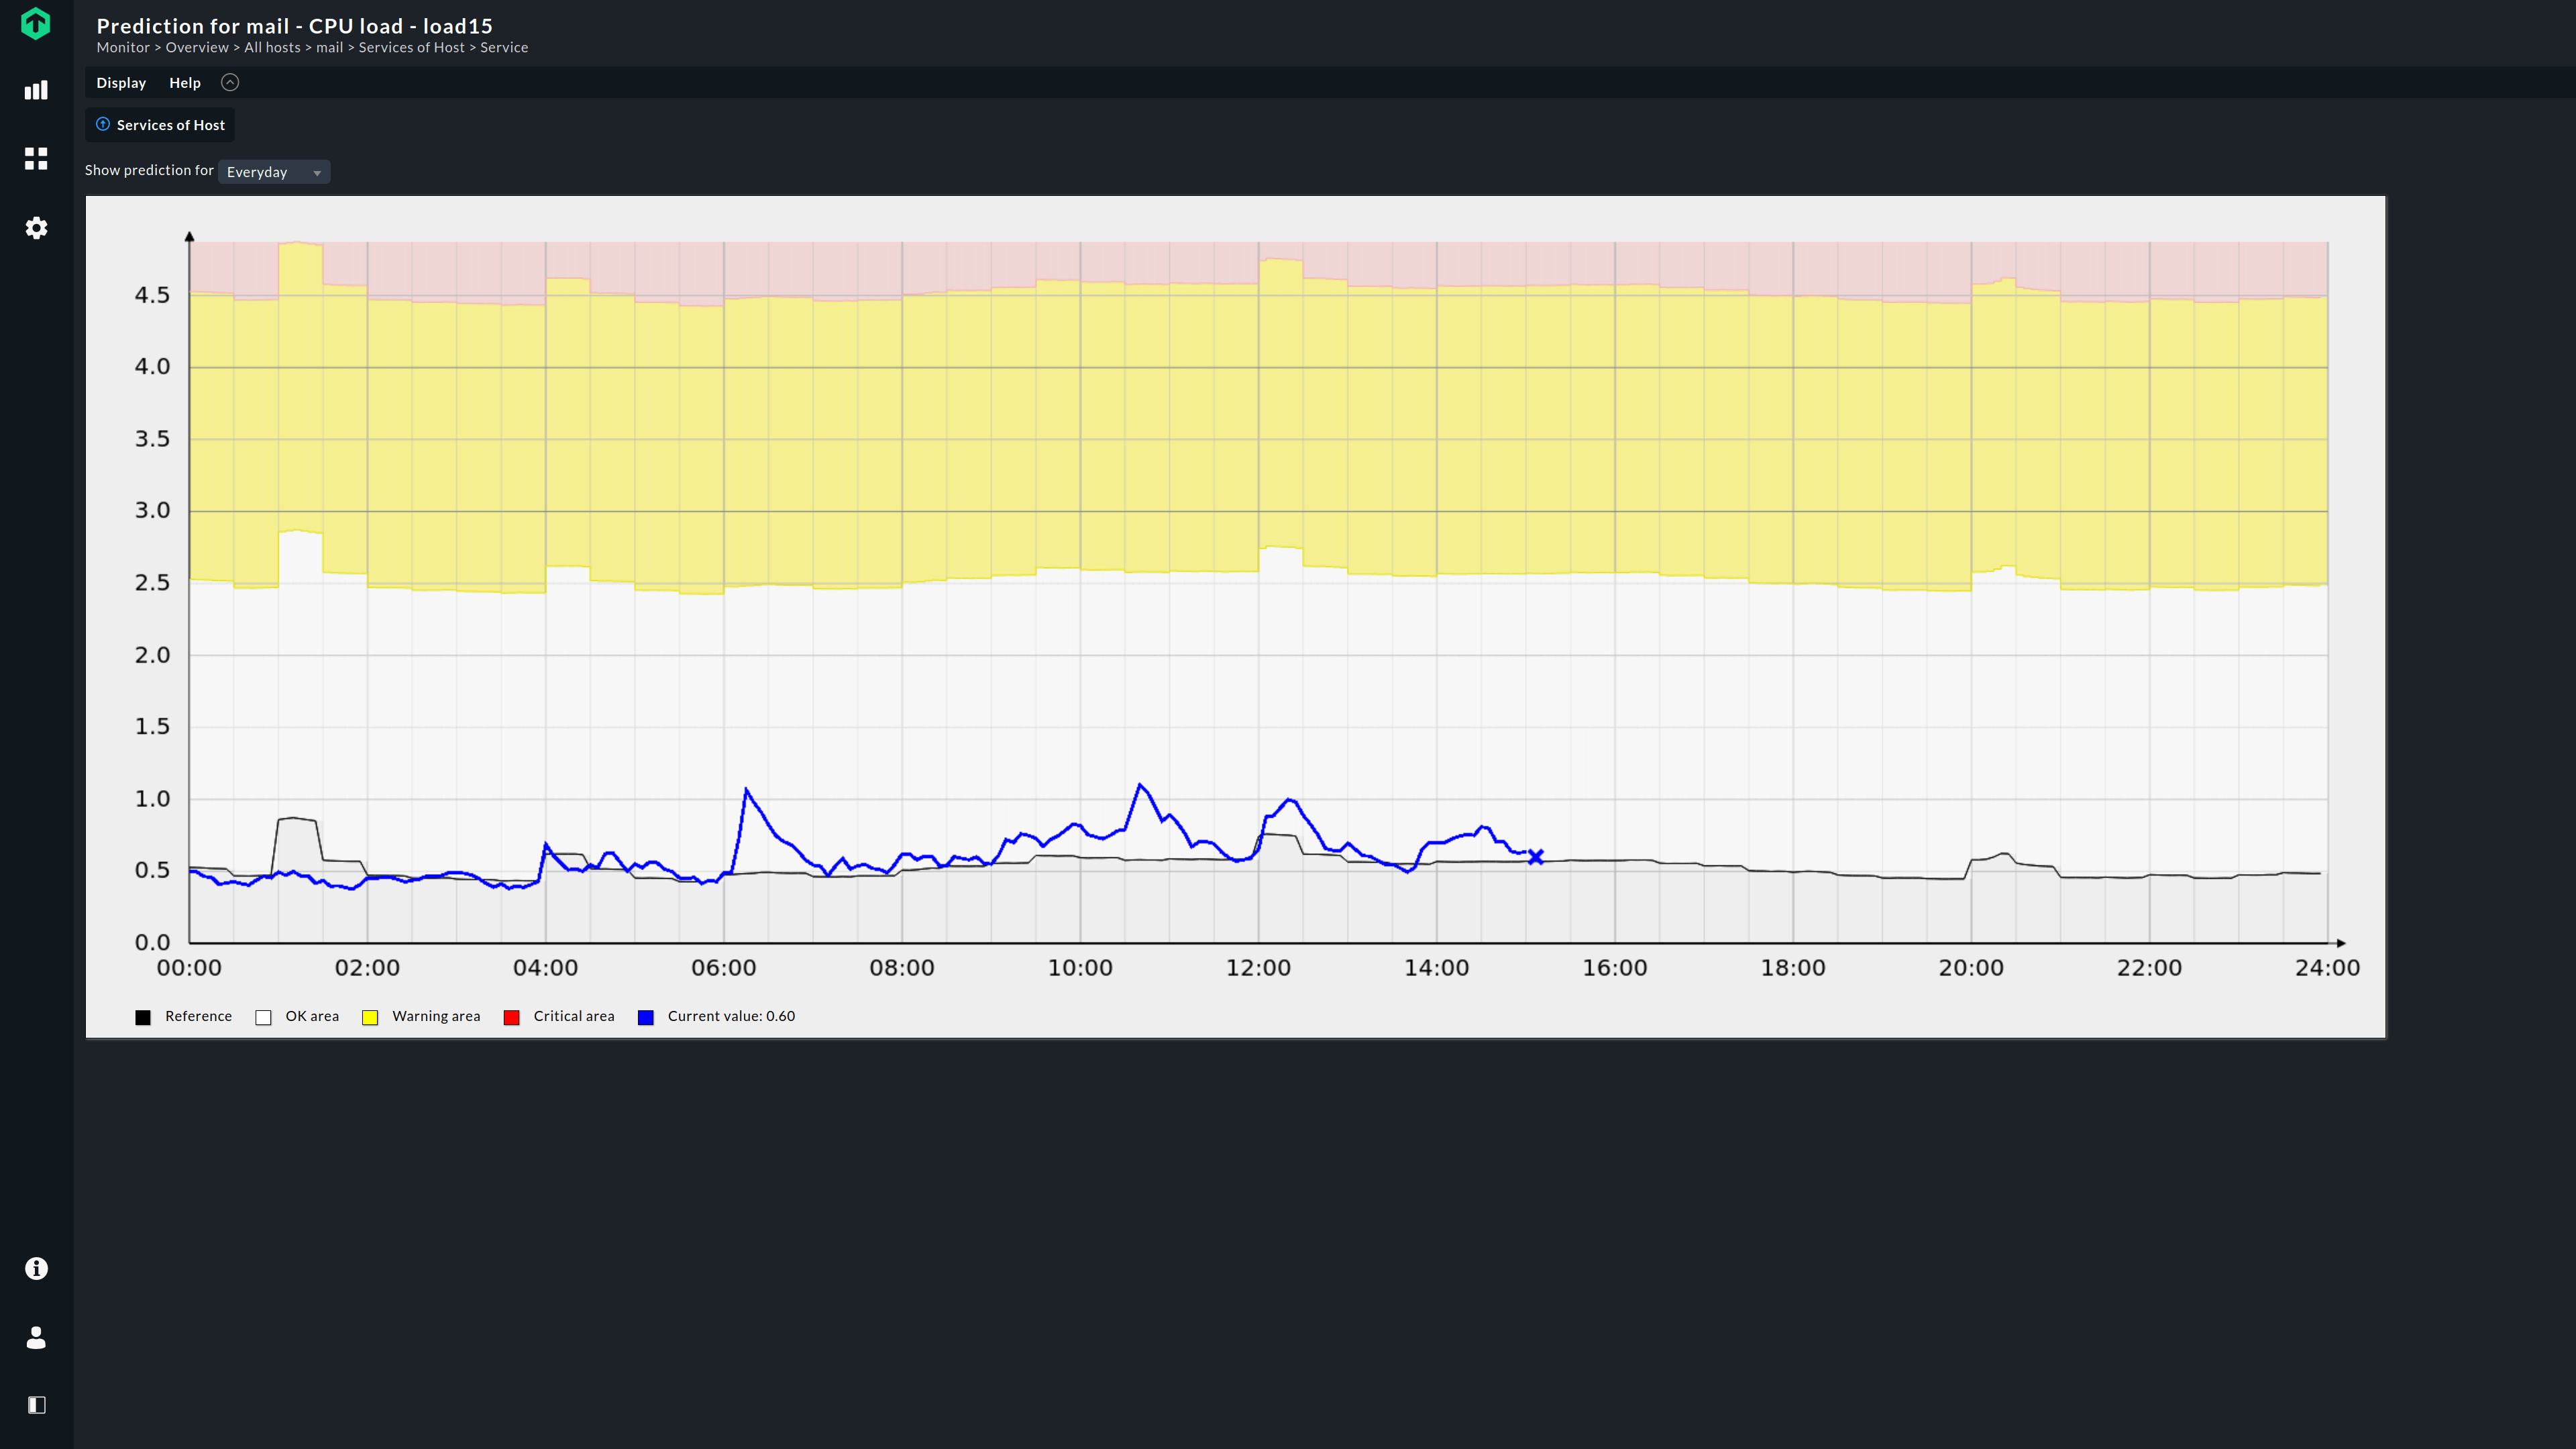
Forecast and predict CPU usages
Forecast and prevent overloading your systems with comprehensive monitoring of CPU utilization, CPU load and CPU temperatures and ensure optimal performance of your IT infrastructure.
- Generate CPU Load and CPU utilization forecasts based on historical data
- Prevent interruptions due to CPU performance bottlenecks
- Fix performance issues before they impact users
Monitor each CPU core individually
CPU monitoring should also contain the monitoring of the individual cores, to make sure all cores of a CPU are utilized evenly. Checkmk monitors the CPU load and utilization of every single CPU core.
- Monitor CPUs on Linux and Windows platforms individually
- Determine whether one of the cores is permanently utilized over a longer period of time
- Create an overview summarizing CPUs and CPU cores, along with their speed and the average utilization for each host in your monitoring environment

Supported applications and more
Bosch • Cisco • Dell • Arris • Alcatel • Arbor • ARUBA NETWORKS • Avaya • Bintec • Brocade • Casa • Decru • Extreme Network • F5 Networks • Fortinet • H3C Technologies (also 3Com) • Hewlett-Packard (HP) • Huawei • IBM • Infoblox • Innovaphone • Juniper Networks • Sophos • TP-LINK • Fujitsu • Siemens • EMC • Hitachi • NetApp • Synology Inc. • Telephony • Barracuda • Citrix Netscaler • Couchbase • McAfee • Pulse Secure • Stormshield • AWS • Azure • Docker • Kubernetes • cAdvisor • HP-UX
Reasons to choose Checkmk

Compatible with almost anything
Checkmk supports the monitoring of almost every operating system: Linux, Windows, macOS, but also many other OS like BSD.

Ultra-scalable & Flexible
One Checkmk instance can monitor thousands of hosts and can easily scale horizontally with our distributed monitoring setup.

Intelligent Monitoring
Checkmk intelligently discovers which metrics to monitor on your CPUs without needing any additional configuration.
Trusted by global brands and local organizations worldwide


Resources
Ready to explore the full feature set of Checkmk?
Download the free trial and see it in action.