Server monitoring software for Windows and Linux hosts, physical and virtual
Checkmk is a full-stack monitoring and observability platform that provides server monitoring for mixed Windows and Linux hosts, on-premises and in the cloud. Those hosts can run on physical hardware or as virtual machines on VMware, Hyper-V, or Proxmox. Server monitoring software collects availability, performance, and resource data from your servers, so you catch a full disk or a stalled service before anyone opens a ticket. How that works in depth is covered in the server monitoring guide.
Weighing several options against each other? Start with our roundup of the best server monitoring tools.

Below is what Checkmk itself covers:
- Monitor any type of server (web, mail, database servers, and more)
- Flexible server monitoring through the use of 2,000+ built-in integrations
- Easy-to-use configuration with auto-discovery
- Monitoring for VMware, Hyper-V, and Proxmox hosts and clusters
- Native agents for Windows, Linux, and many more operating systems
- Agentless monitoring via SNMP, IPMI, Redfish, and vendor APIs
- Active checks for network services over TCP/UDP (HTTP, FTP, LDAP, IMAP, SMTP, SSH, and more)
- Measurement intervals shorter than 1 minute in the commercial editions
- Free Checkmk Community edition, which performs best in environments of up to around 100 hosts; Checkmk Pro and Ultimate scale to 100,000+ hosts
Some of the vendors we support





What does Checkmk monitor on Windows and Linux servers?
Checkmk monitors Windows and Linux systems from one place, whether they run on physical hardware or as virtual machines on VMware, Hyper-V, or Proxmox. On every host it tracks CPU, memory, disk, network interfaces, and filesystems, along with the processes and the mail, web, and database services running on it.
Linux server monitoring
Checkmk monitors Linux hosts with a low-footprint native agent: a shell script you can open and read. It supports Debian, Ubuntu, Red Hat Enterprise Linux, SUSE Linux Enterprise Server, and other distributions.
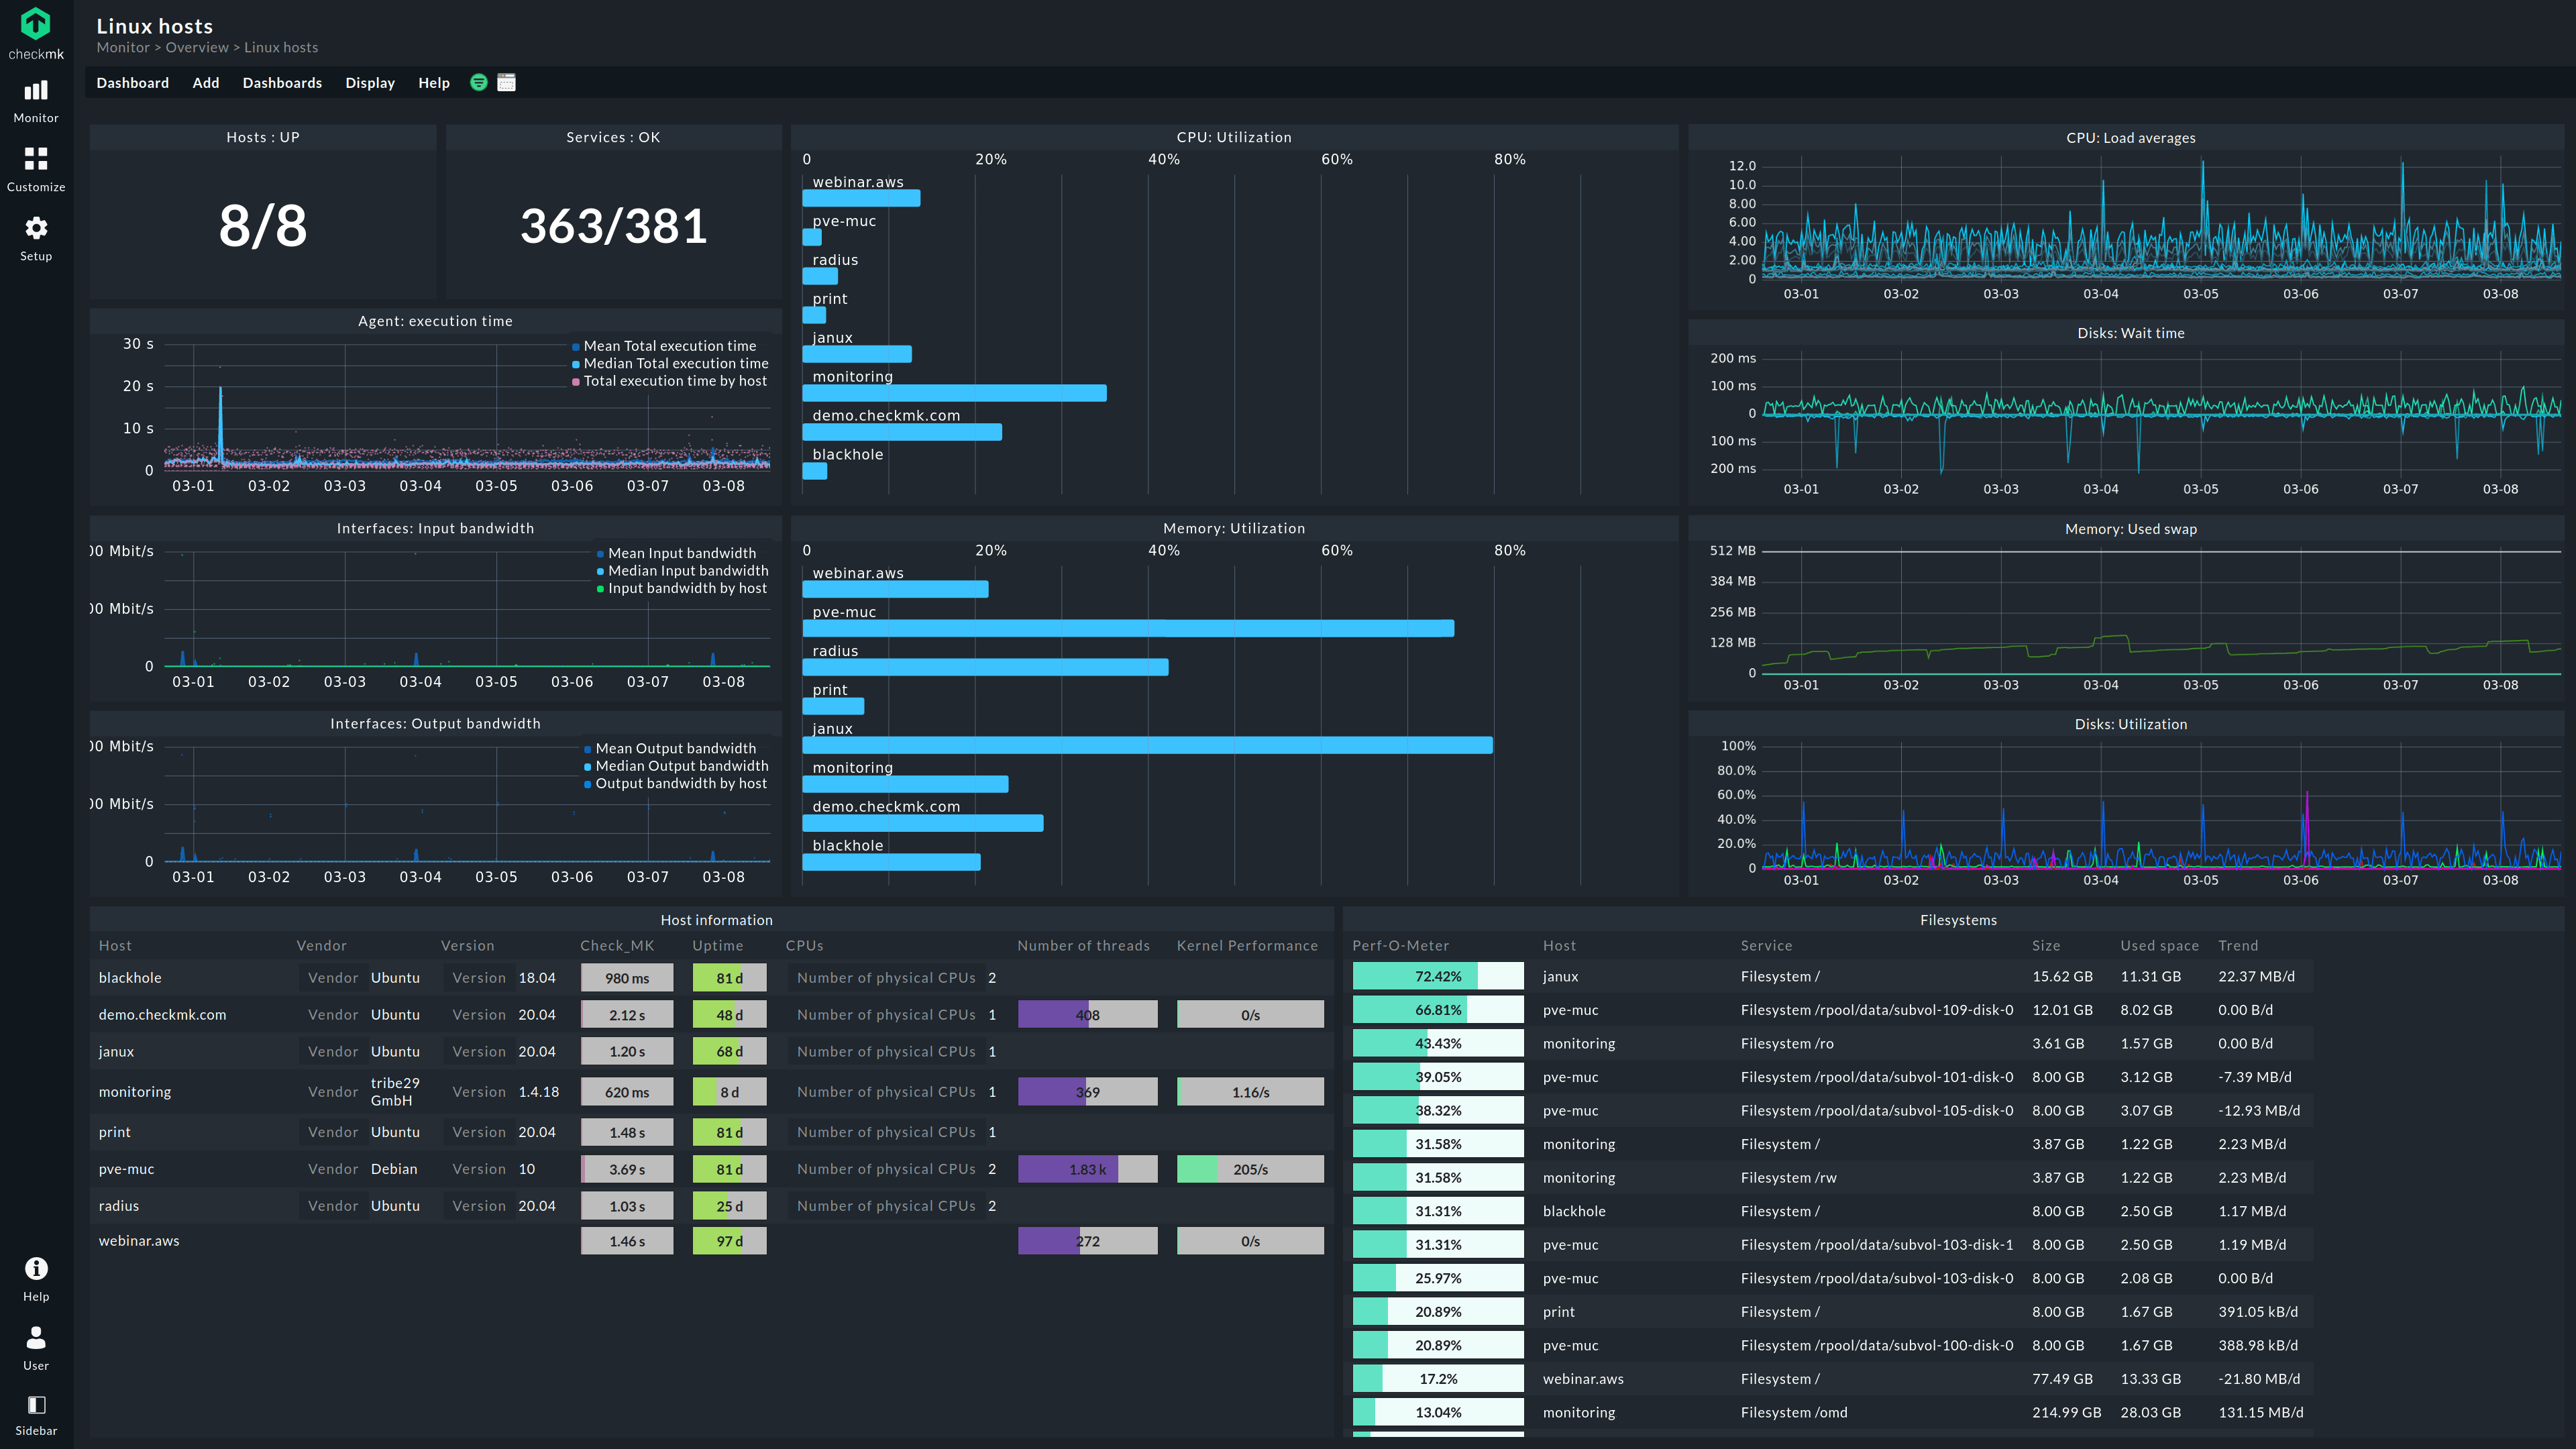

Windows server monitoring
On Windows, Checkmk’s native agent monitors services and processes and evaluates the Windows Event Log, with the option to forward entries to the Event Console. The agent supports 64-bit Windows Server 2016, 2019, 2022, and 2025. The Windows server monitoring guide goes into more depth.
Virtual server and hypervisor monitoring
A virtual machine’s guest operating system is monitored exactly like a physical server: the same Windows or Linux agent, the same checks, whether the VM runs on VMware, Hyper-V, or Proxmox. Checkmk also monitors the hypervisors themselves: VMware ESXi and vCenter, Hyper-V, and Proxmox hosts and clusters. On Proxmox nodes, Checkmk tracks CPU and memory overcommitment too.
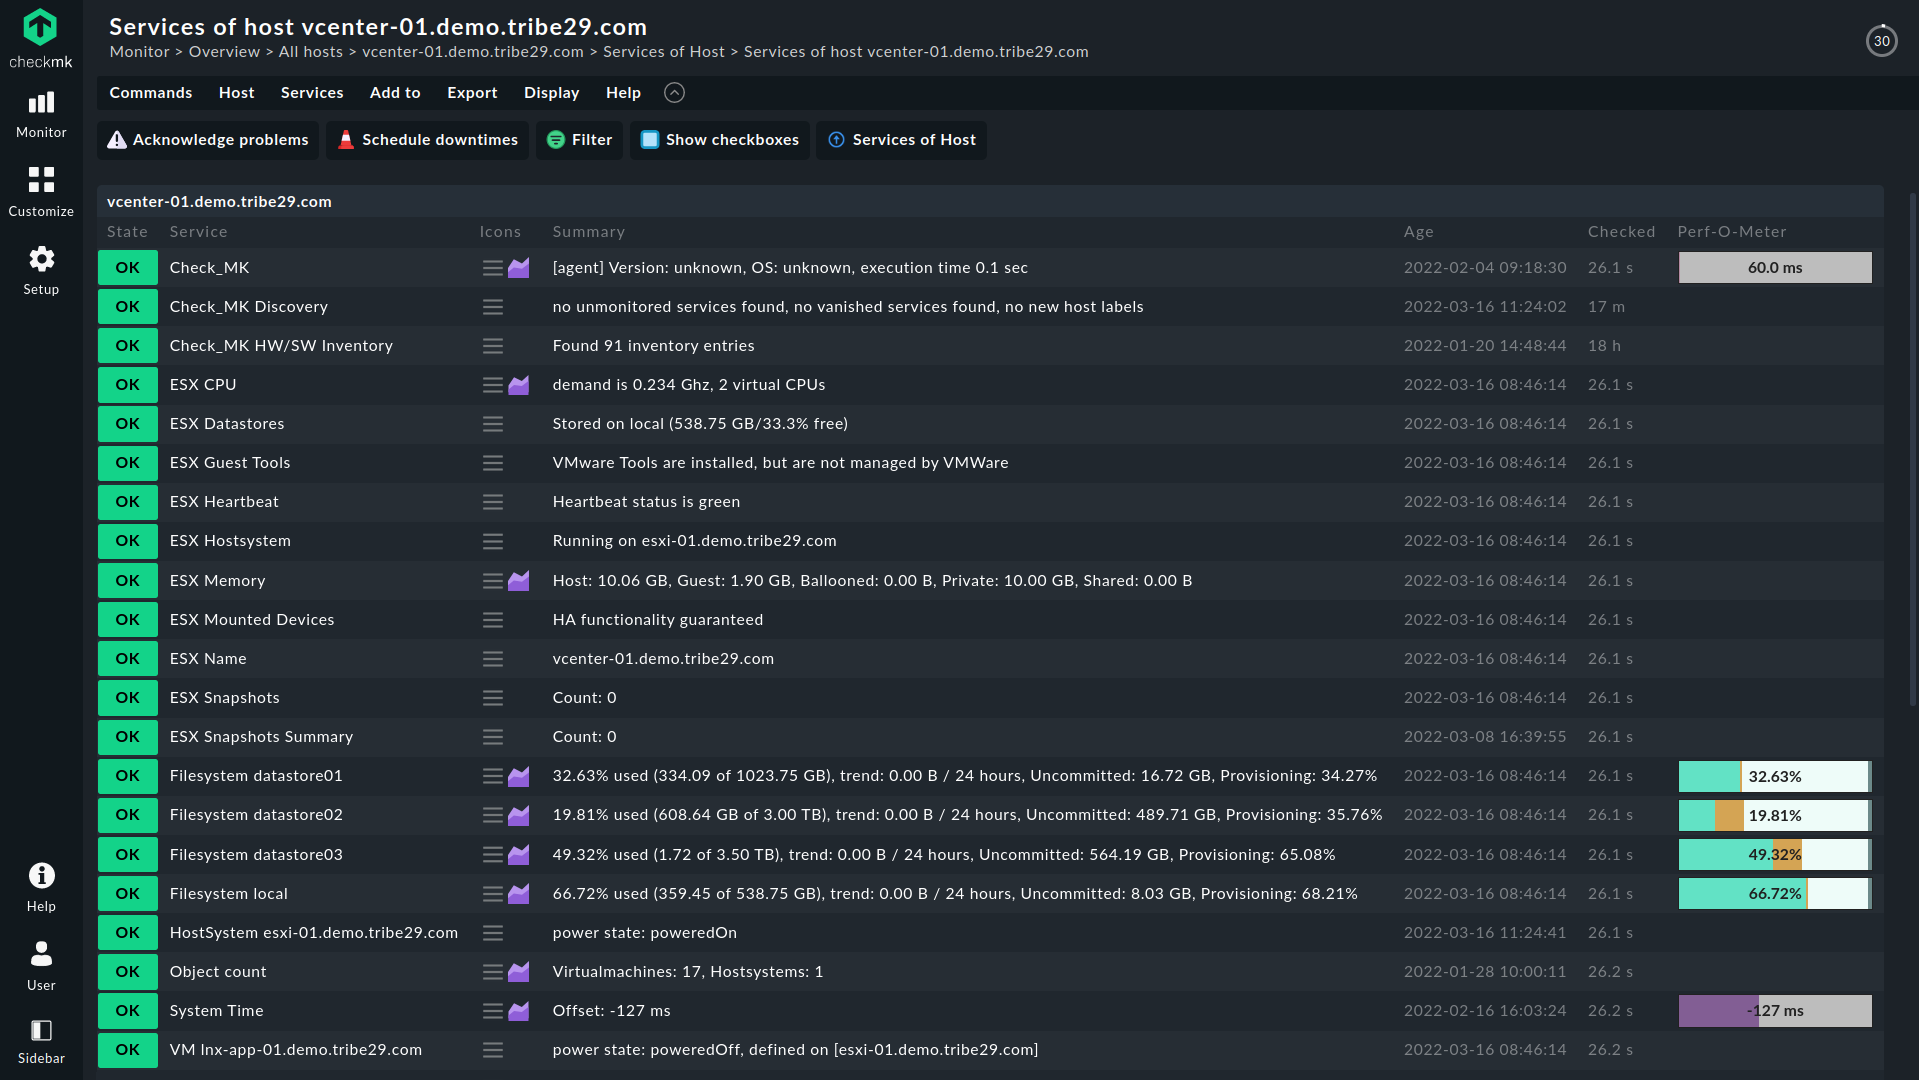
How Checkmk collects server data, with and without an agent
Checkmk collects server data through a native agent, agentlessly where no agent runs, and through active checks that test network services from the outside.
- Native agent: the default on Windows and Linux. A lightweight program that returns the fullest depth of data, including processes, log files, and local services.
- Agentless: where an agent can't be installed or isn't the best fit. Checkmk queries the host over SNMP, IPMI, or Redfish, or through vendor APIs. On physical servers, IPMI and Redfish read the hardware state from the management board, which keeps reporting when the operating system is down.
- Active checks: Checkmk connects to network services such as HTTP, FTP, LDAP, IMAP, SMTP, and SSH from the outside and checks that they respond.
The native agent sends its data in one of two modes:
- Pull (default): the server contacts each agent on TCP 6556, an inbound connection to the host, encrypted with TLS.
- Push: for hosts the server can't reach, such as segmented networks or cloud VMs. The agent sends data out, with no inbound connection. Push agents are in Checkmk Ultimate and Checkmk Cloud.
Centralized agent management
Checkmk builds the agent packages for your whole server fleet from the central site, and configures them per host or group of hosts. The Agent Bakery handles this, and after the first installation it keeps the agents updated automatically, so you don't log in to every host to keep them current. It is included from Checkmk Pro.
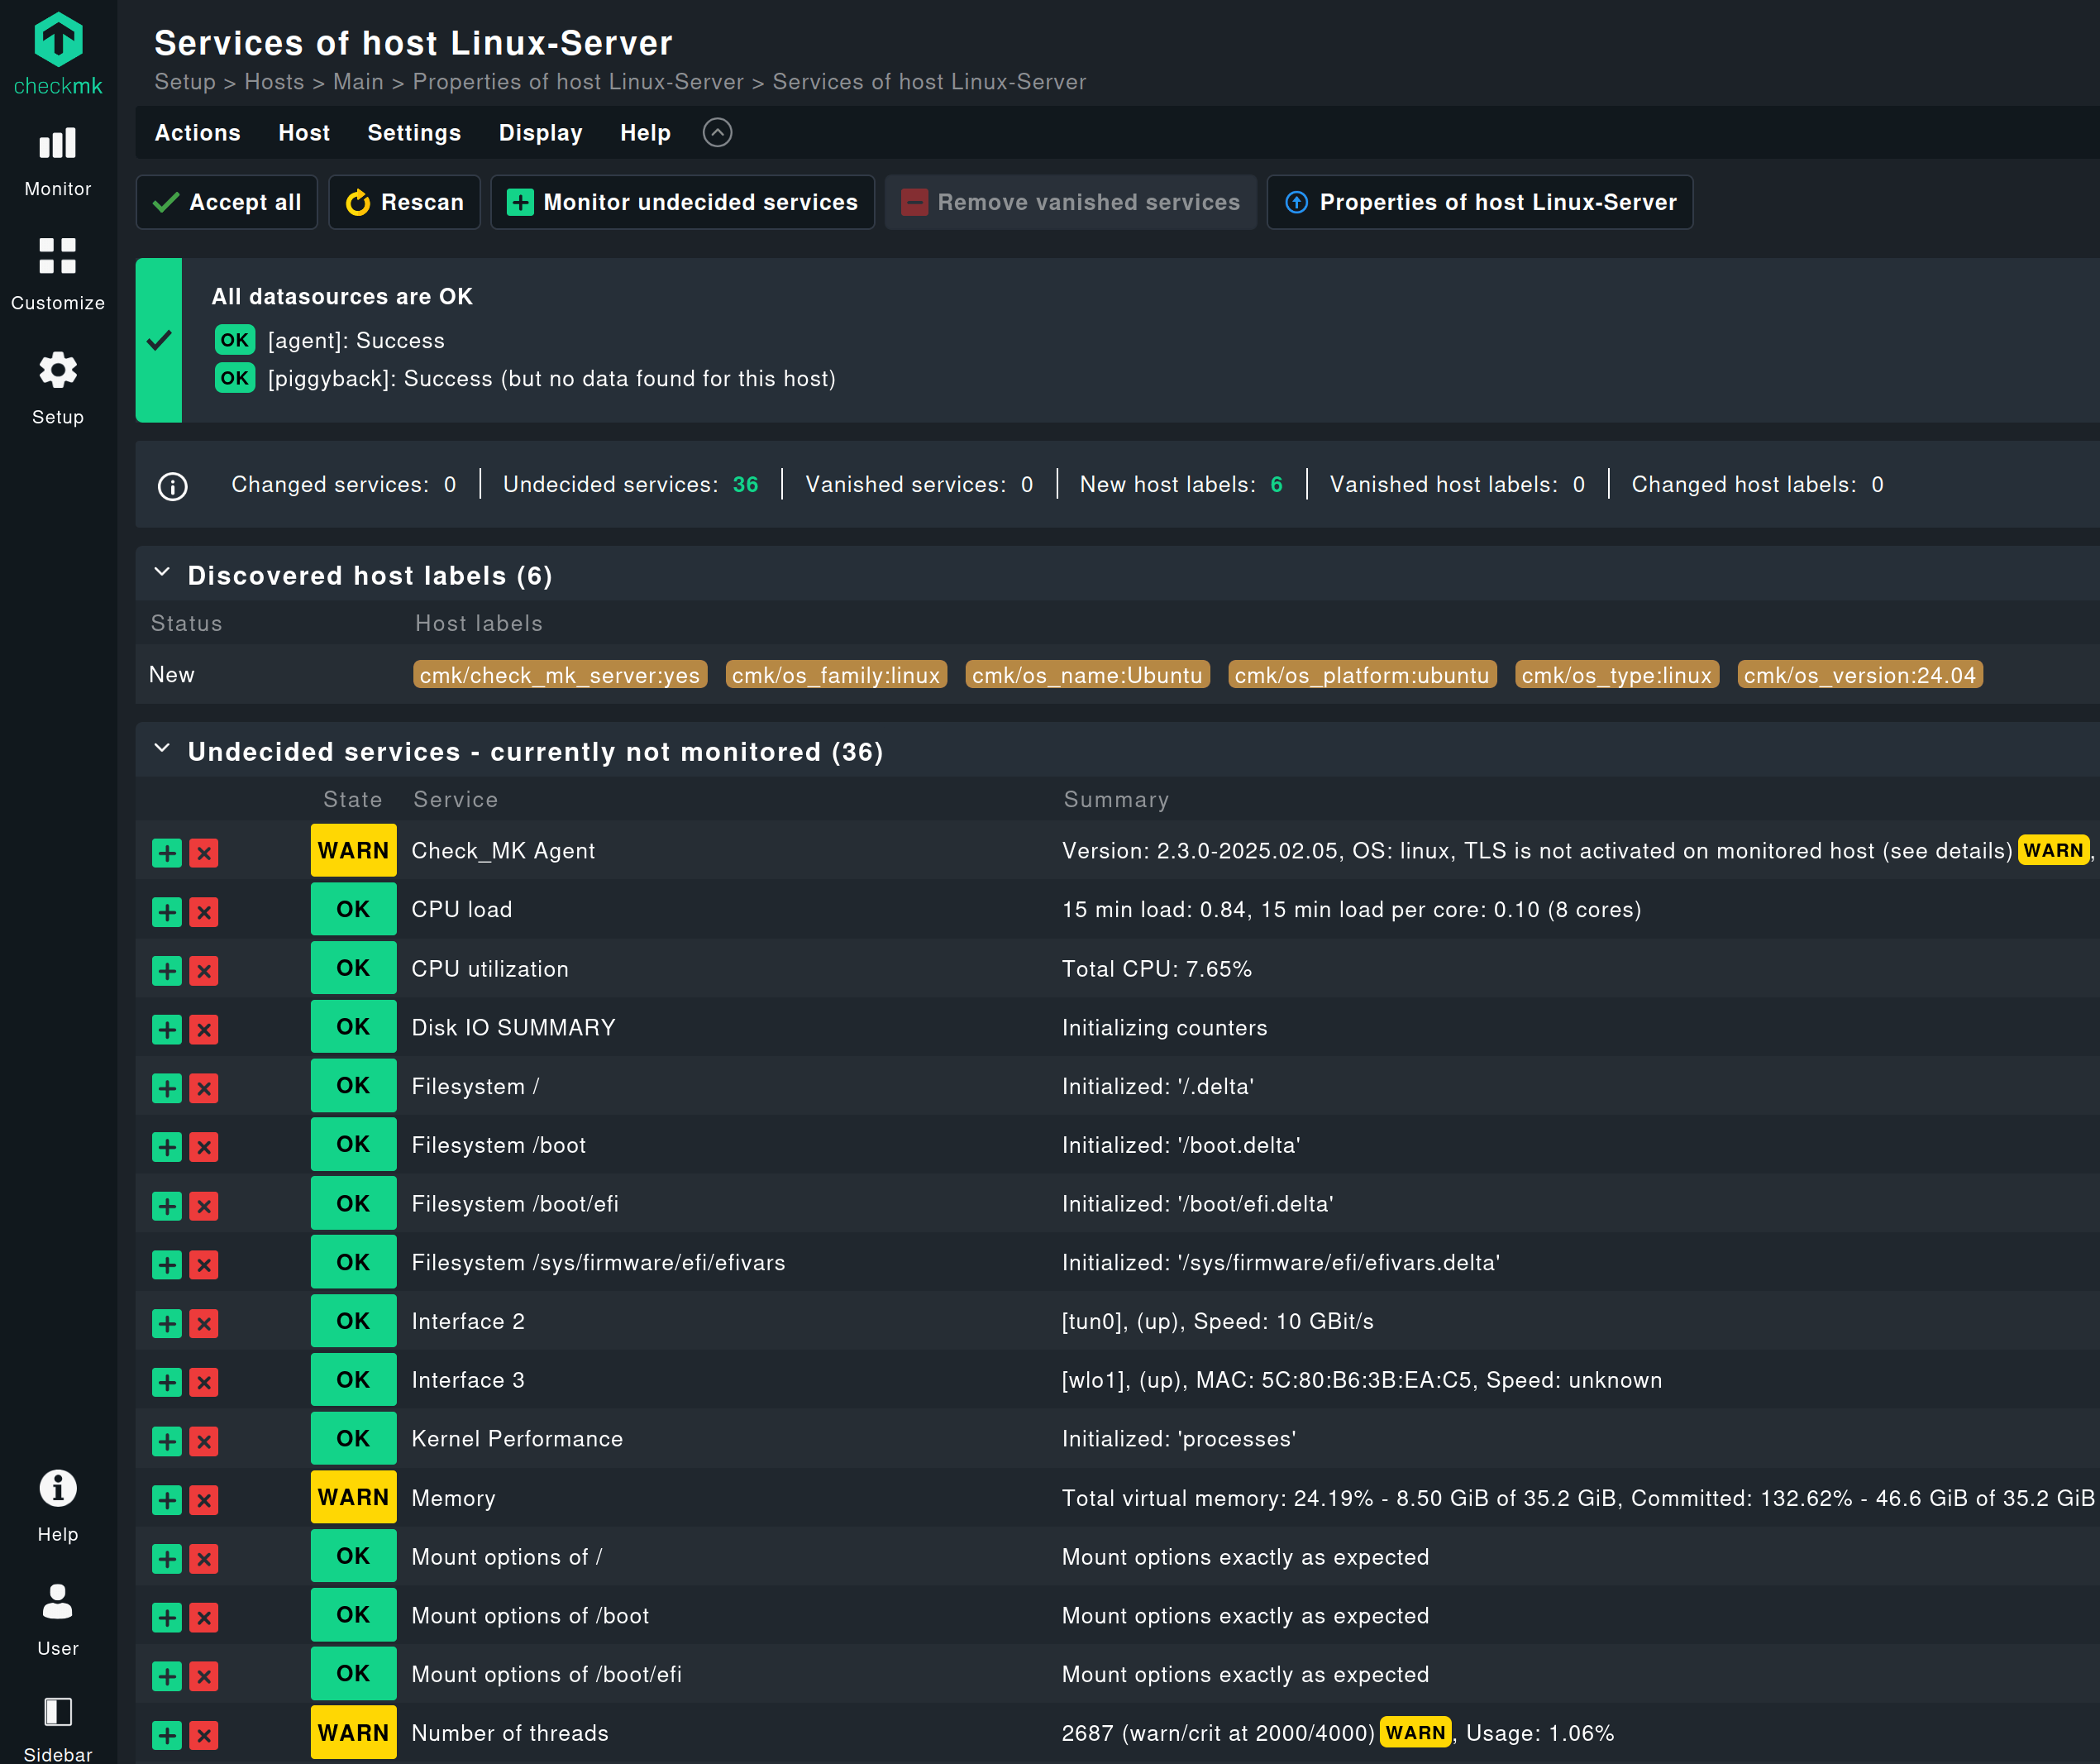
Auto-discovery and alerting for mail, web, database, and application servers
Checkmk discovers which services to monitor on a server automatically and proposes them with sensible default thresholds. Instead of configuring each one from scratch, you review what it finds and accept it.
Its 2,000+ built-in integrations cover the server types you run, with dedicated checks for each:
- Mail servers: Microsoft Exchange and Postfix, plus POP3, IMAP, and SMTP checks
- Web servers: Apache, Nginx, and Microsoft IIS, plus HTTP and SSL certificate checks
- Database servers: MySQL/MariaDB, Microsoft SQL Server, PostgreSQL, Oracle, MongoDB, IBM DB2, IBM Informix, SAP HANA, Azure SQL Database, and Amazon RDS
- Application servers: Java application servers such as Tomcat, JBoss, and WebLogic
- FTP servers: availability and response time
A regular discovery check automatically flags services that have appeared or vanished since the last scan, so a new database on an existing host shows up the next time it runs and the list stays current as your servers change.
Thresholds are set by rules that apply across your whole fleet, not host by host. In the commercial editions, you can also switch on dynamic thresholds for metrics such as CPU load, disk throughput, and network traffic, so the limits follow each metric’s normal pattern over the day and week. Notifications go out through built-in channels such as email, Slack, Microsoft Teams, or PagerDuty, with rules that control who is alerted and when.
Hardware and software inventory across your servers
Checkmk’s hardware and software inventory, once switched on, automatically records asset details on your monitored servers: installed software and versions, plus hardware such as CPU, RAM, and BIOS.
- Search the inventory across all hosts to identify servers running outdated software versions.
- Inventory history records every change, such as a BIOS update or a RAM upgrade, with a date, and can alert you when hardware or software changes unexpectedly.
- Export the data to your CMDB through the inventory API, so it stays current without a second scanner.
HW/SW inventory is included in every edition, Community included.

Service-based pricing and when to upgrade from Community
Checkmk prices infrastructure monitoring by service, with no per-host fees, and offers a free Community edition for small infrastructures and commercial editions for large-scale monitoring.
A service is any single aspect of a host, such as a filesystem, a running process, or CPU usage. As a rough sizing guide, the average host runs about 30 services. Because you pay per service, a host with few services costs far less to monitor than a busy database server.
- Checkmk Community is free forever, with no license cap, and performs best in environments of up to around 100 hosts.
- The commercial editions, Checkmk Pro, Ultimate, and Cloud, run on the Checkmk Micro Core, which is up to 80% more resource efficient than Community’s Nagios core. All three add advanced analytics, reporting, and automation; Pro and Ultimate also include distributed monitoring.
- Checkmk Pro starts at $275 per month, billed annually, and scales to 100,000+ hosts.
See Checkmk’s full pricing.
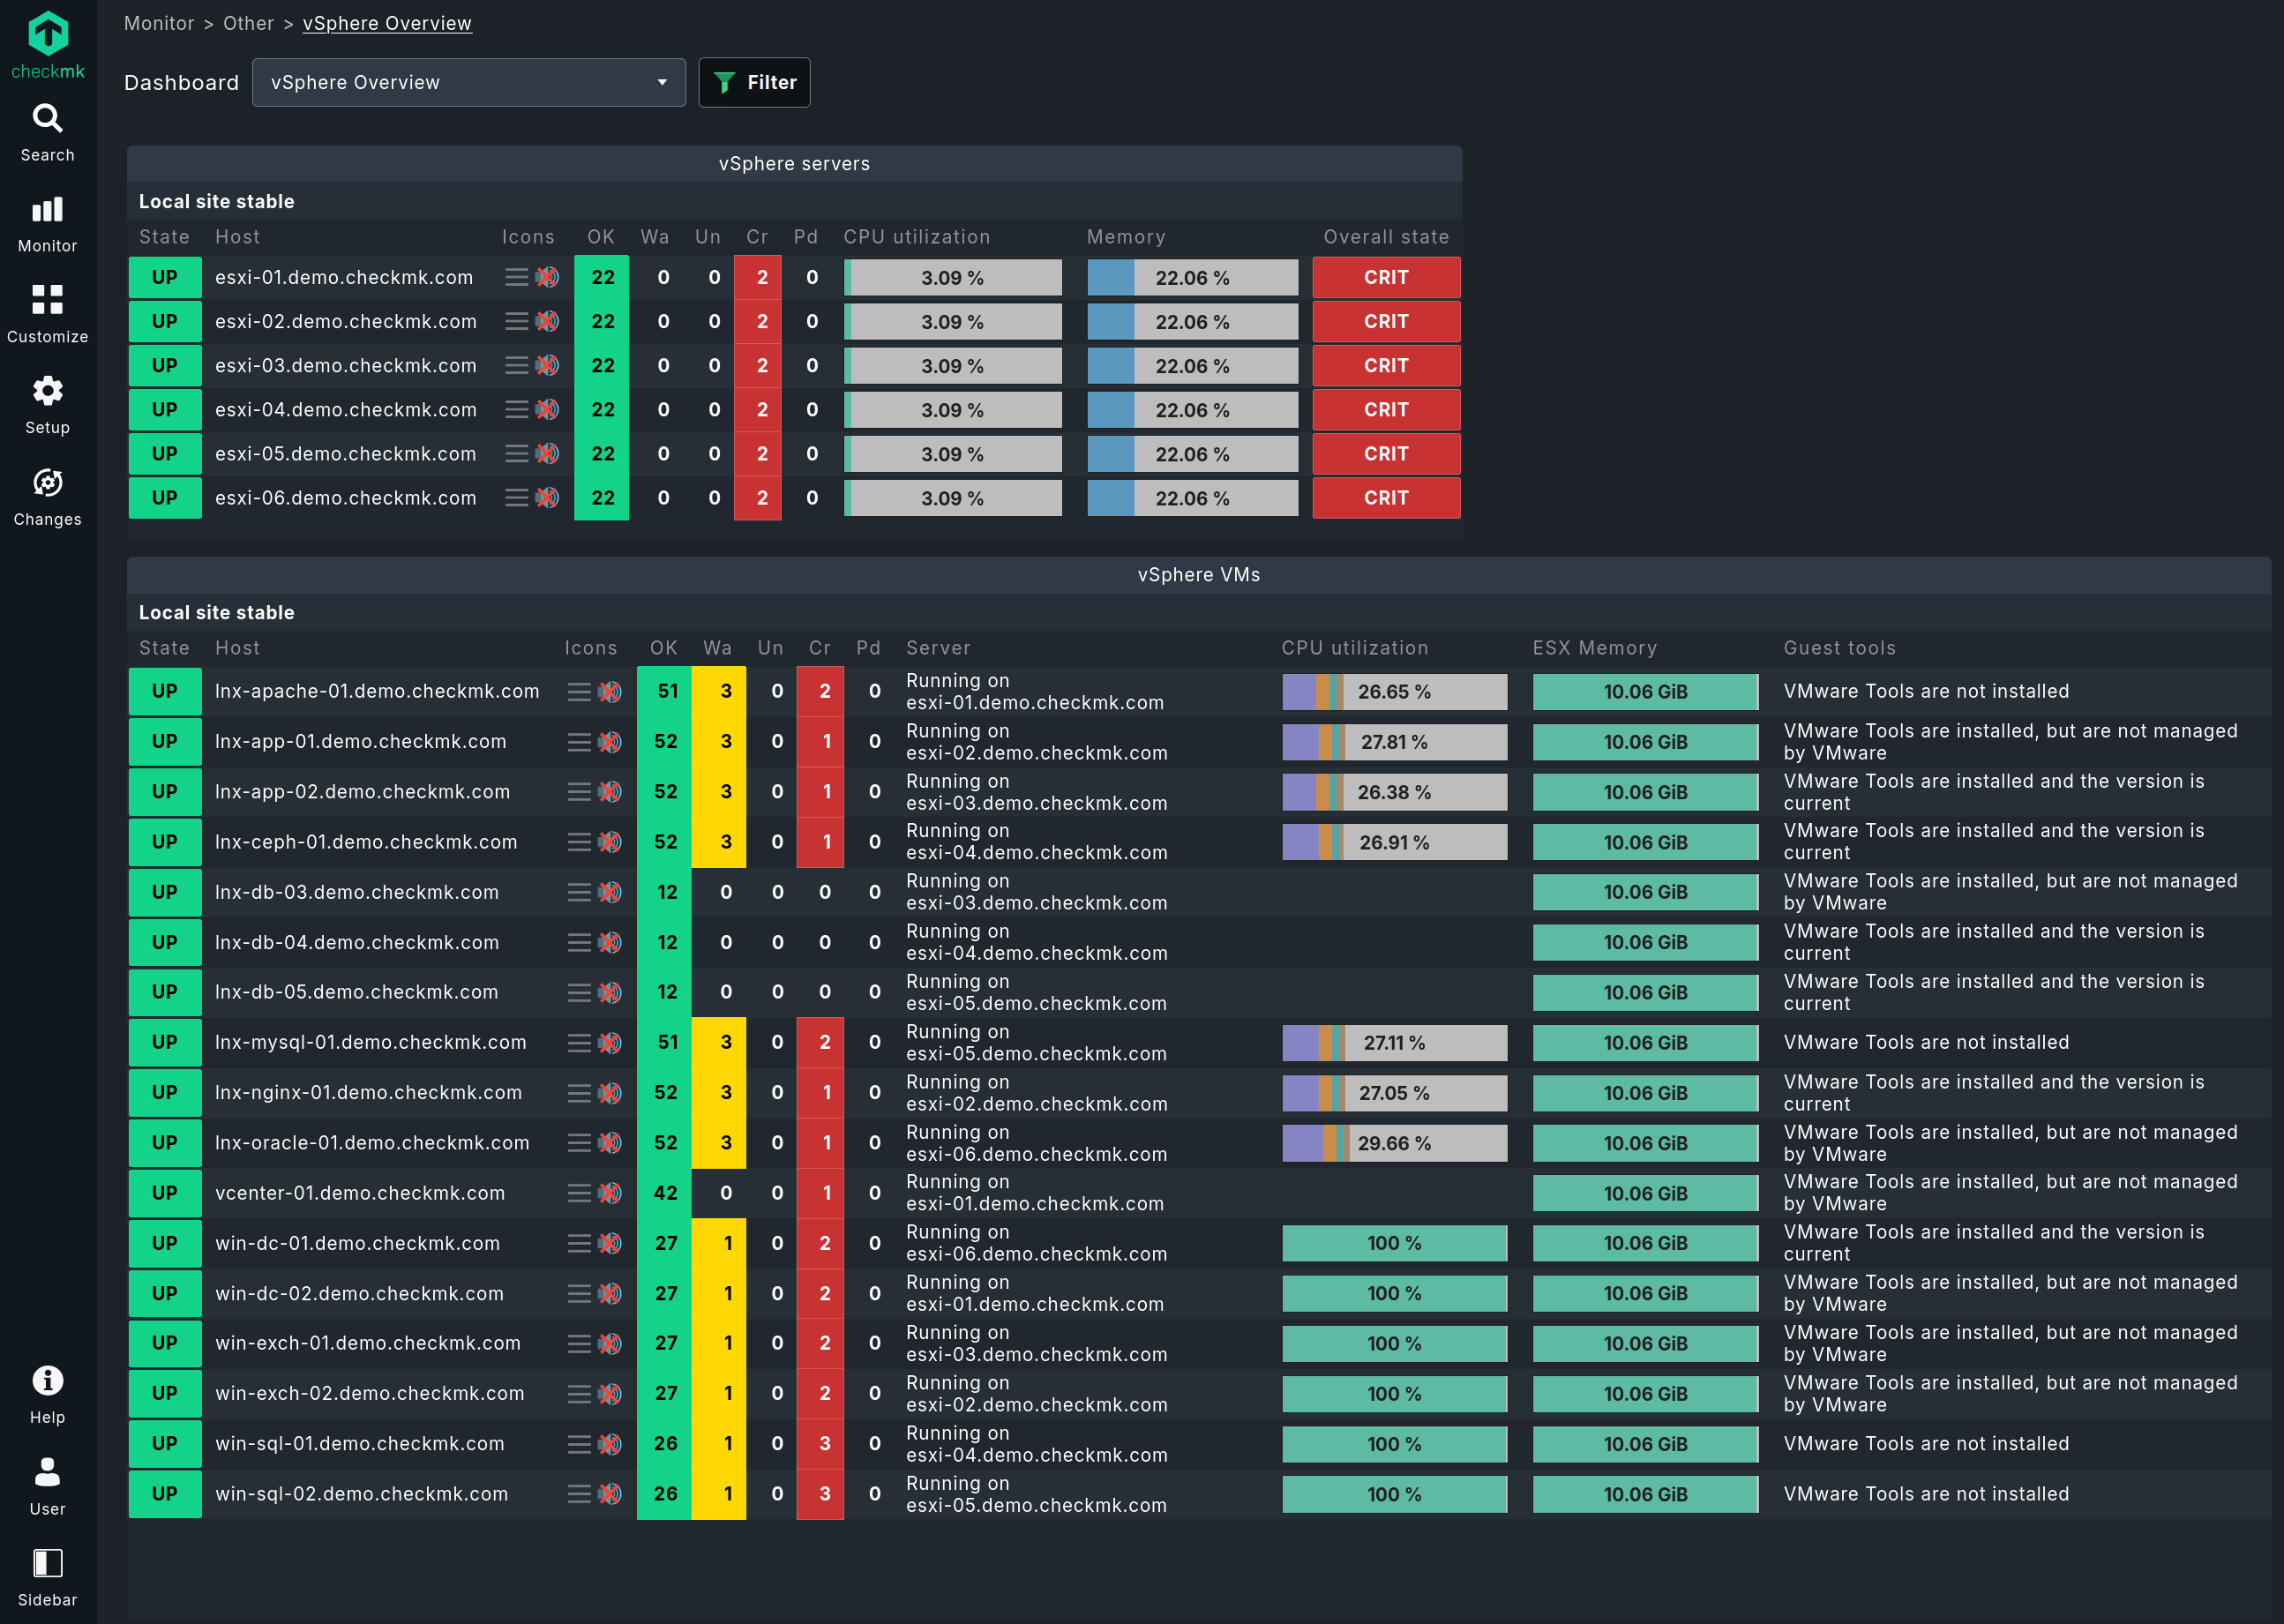
Which server environments Checkmk is built for
Checkmk is server monitoring software for mixed Windows and Linux fleets, virtualized data centers, large-scale enterprises, and hybrid IT, on-premises and in the cloud. Here is what makes Checkmk a fit for each:
- Heterogeneous fleets, with native agents for Windows and Linux, one set of rules across both, and hardware and software inventory on top.
- Virtualized data centers, monitoring VMs and their hypervisors together.
- Large-scale enterprises, with distributed monitoring that scales to 100,000+ hosts.
- Hybrid IT, on-premises and in the cloud, with central agent management, push agents for hosts the server can't reach directly, and AWS, Azure, and Google Cloud monitored directly through their APIs.
Trusted by global brands and local organizations worldwide


FAQ
What is server monitoring software?
Server monitoring software collects performance, availability, and resource data from servers so problems are caught before users feel them. It tracks metrics such as CPU, memory, disk, and network use on each host, alerts when a threshold is crossed, and keeps the history you need to spot trends. The server monitoring guide explains how it works in depth.
Can Checkmk monitor Windows, Linux, and virtualized servers together?
Yes. Checkmk monitors Windows and Linux servers from one place, physical or virtual, including VMs on VMware, Hyper-V, and Proxmox. A VM’s guest operating system uses the same agent and the same checks as a physical server, and the hypervisor layer can be monitored alongside it.
Does Checkmk use agent-based or agentless monitoring?
Both. On Windows and Linux servers, Checkmk is agent-based by default, using a native agent. Where an agent can't be installed or isn't the best fit, it collects data agentlessly over SNMP, IPMI, Redfish, and vendor APIs. Active checks add a third path, testing network services such as HTTP, SMTP, and SSH from the outside. Data from all three ends up in the same monitoring, with the same notification rules.
See monitoring agents in the User Guide.
What is the difference between Checkmk Community and Pro?
Checkmk Community is free forever, with no license cap, and performs best in environments of up to around 100 hosts. Checkmk Pro starts at $275 per month, billed annually, and is priced by the number of monitored services. It runs on the Checkmk Micro Core, scales to 100,000+ hosts, and adds distributed monitoring, advanced analytics and reporting, and automation. Full details on the pricing page.
What is a check?
A check is how Checkmk determines the state of a host or a service. For a service, a check plug-in evaluates the data and returns OK, WARN, CRIT, or UNKNOWN. A service can carry several metrics or none at all, as with a service that only confirms a process is running. Checkmk ships 2,000+ built-in integrations, each a set of checks for a specific technology.
Resources
Start monitoring your servers with Checkmk
Browse a live Checkmk demo environment with discovered hosts and services already in place, or start a free trial and monitor your first servers today.