Note: The content on this page uses the former names of Checkmk editions. Checkmk Enterprise is now Checkmk Pro.
In many businesses it would be hard to imagine IT without the diverse range of products from HPE and HP. In order to guarantee the smooth operation of your servers, switches, storage systems and WLAN solutions, you also need to monitor them with powerful IT monitoring. HPE in particular, with its focus on high performance in large organizations, provides its own tools for this purpose, but most IT infrastructures are not homogeneous HPE environments.
To avoid the situation where you use an individual monitoring tool for each manufacturer and end up losing sight of the essentials because of all the various dashboards, you should use a monitoring solution that allows you to monitor your entire IT. This is the only way you can not only ensure effective IT operations, but also be able to identify correlations in the event of any problems that may arise.
In this blog article I will explain what you should look for when monitoring HP and HPE devices – as well as the solutions from other vendors. I will also explain how Checkmk meets these challenges in practice. First, I'll cover the monitoring of HP network devices. The second part then deals with the monitoring of HPE servers.
TL;DR:
The article shows how to efficiently and centrally monitor HP and HPE devices with Checkmk – from switches and WLAN access points to servers and storage systems.
- Network devices (HP/Aruba/Silver Peak): Monitoring via SNMP, automatic service discovery, over 100 ready-to-use plugins → fast integration without manual configuration.
- Servers & storage (HPE ProLiant, 3PAR, StoreOnce, BladeSystem): Combination of management board monitoring (SNMP/IPMI/REST API) and agent-based monitoring → detailed hardware and operating system visibility.
- Future-proof & vendor-independent: Checkmk supports more than 2,000 integrations and is suitable for on-premises, hybrid, and cloud environments.
For network devices: Monitoring HP via SNMP
SNMP is an important standard in network monitoring and HP network devices are no exception to this. SNMP monitoring always has some disadvantages, but with Checkmk you are particularly well positioned for monitoring HP switches, WLAN access points and other network components from HP. For example, Checkmk does not rely on a complete query (SNMP walks) of all records on the device to be monitored, but can decide which further queries will be useful after reading the first information provided. This saves time and makes monitoring via SNMP more efficient.
Checkmk already has around 100 standard plug-ins for the monitoring of HP devices. Such extensions convert SNMP data into so-called services in Checkmk, which they can then monitor. Instead of having to create and configure them manually, you can automatically include the important services for the respective device in the monitoring with just a few clicks thanks to the check plug-ins that are already provided.
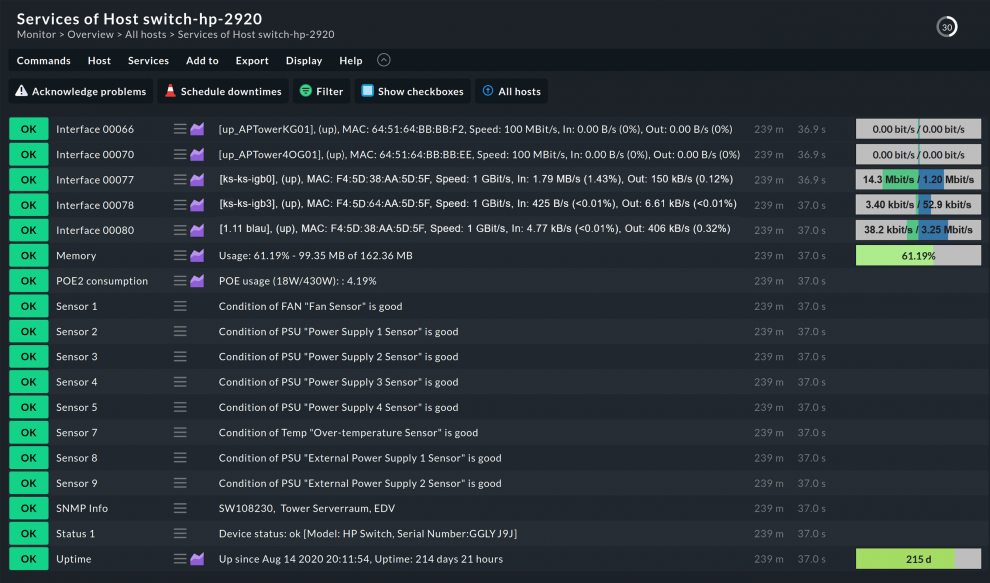
Using an HPE Aruba 2920 switch as an example, you can see that Checkmk provides information on multiple sensors, memory utilization, and power consumption, in addition to the standard SNMP services on the health of the interfaces and the uptime for the switch.
These available plug-ins ensure that Checkmk will automatically add all of these services to your monitoring without the need for manual configuration. Checkmk supports SNMP versions v1, v2c and v3 and comes with default values for the SNMP configuration, so that you can integrate your hosts into the monitoring with just a few clicks.
For example, if you use 'public' as the SNMP community, and Checkmk can resolve the name of a host to an IP address via DNS, Checkmk only needs the host name to be able to include the host into the monitoring. Otherwise, of course, you can simply specify the IP address in Checkmk and customize the SNMP credentials. Checkmk will then automatically detect the host's services.
In addition to universally-applicable plug-ins for HP switches, there are special extensions for specific HP devices, such as the HP Procurve switches. Checkmk also has plug-ins for solutions from Aruba Networks and Silver Peak, which are also part of HPE. With these you can set up monitoring of your network devices in minutes.
This is one of the many reasons why the configuration of Checkmk is more efficient compared to other monitoring solutions. In addition to automatic service discovery, Checkmk offers many other automation options, such as bulk imports, which enables large numbers of hosts to be added to the monitoring quickly and with a single action.
Over 2,000 customers already rely on Checkmk and most of these use it for monitoring HP and HPE systems. In response to this, we have continually optimized and expanded the monitoring. You can thus benefit from this experience.
HPE monitoring of servers
With server monitoring of HPE devices, you have full flexibility: On the one hand, Checkmk can use the HPE management board for monitoring and, on the other hand, it can monitor the servers and the installed storage directly via SNMP or Checkmk agents. This allows you to take full advantage of HPE's enterprise features while accessing monitoring data from the hardware level all the way up to the application level.
Although the HPE server management board is located in the same server housing as the actual server, it runs as a separate system and usually provides monitoring data via SNMP, IPMI or, in the case of newer models, via its own REST API. This separation from the actual server has the advantage that the server's hardware resources are not stretched when monitoring data is queried via the management board. In addition, the data is available even when the server is switched off, as long as it is connected to the power supply. Checkmk naturally also provides you with plug-ins for the management board for monitoring your Proliant and 3PAR storage servers, as well as for your StoreOnce platforms and BladeSystems from HPE.
Important data on the hardware configuration can be queried via the server management board. Especially for the highest performance server systems, it is useful to know, for example, which hard disks have been installed, where they are mounted and how a RAID system has been set up. If you have a hardware defect, Checkmk can provide you with the exact location and serial number of the hard disk. Without such detailed monitoring, troubleshooting would be much more time-consuming.
This gives you a powerful source of information that you can combine in Checkmk with direct monitoring of the server and the storage on the server. For storage monitoring, there are also HPE storage plug-ins and a Special Agent from Checkmk. This Checkmk Special Agent for HPE uses data from HPE's REST API instead of the SNMP data, and the agent is installed directly on the Checkmk server. This agent works much more efficiently and reliably compared to monitoring via SNMP.
You can display the information from the management board and from the server being monitored in Checkmk either combined or separately. Checkmk recognizes whether a host and a service already exist, so that no services are duplicated in the monitoring. At the same time, you can display the data from the management board, the storage and the server itself as separate hosts in monitoring – for personnel from separate teams, for example.
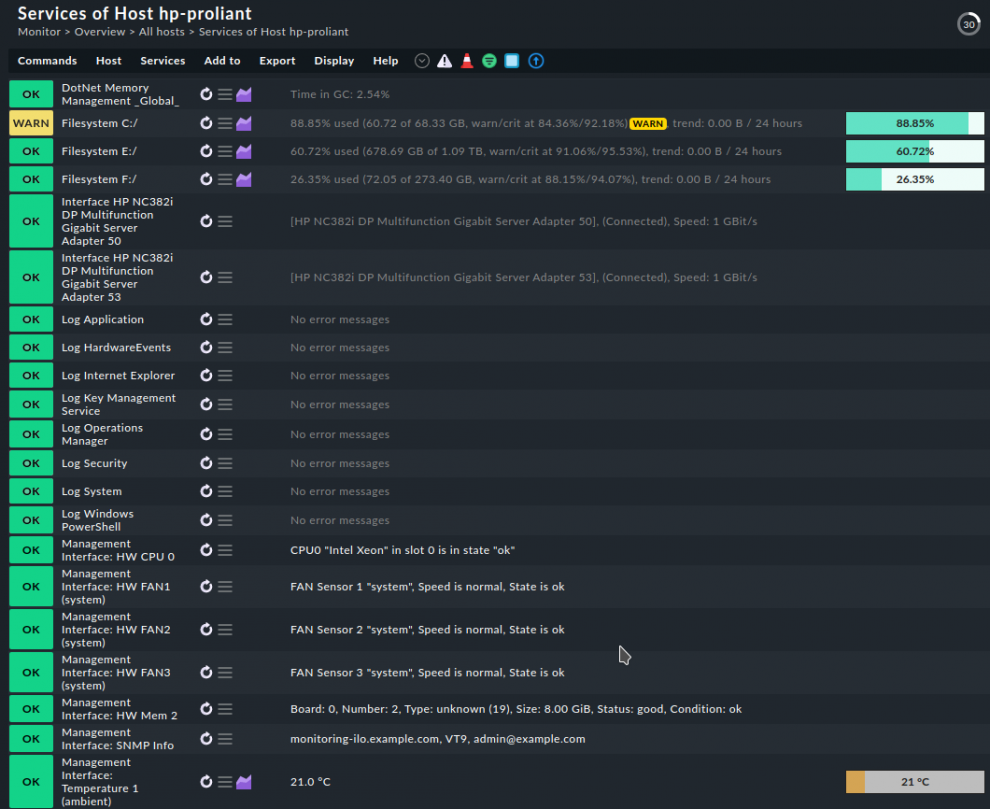
The combination of multiple information sources gives you extensive insight into the health of your HPE servers thanks to the graphical user interface. The screenshot here shows the information for an HPE Proliant server with Windows as the operating system. In this case, the user has installed the Checkmk Windows agent and included it in the monitoring. Checkmk additionally monitors this same server via the management board and merges all of its services into a single host.
The Windows agent warns you that the "Filesystem C:/" is relatively busy. In addition, by default, the Windows agent now checks the Windows logs for error messages. At the same time, you can see the information provided by the HPE management board: Data on temperature, cooling and other hardware is also monitored. Checkmk has automatically detected and recorded these.
Although most HPE servers also have an SNMP agent installed, it is better to use the Checkmk agents here. They allow you to monitor your HPE servers in even greater depth and bring precise information about applications and the operating system to the monitoring. The Checkmk agents are available for all common server operating systems and use much less CPU and RAM on the server to retrieve the data compared to SNMP. Each agent additionally works with read-only access and cannot modify any data on the server. Furthermore, you can implement encryption much more easily and securely compared to SNMP.
Along with better performance, the reliability and wealth of detail in the data are a major advantage with agent-based monitoring. This enables Checkmk to perform a hardware/software inventory and, for example, provide the information on the installed software to a license management system. However, if agent installation is not an option, Checkmk naturally supports server monitoring via SNMP.
Monitor more than just HPE servers with Checkmk
You should also keep in mind that these agents are not only for monitoring HP systems – they provide an efficient way to optimally monitor all of the servers in your organization. This means that even a possible switch to server platforms from another manufacturer will not affect your monitoring - this will be able to function seamlessly. Checkmk is also well suited for monitoring virtualized servers as well as virtualization platforms such as Microsoft Hyper-V or VMware ESX.
Checkmk also supports cloud monitoring, for example, if you want to monitor your IT components hosted in Microsoft Azure. When you use HPE Proliant servers with the Microsoft Azure Stack Hub as a hybrid cloud, for instance, you can monitor your cloud and on-premises environment with just a single tool. Although Checkmk comes with standard plug-ins for HP monitoring, these are only a small number of the more than 2,000 monitoring integrations that are now included. As a result, Checkmk supports you in monitoring all IT components, regardless of the manufacturer.
You can also benefit from special dashboards that can be individually customized to your needs. This allows you to keep an eye at all times on the most important metrics in your IT environment.
You can test Checkmk Enterprise now for 30 days without obligation.


