Complete Guide to Virtual Server Monitoring
Monitor all your virtual machines and their hypervisors regardless of your virtualization solution.
TL;DR:
Virtual server monitoring ensures full visibility and control over virtual machines, hypervisors, and related infrastructure, helping IT teams maintain performance and prevent issues.
- Monitoring must cover VMs, hypervisors, storage, and network components to provide context and avoid false alerts or overlooked resources.
- Automation and dynamic host configuration simplify management, integrating cloud, container, and hybrid environments without manual overhead.
- Accurate monitoring tracks snapshots, backups, and resource usage, ensuring performance, availability, and smooth collaboration between IT and DevOps teams.
How do virtual environments function in enterprise IT infrastructures?
Server virtualization has already become part of everyday life in most companies to allocate hardware resources better.
IT admins find it much easier to manage IT environments if they can virtualize servers at least partially.
What is a virtual server, and how does it work? A virtual server is a virtual machine (VM) that is deployed on a physical server via a dedicated software. Like a hardware server, the virtual server can also provide hardware resources such as CPU, interfaces, storage or RAM. A major advantage of VMs is that they can be configured to run multiple operating systems and applications.
Because a virtual server is configured to run multiple operating systems and applications, it is a cost-efficient way for organizations to utilize processing power and distribute resources.
However, virtualizing servers increases the requirements for monitoring. The virtualization platform, underlying infrastructure, and virtual machines (VMs) provide different information bases, which the IT team must collect and put in the correct context.
In addition to classic virtualization via hypervisors, more and more companies use containers and platforms such as Kubernetes.
When monitoring containers, there are some similarities to the monitoring of virtual servers, but there are also additional aspects that you should consider.
How can I monitor a virtual server?
In any case, as with any server monitoring, all-around visibility is essential for accurate monitoring.
Monitoring the individual containers or the hypervisor and the VMs alone is insufficient. In addition to the virtual infrastructure, companies must also consider network components, storage, and other related elements in their monitoring.
At the same time, monitoring must not lead to overloading IT admins and developers with manual processes. To encompass all those requirements, it is essential to find the right server monitoring software.
Checkmk offers several tools to facilitate creating and enforcing specifications for individual servers, specific server types, or entire clusters.
Virtualization aims to make you more dynamic.
Whether you choose VMware vSphere, Microsoft Hyper-V, Citrix XenServer, or another platform, IT managers will likely no longer want to create hosts manually. Instead, hosts will be created and decay automatically.
Automation is essential and plays a vital role in monitoring containers and orchestration platforms. With Checkmk, you can easily monitor Docker, Kubernetes, and OpenShift.
Checkmk offers features like Dynamic Configuration Daemon (DCD), making manual maintenance of hosts unnecessary in your monitoring. This makes especially the cloud server monitoring a breeze.
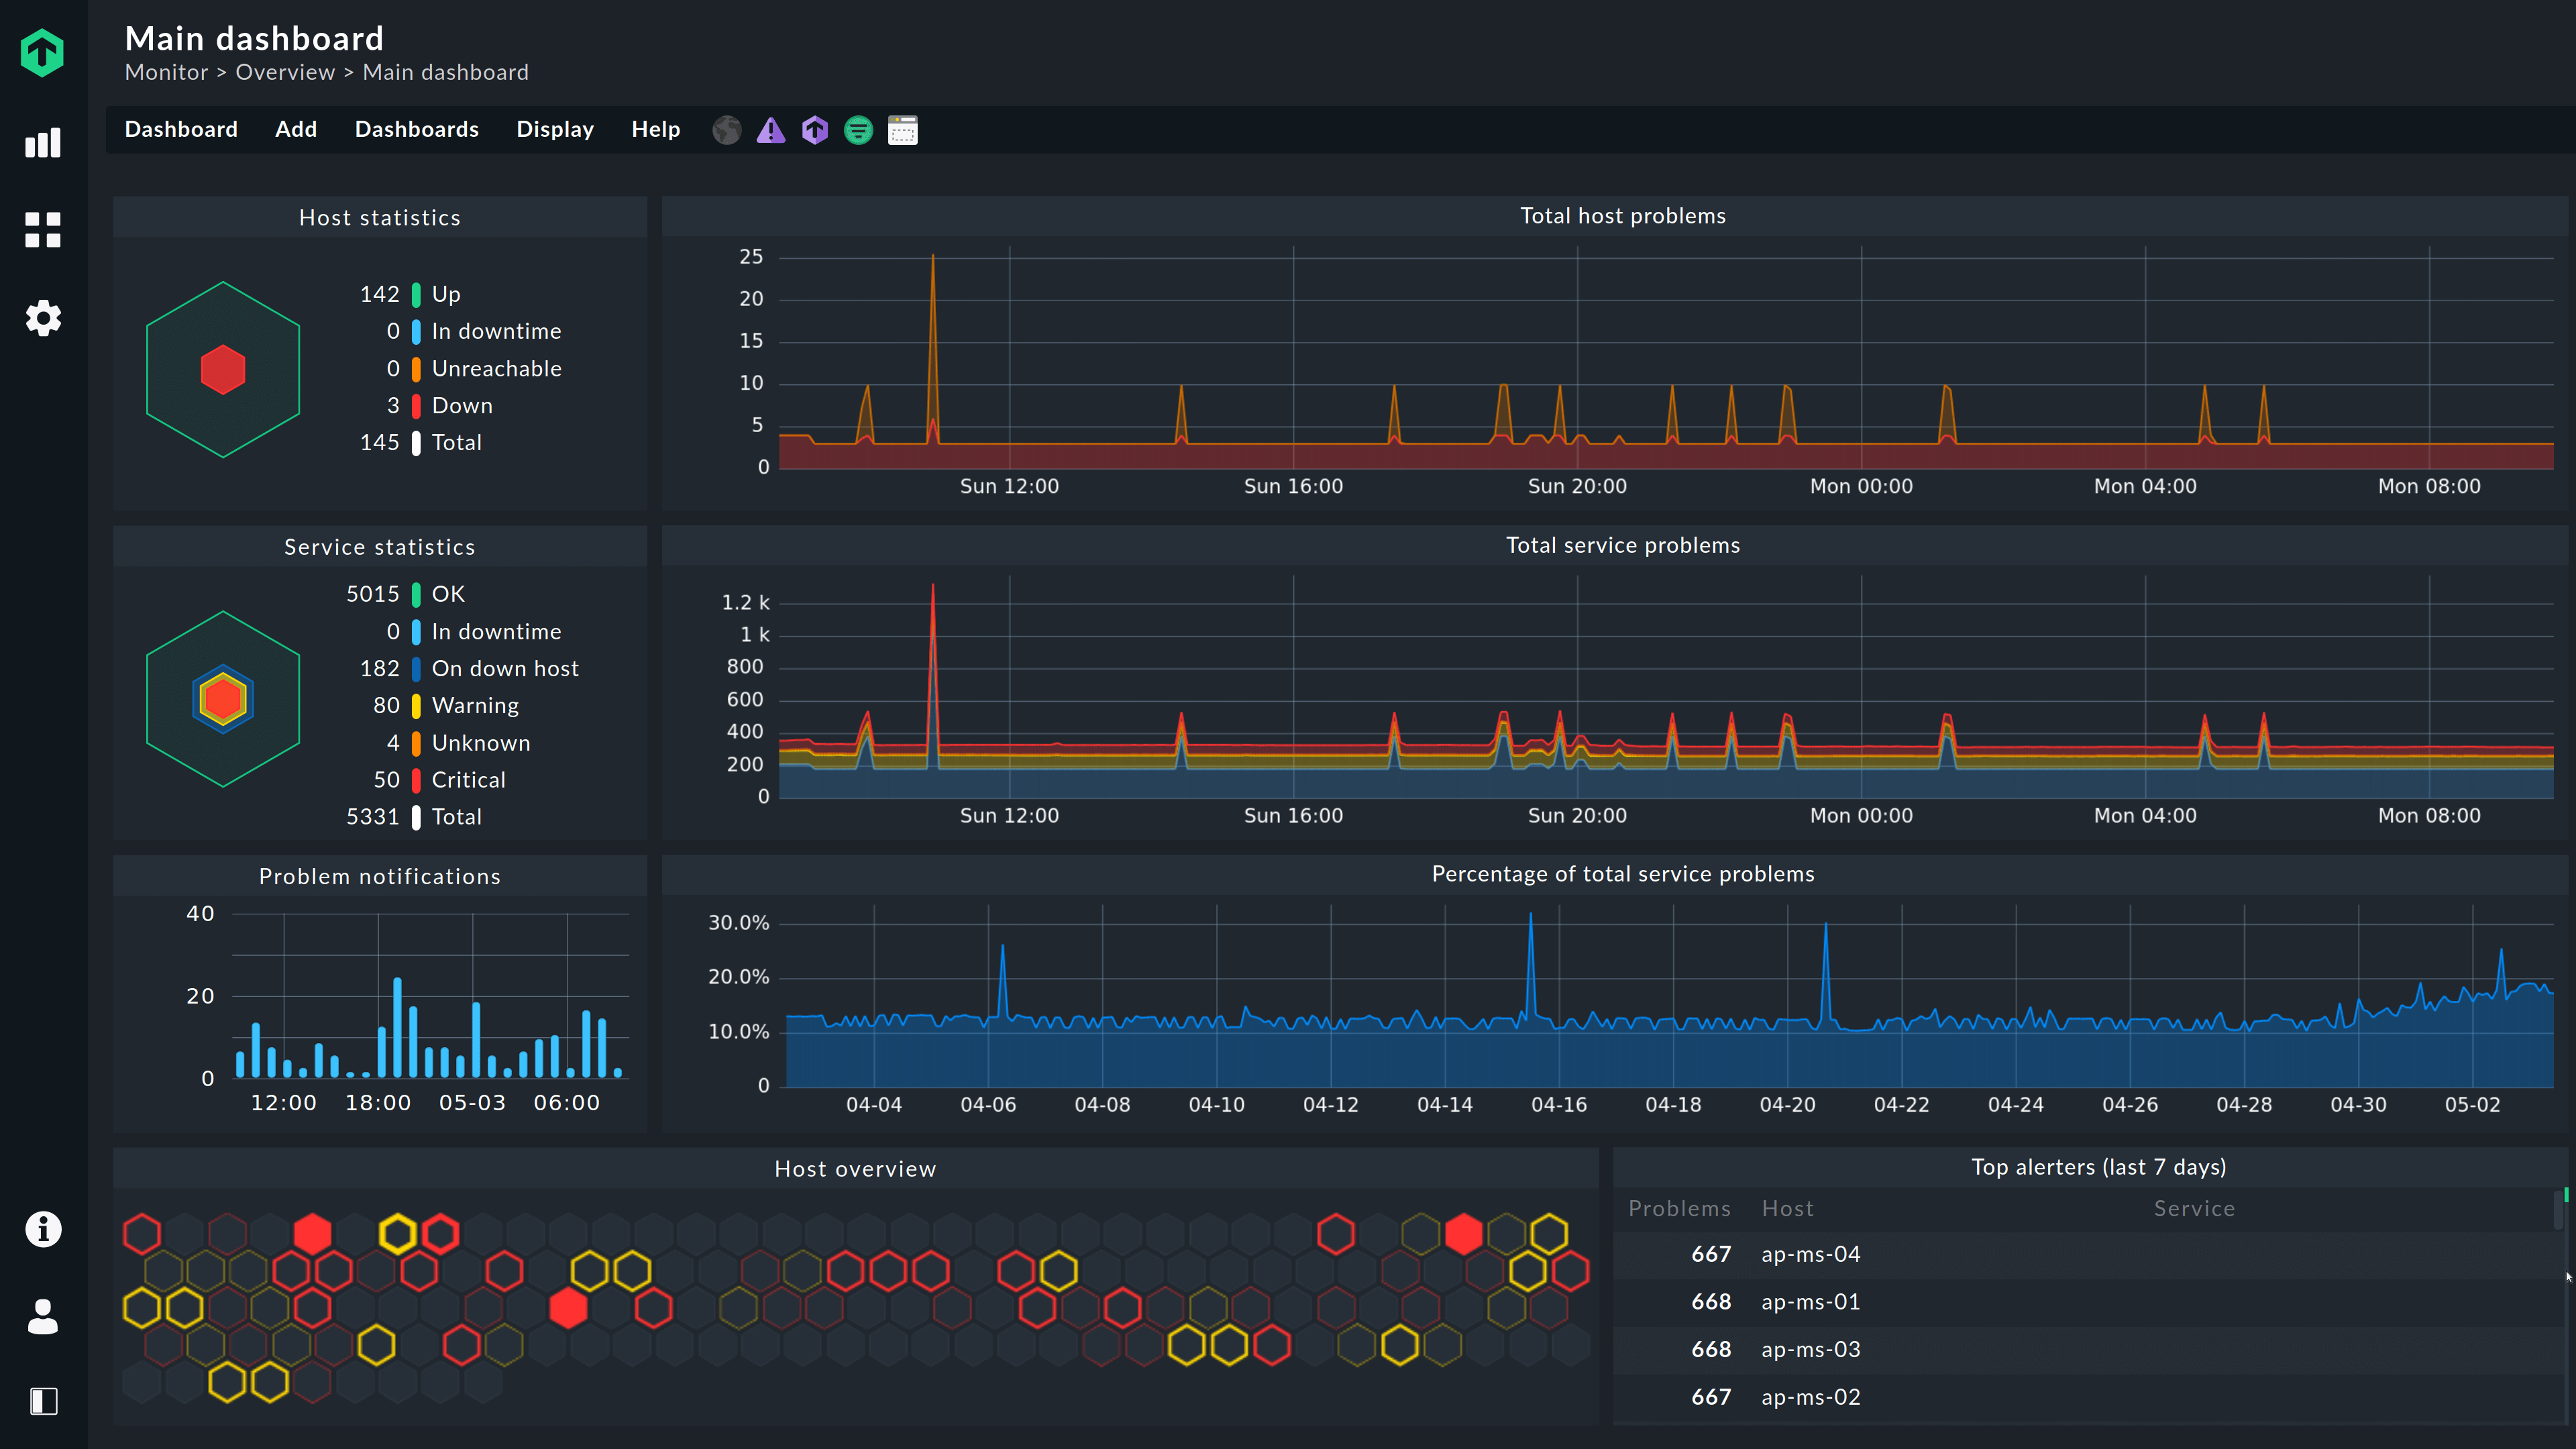
As an all-in-one platform, Checkmk also offers precise insights into all relevant areas: Starting with the basic hardware and cloud infrastructure, it not only monitors the deployed virtualization platform and the VMs provided by it, but also the connected storage and network devices.
You gain relevant insights in each area and can pinpoint errors precisely.
What are the daily challenges of managing virtualized servers?
Decoupling the hardware from individual subsystems makes it more challenging to identify the causes of problems.
With virtualized servers in particular, the cause of complications is not always the same as the location of the impact. The solution to a problem is not immediately recognizable in such a case.
Incorrect monitoring floods IT teams with imprecise alarms or even false positives. Therefore, the context of server virtualization warnings is essential.
In addition, VMs are usually not set up centrally, but instead separately by more than one person. An IT solution to monitoring a virtual machine must map the actual circumstances in companies. In the worst case, VMs are not transferred to monitoring and are overlooked.
Even if departments do not create VMs themselves, they often use their tools to check their areas. Information is thus left out, and processes are inefficient in removing alarms.
Integrate and map different information sources
In practice, there are technical and organizational links. Therefore, monitoring must not act as an isolated solution but must easily integrate and map different information sources.
At the same time, depending on the user's position, there are different requirements for the information's level of detail and security clearance.
The administrator should fine-tune the presentation of the monitoring data and the dashboards to different user groups.
Checkmk not only collects all information; it also enables you to individually adapt views to different user groups.
Through integrated graphing, dashboarding, and reporting engines, users without monitoring experience gain helpful knowledge about possible sources of danger. You also have the option of expanding or limiting access rights depending on the purpose.
Why is a holistic approach necessary for VM infrastructure monitoring?
Companies must, of course, keep an eye on primary areas such as CPU, RAM, partitions, and network data as with every server. However, due to their architecture, virtualized environments have their own requirements.
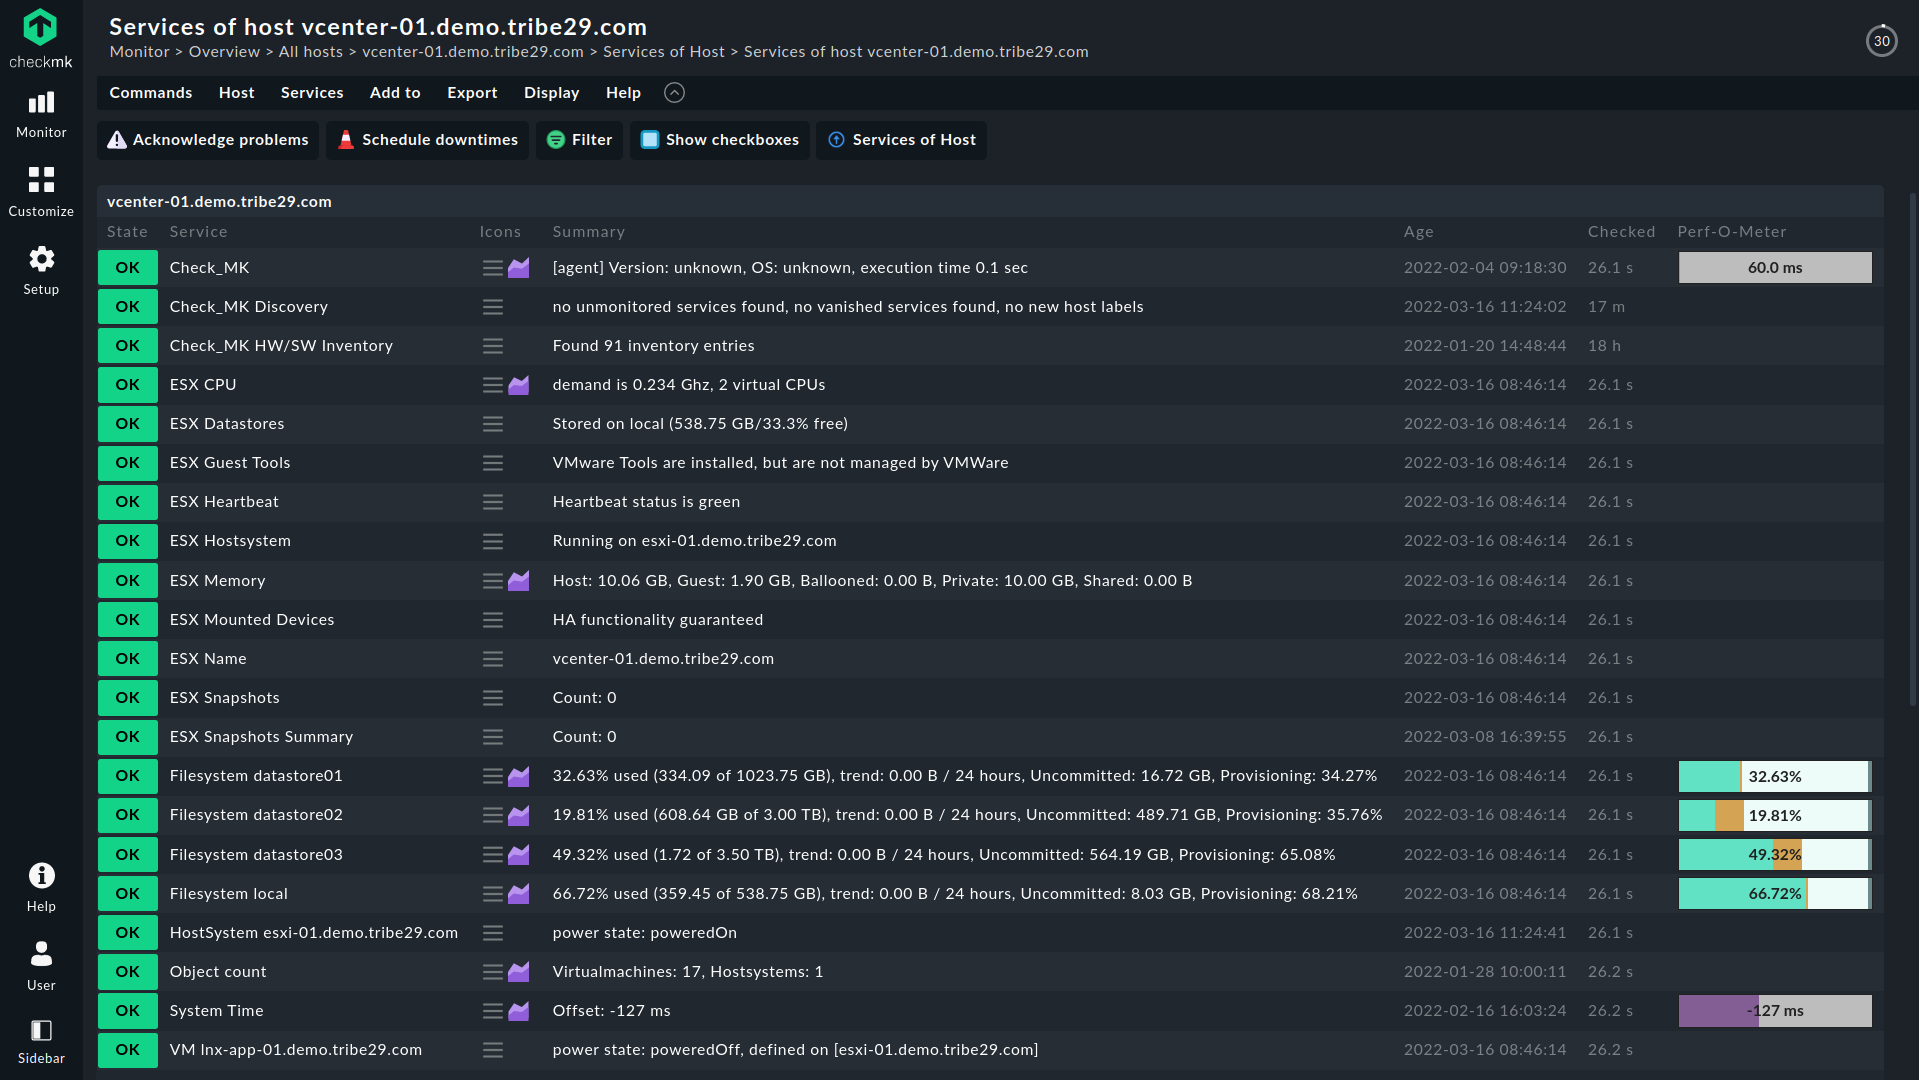
These include, for example, checking the VMs for their heartbeat, taking snapshots, and installing maintenance tools, but there are even more specific details.
For example, VMs only see the storage actually used on connected storage and reserve this storage space for their own applications.
The VM will only send an alarm if the used memory on the storage is so large that a reservation is no longer possible. But the VM only has its own applications in mind.
The storage itself recognizes the size of the virtual hard disk and possibly its maximum size. But it can't anticipate an approaching peak in performance from several VMs.
Therefore, it is vital to consider the interactions of multiple VMs when accessing the same storage. Reservations should never exceed the available space.
Checkmk is a phenomenal monitoring program that constantly improves while remaining flexible enough to customize to fit your unique monitoring needs perfectly.

Interpreting network and hypervisor information correctly
The information from the hypervisor is also crucial in many cases and always belongs to the monitoring. A hypervisor sees the actual size of the virtual disks and the maximum size of the disks of its VMs.
It also knows the actual size of hard drives managed by other hypervisors. The hypervisor management platform (e.g. VMware vCenter) can determine all virtual hard disks' actual and maximum size on all hypervisors.
An example of the importance of data from the hypervisor is monitoring the interaction of VMs and networks. VMs, switches, and storage are often connected redundantly.
The VMs do not know the redundancies because they do not know where the hard disks are or which physical network interfaces the virtual interface of the VM is connected to.
However, the hypervisor knows about redundancies when connecting to the storage or the network because it manages the (virtual) interfaces.
With Checkmk, you can map possible scenarios precisely in the monitoring and receive all data in a uniform platform.
In addition to integrations with hypervisors and their management platforms, Checkmk supports interfaces from all leading manufacturers in the area of network devices, storage, and servers. You can precisely localize alarms and target them.
How does Checkmk monitor different virtualization platforms?
The exact type of monitoring of virtualized servers depends on the platform used. Checkmk provides platforms such as VMware special agents. For other environments such as Microsoft Hyper-V or Citrix XenServer, the monitoring agents for Windows or Linux are suitable.
VMware vSphere is an excellent example for the development of platforms and Checkmk. Checkmk has used VMware's interfaces for a long time, but older versions can still be monitored using the Linux agent from Checkmk.
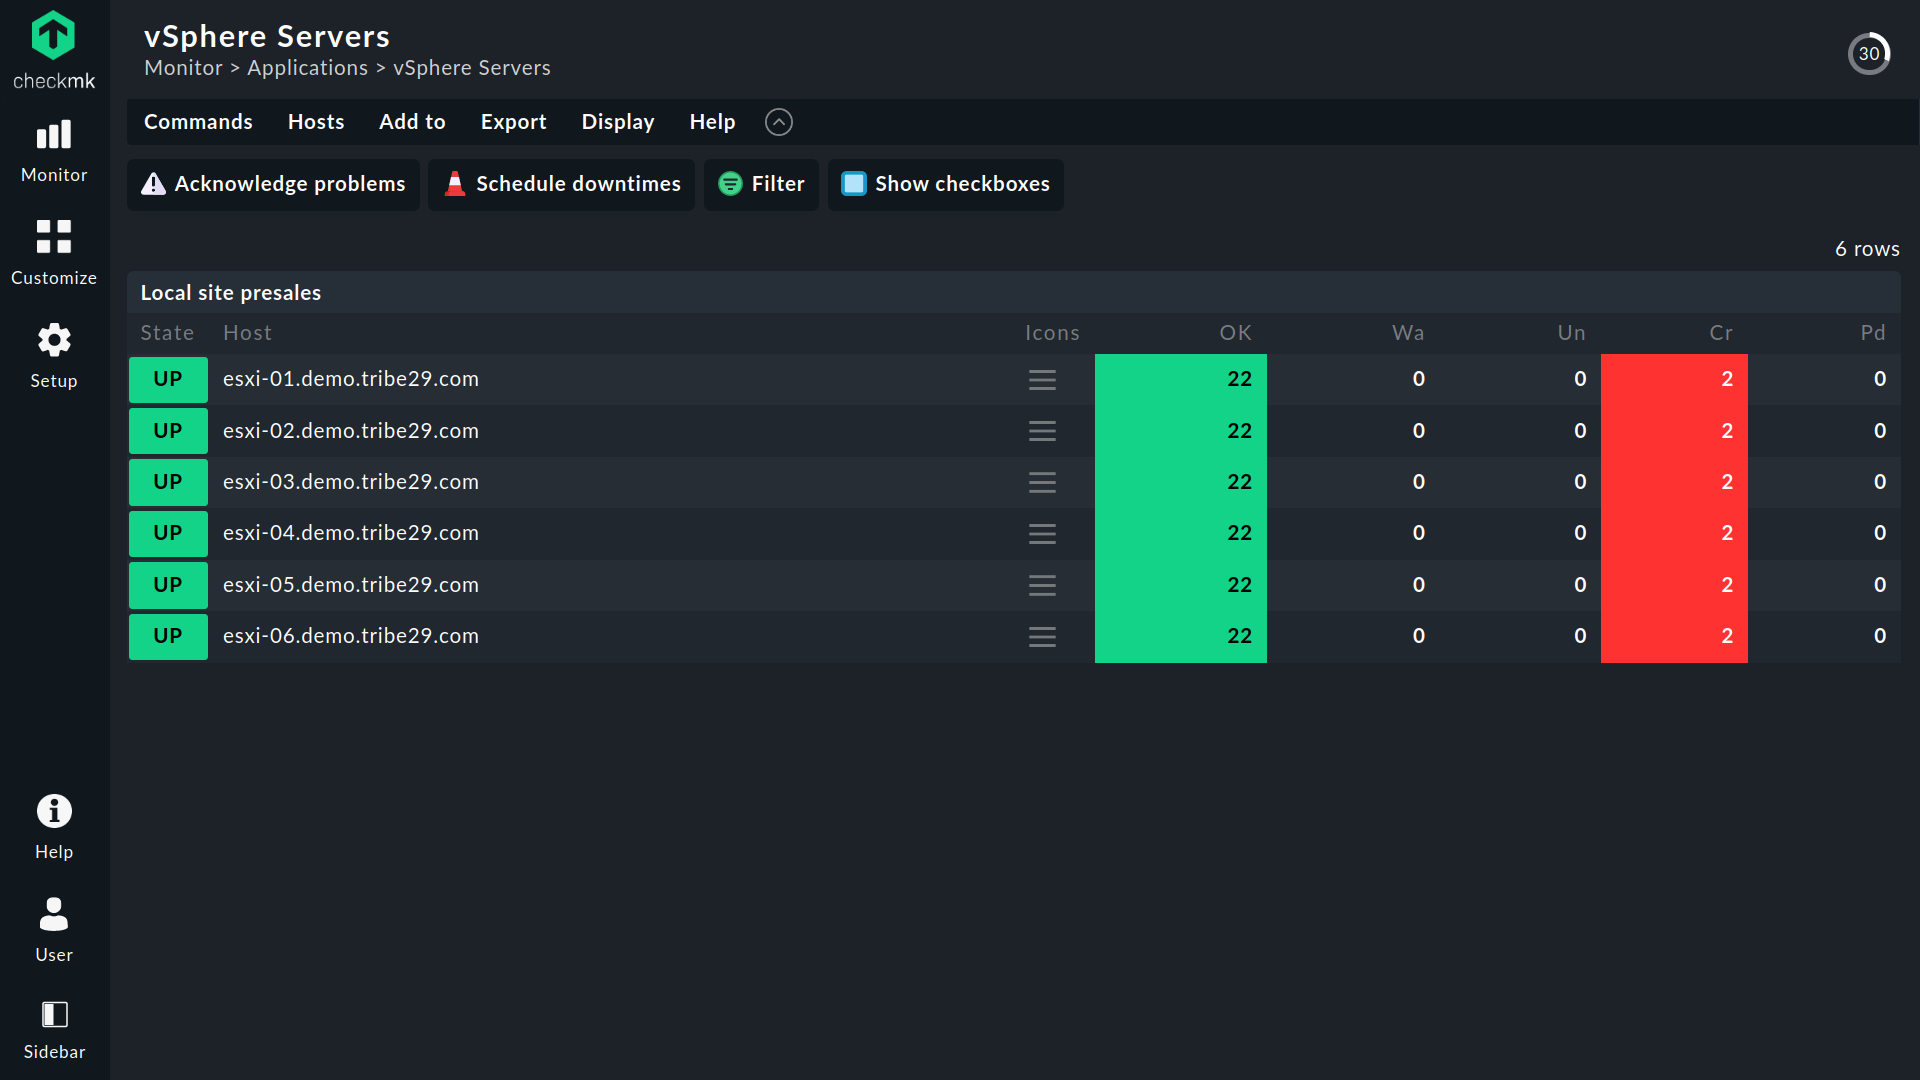
The best way to monitor ESXi nodes is through the VMware API. On the one hand, the performance is better. On the other hand, IT admins benefit from additional features. These enable a better overview and allow automatic host configuration via the Dynamic Configuration Daemon (DCD) from Checkmk.
Checkmk retrieves the information from the vSphere API with a particular agent. A user account with read access is sufficient on the VMware ESXi server.
Implementation takes less than five minutes, and you will have all VMs as services in Checkmk. If you also create the VMs as hosts in Checkmk, they are automatically supplied with the data from VMware vCenter.
At VMware, the ESXi hypervisor comes as its own bare metal server, which you can also monitor with Checkmk.
How does the Dynamic Configuration Daemon (DCD) automate host management?
In Checkmk, the Dynamic Configuration Daemon (DCD) enables you to add and remove hosts automatically based on monitoring information.
In practice, this not only means little manual work is needed, but it also provides accurate traceability when creating and closing VMs – and also across teams if desired.
Checkmk can automatically take over and remove monitoring from AWS, Azure, Kubernetes, VMware, and other sources via the DCD hosts.
Checkmk makes monitoring virtual machines effortless and so scalable that the size of the environment does not matter.
The ability of dynamic host configuration is aimed at users of Checkmk Pro. It informs admins, for example, about VMs that are idle, incorrectly configured, deleted, modified, or newly created as hosts from other users.
We are also working on deepening integrations. For this purpose, the DCD has been designed as a platform, which additional connectors will expand with new functions in the future.
Each connector can collect information from a particular source and has its specific configuration.

When should you use standard Checkmk agents in virtualized environments?
In some instances, it makes sense to monitor virtualization environments using standard Checkmk agents, such as Citrix XenDesktop. Management runs here via a Windows VM. Checkmk also supports the Citrix API.
The XenServer itself is based on Linux and can be monitored with the appropriate Checkmk agent.
In the case of Microsoft Hyper-V, Checkmk benefits from its experience in Windows server monitoring and good integration into the Windows ecosystem. With the Windows agent, you can monitor Hyper-V itself and virtualized clients and servers.
Checkmk continues to develop its integrations and adapts to new possibilities in the virtualization and monitoring of servers. Companies can switch freely between manufacturers and platforms, or use them in parallel.
Checkmk already has integrations with VMware, CitrixXen, and Microsoft Hyper-V, and we are constantly expanding our capabilities and adapting to platform updates.
Integrated with Proxmox
Checkmk has also integrated with Proxmox VE, an open-source, Linux-based server virtualization management platform.
The Proxmox configuration interface facilitates the management of multiple containers and VMs in your host systems, but for this to function smoothly, all the Proxmox nodes and clusters must be monitored. Checkmk makes Proxmox monitoring both efficient and timely.
At the same time, you are flexible with server migration: Checkmk also monitors on-premises servers and integrates directly with manufacturer interfaces and IPMI. In addition, integrations with cloud providers such as Microsoft Azure and AWS are available.
What special functions does Checkmk offer for monitoring virtualized servers?
Many organizations have been using Checkmk to monitor their virtual assets for years. Together with our community, we have continued developing and adapting monitoring.
Our knowledge of virtual servers and how they work is immediately applied to monitor virtualized environments as accurately as possible.
For example, you can monitor snapshots precisely. These affect the performance of the VMs. Snapshots should therefore only be used for a short time and deleted after creating a backup.
As a comprehensive virtual server monitoring platform, Checkmk also integrates into tools such as Veeam to keep an eye on the age of backups and initiate appropriate processes here if necessary.
You can also be sure that the backup jobs have run. In addition, special requirements can be easily met using Checkmk's rules-based monitoring.
More rigorous monitoring needed
For example, IT teams should set minimum storage space requirements for VMware ESXi more strictly than regular servers. The reason is, if a node fails, VMware automatically migrates the affected VMs to the remaining nodes.
However, these remaining nodes must provide the necessary memory until the failed node is available again.
Depending on the size of the environment, the monitoring must therefore send alerts earlier to compensate for a possible failure and keep sufficient memory available.
One approach, for example, would be to set the minimum at 60 percent for four nodes of the same size instead of changing the status to CRIT when the memory utilization is only 90 percent. Then three remaining nodes can compensate for a failure, or you receive an alert.
How do IT Operations and DevOps teams collaborate on container monitoring?
Containers allow developers to create, test, and migrate software faster. Companies have increasingly used Docker, Kubernetes, and other tools in recent years. Virtualized applications, microservices, and similar approaches must also be part of a surveillance strategy.
The technical challenge is that containers often only exist for a few minutes or even seconds, and developers often don't have time to integrate them into comprehensive monitoring of virtual servers.
They also focus heavily on performance metrics and do not consider the condition of the underlying hardware or individual services.
The monitoring of the classic infrastructure is still the responsibility of the IT operation teams, but without a suitable basis, they can only have incomplete information.
Coordination with the developers is complex and can quickly create information silos.
If there are problems between virtual systems and physical IT assets, this becomes a bottleneck because the teams have to exchange individual notes manually.
Agile methods in software development or approaches such as DevOps are only successful if companies adapt their monitoring accordingly and find cross-team solutions for developers and IT operations.
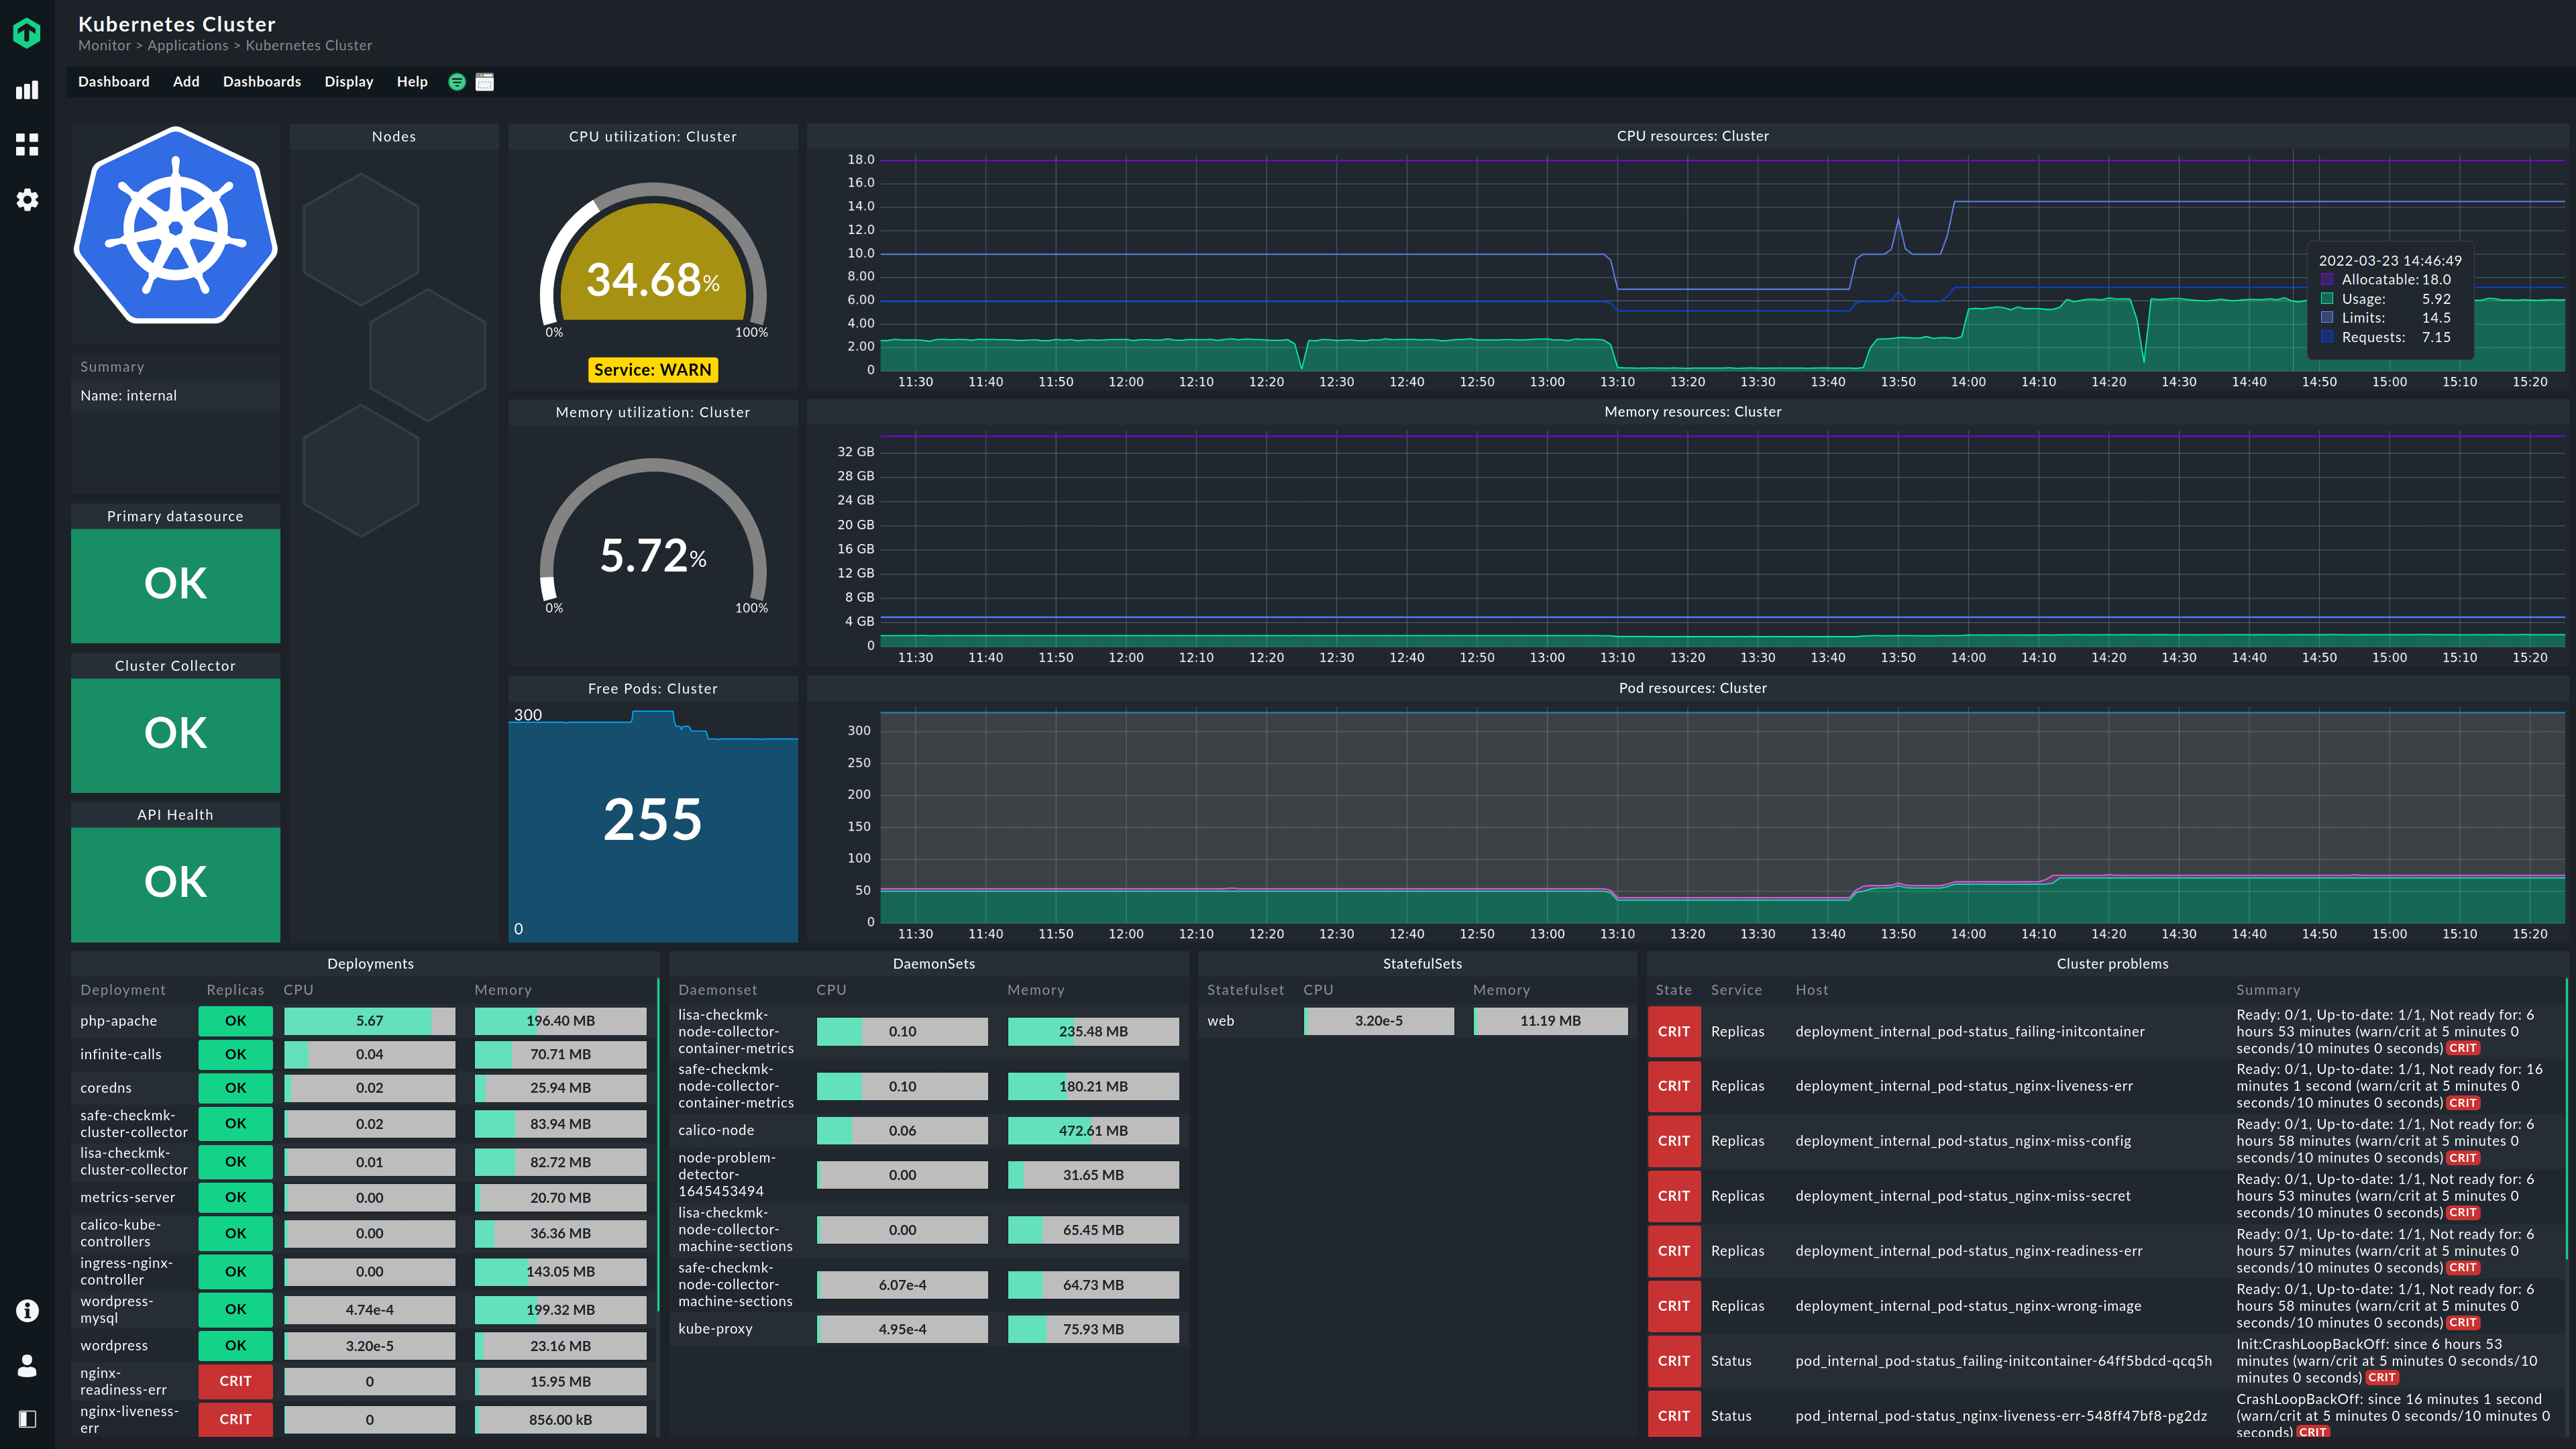
Monitoring Docker, Kubernetes, or OpenShift provides essential metrics and detailed information about the individual hosts. Still, depending on the user, monitoring tools must be specifically adaptable to work efficiently.
Checkmk recognizes containers and automatically integrates them into the monitoring. You can set very short measuring intervals to record short-lived containers and automatically remove containers from the monitoring.
Checkmk also integrates with Prometheus and enables efficient collaboration between developers and IT admins.
DevOps engineers and developers can use the data obtained to optimize software and processes.
Checkmk integrates with Grafana to create meaningful graphics, and it can store the information indefinitely. This way, you can use the insights gained for new projects.
I like that almost everything in the software can be customized. I can create checks for my self-written apps or monitor unusual use cases.
FAQ
Does it make a difference for monitoring whether my virtual servers are publicly accessible or if I want to use them as a single-tenant server?
Such differences can be addressed in monitoring, but you don't have to. Checkmk offers functions, for example, to send alerts when unknown IP addresses are accessed.
I have to migrate my server to a new host. How long does it take to adjust the monitoring?
The effort required is relatively low because Checkmk can obtain the information directly from the virtualization platform. If the host is in a different network, the Checkmk instance must be running there but can easily manage it via Distributed Monitoring function.
Do I have to do anything special with the firewall rules for virtualized servers?
No, adjustments are not necessary. If you use Windows systems on the virtual servers and monitor these via the Windows agent, an exception rule for the Windows firewall may be required, but this is not related to virtualization.
What is Memory Ballooning, and how does it complicate virtual server monitoring?
Memory Ballooning is a hypervisor feature used to reclaim idle RAM from one virtual machine and allocate it to another that needs it more. Inside the guest operating system, this appears as an artificial spike in memory utilization because the hypervisor's "balloon driver" inflates to lock down those RAM blocks. Standard server monitoring might trigger a false critical alert for low memory. Monitoring platforms like Checkmk solve this by cross-referencing host-level hypervisor metrics with the VM's internal status. This allows administrators to track actual physical consumption and avoid alert fatigue caused by dynamic resource shifting.
I want to move my servers from my own data center to the cloud. Does Checkmk support cloud servers?
Yes, Checkmk is predestined for hybrid environments, and it can monitor servers of all kinds efficiently.