The Complete Guide to Container Monitoring
The use of containers has become increasingly popular in recent years. Containerized applications offer many benefits, including resource efficiency, portability, and the ability for development and DevOps teams to develop, manage, and deploy applications faster and more securely. This is why container observability has become critical.
Container monitoring helps to ensure the reliability, security and performance of containerized applications, as the use of highly distributed container environments presents new challenges for performance monitoring and troubleshooting.
TL;DR:
Container monitoring is essential for ensuring the performance, reliability, and security of containerized applications in dynamic, cloud-native environments.
- It tracks container health, CPU and memory usage, and node performance, providing insights for scaling, resource optimization, and troubleshooting.
- Containers’ ephemeral nature and shared resources make monitoring challenging, requiring automated discovery, inventory, and scalable metrics collection.
- Monitoring solutions like Checkmk integrate with Docker and Kubernetes to visualize metrics, track pods, deployments, and DaemonSets, and deliver intelligent alerts.
What is container monitoring?
Container monitoring is the process of providing the visibility needed to ensure container health and performance. It includes continuous monitoring of the containers themselves as well as the nodes on which the containers are running, making it an essential part of a cloud-native environment and a key factor in maintaining a robust container ecosystem. This process allows you to track metrics related to the performance and health of containerized applications while gaining monitoring insights into container behavior. These insights can also be used to efficiently scale the container environment.
Typical metrics checked by container monitoring tools include the total number of containers, container memory, and CPU utilization. Monitoring solutions with automatic service discovery and the ability to automatically add or remove containers for monitoring can greatly simplify the workflow.
Powerful all-in-one monitoring tools such as Checkmk provide all needed insights that allow you to make the best use of your static and dynamic IT stacks.
Who uses container monitoring?
The density of containerized applications and runtimes is on the rise. Small and large organizations use containerized environments in their DevOps application deployment strategies.
Docker is currently the most popular platform for building, deploying, and managing containers. More than 13 million developers use Docker for more than 7 million applications.
And Kubernetes has rapidly become the most popular platform for managing containerized workloads and services. As of 2022, over 60% of organizations worldwide have adopted Kubernetes.
To ensure smooth container operations, companies that use containers should also monitor them.
Why monitor your containers?
Container monitoring can be used to track the performance and reliability of container environments. For example, you can use the information provided by a container monitoring solution to identify bottlenecks and resource issues in real time, determine if containers are undersized or oversized, detect problems and failures in applications, verify that the number of microservices are within the expected range for a single application, or ensure that an orchestration tool's dynamic scaling is working properly, and that loads are distributed evenly across containers.
Container monitoring should always be part of a comprehensive monitoring system that provides visibility into the entire IT infrastructure. This allows organizations to better understand their IT and link the performance of containers to the performance of other IT services. Monitoring containers not only helps to manage existing and potential problems, but also to continuously optimize the deployment. The result is better application performance and uptime, and a better user experience.
Challenges faced when monitoring containers
The benefits for deploying containers are obvious. At the same time, the natural behavior of containers requires a different approach to monitoring than physical hardware. While retrieving monitoring data, monitoring status, and setting thresholds are the same for both types of deployments, that's about it. Containers are ephemeral and can have a lifespan of only a few seconds, making it difficult to track changes. Containers also share resources, making it difficult to know the health of an application and the performance of containers.
The main challenges in monitoring containers are:
- Tracking containers throughout their lifecycle.
- Scaling monitoring as the container environment grows.
- Checking the resource usage of individual containers and shared resources such as storage.
- Defining reasonable thresholds for alerting on problems.
To overcome these challenges, container monitoring requires solutions that have the following features, among others:
- Automatic detection to discover new containers and add them to monitoring.
- Automatic inventory of all hardware and software aspects of nodes and containers.
- Simple scalability of the monitoring.
- Recording of performance metrics such as CPU utilization, memory, or network transfer rates of the individual containers.
- Visual representation of container metrics for easier problem detection.
- Support for orchestration tools such as Kubernetes or Docker Swarm or cloud platforms on which containers are hosted.
How container monitoring works: Methodologies and key metrics
There are two ways to monitor containers. One is to use the command line of orchestration platforms, such as Docker or Kubernetes, to access logs and information about the containers. This gives you a basic overview, and you can use the logs to analyze possible causes of errors. However, the main drawback is that manual monitoring is inefficient and time-consuming, and it's easy to lose track. In addition, this method does not provide alerts when problems occur.
The second option is to use a monitoring solution that is designed specifically for effective container monitoring and that provides all the necessary visibility into container resource usage along with features such as historical data analysis, data visualization, and alerting.
How can you monitor containers in Docker?
The Docker command line includes some commands that you can use for monitoring Docker containers:
- The
docker stats [OPTIONS] [CONTAINER...]command displays real-time resource usage statistics for all running containers, providing insight into CPU, memory usage, memory limit, and network IO metrics. If you wish to focus on specific container(s), you can specify a list of container names or IDs separated by spaces. - You can view the running container list using the
docker ps [OPTIONS]. Use the-allcommand to show all containers. - You can use the
docker top CONTAINER [ps OPTIONS]command to view the processes for a specific container.
Alternatively, Docker containers can be monitored with a monitoring solution. The benefits of dedicated container monitoring software include:
- Detailed information about the performance and resource usage of Docker nodes and containers. For example, CPU utilization, memory usage, and disk I/O.
- Visualization of key metrics and time series data in dashboards.
- Contextual information for effective root cause analysis and complex problem-solving.
- Storage of historical data to analyze trends or changes in the Docker topology.
- Alerts on critical events or anomalies in the container environment.
For example, Checkmk uses an agent to obtain detailed information about the Docker node and every single container.
How can you monitor containers in Kubernetes?
Kubernetes provides the ability to monitor containers through the metrics server. This makes it possible to retrieve a limited set of metrics, such as CPU and memory utilization, via the Kubernetes Metrics API. With the Kubernetes Dashboard, the container platform also offers a web-based user interface that provides a convenient way to manage and monitor the containerized applications in a Kubernetes cluster once deployed:
- The Kubernetes metrics server enables collecting metrics, such as CPU and memory usage, via the Kubernetes Metrics API.
- The Kubernetes Dashboard is a web-based interface that allows you to:
- Deploy and troubleshoot applications.
- Manage cluster resources.
- Monitor containerized applications running and modify Kubernetes resources like deployments, jobs, and daemon sets.
- Perform actions such as scaling deployments, initiating rolling updates, restarting pods, and deploying new applications.
- Gain visibility into cluster resources and errors.
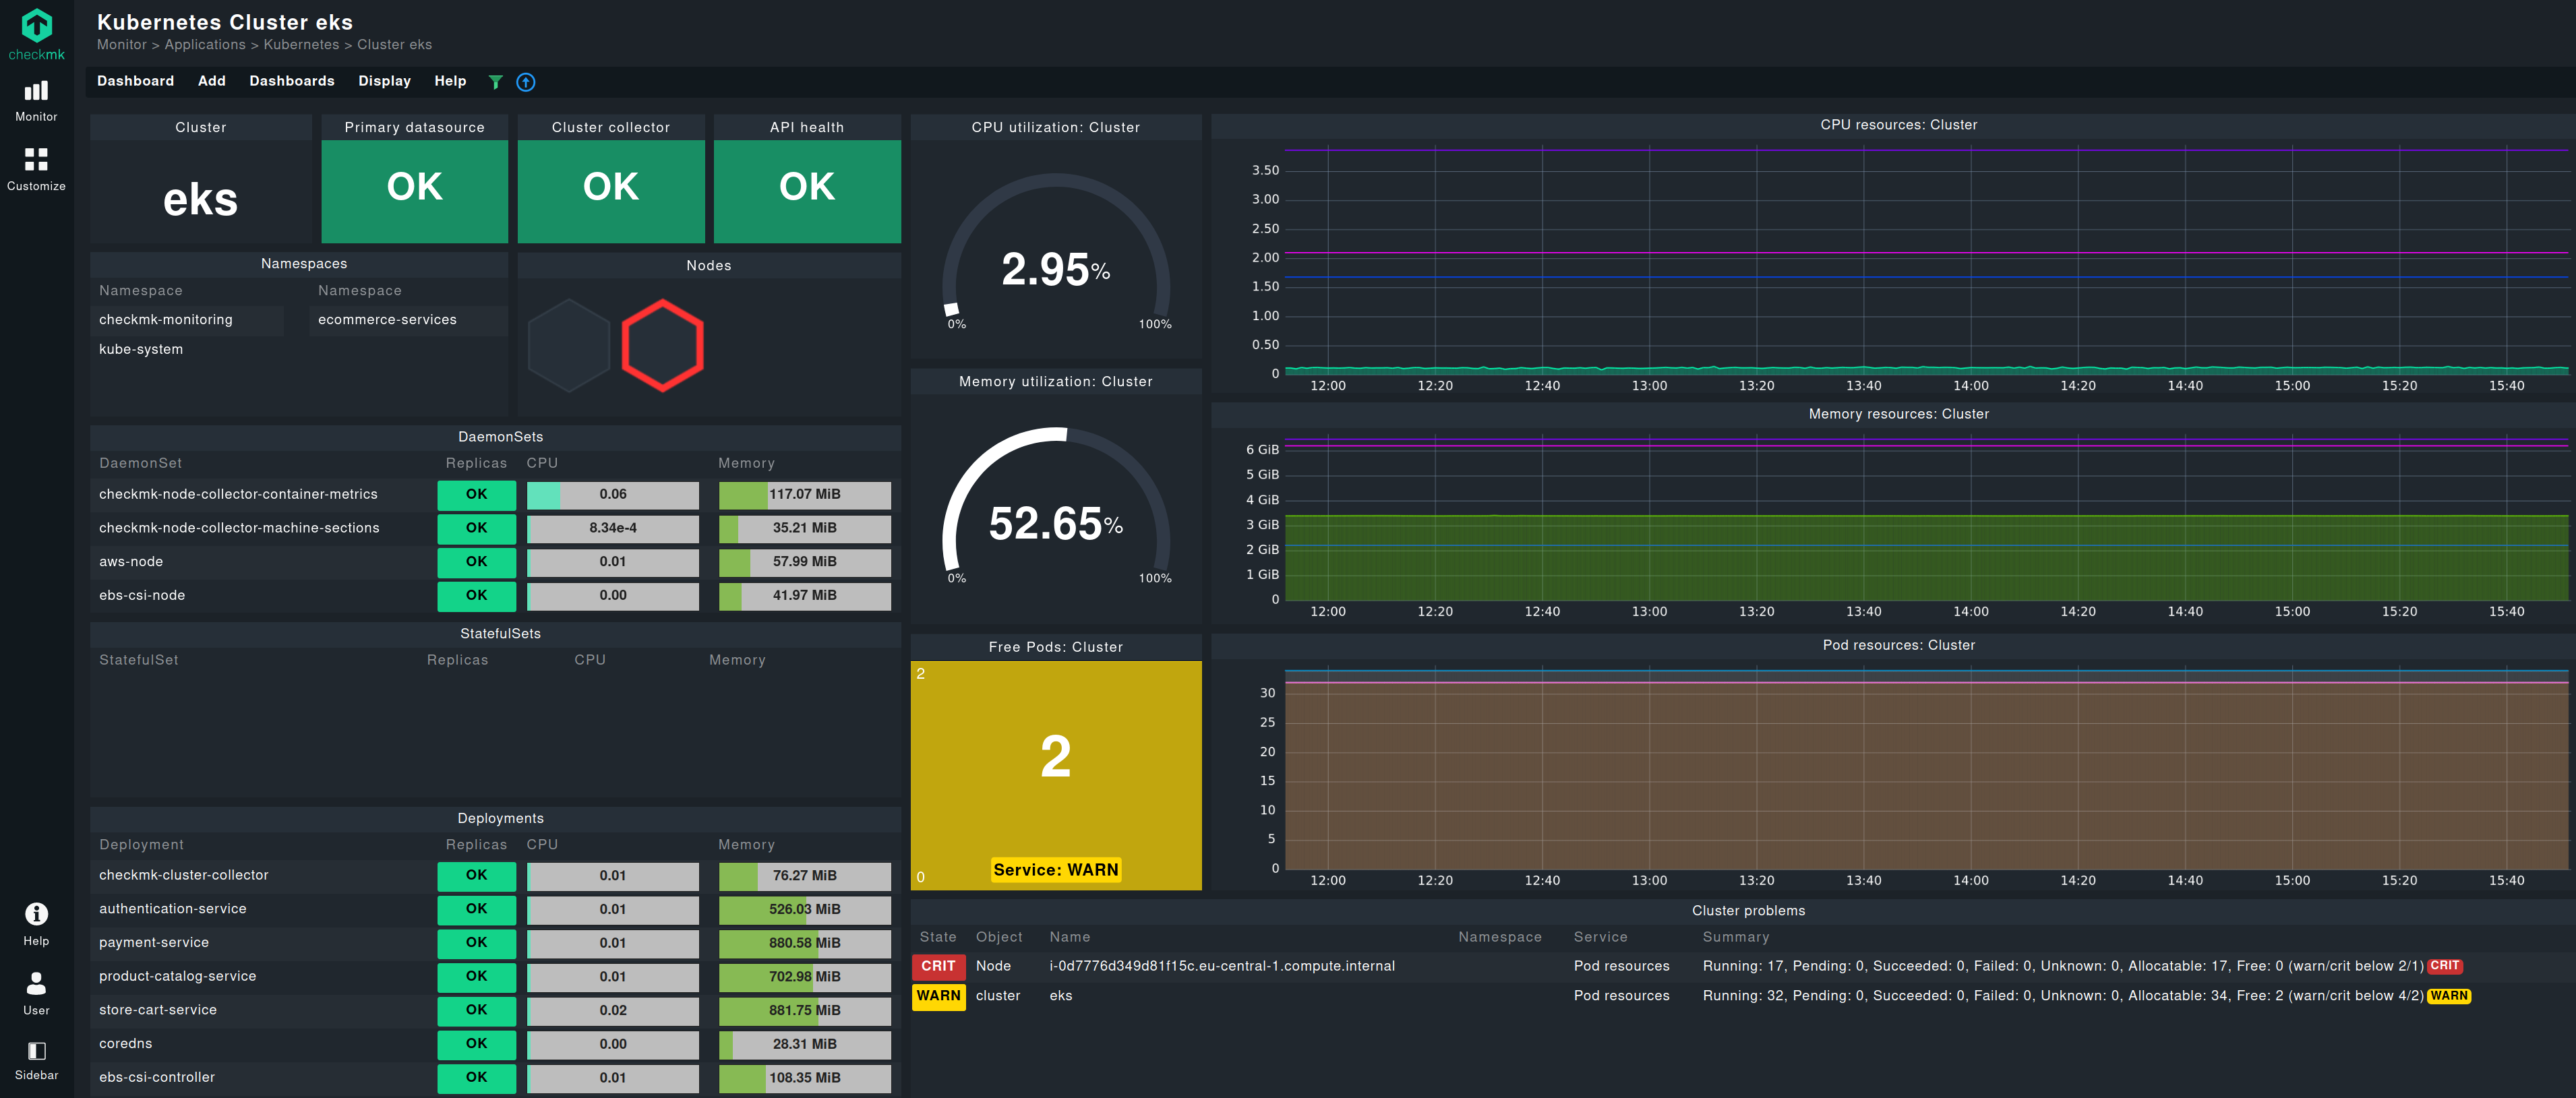
Checkmk uses the API server to get basic information about the cluster. The Checkmk Node Collector and the Checkmk Cluster Collector, which provides information about how much memory a DaemonSet is currently consuming, offer a comprehensive picture and detailed insights into container behavior. Integrating a dedicated Kubernetes monitoring software like Checkmk enhances capabilities by:
- Collecting an extensive set of metrics beyond Kubernetes' default monitoring scope.
- Monitoring Kubernetes components – including clusters, nodes, deployments, pods, daemon sets, and stateful sets – while tracking key metrics such as CPU, memory, file systems, disk I/O, kernel performance, and threads.
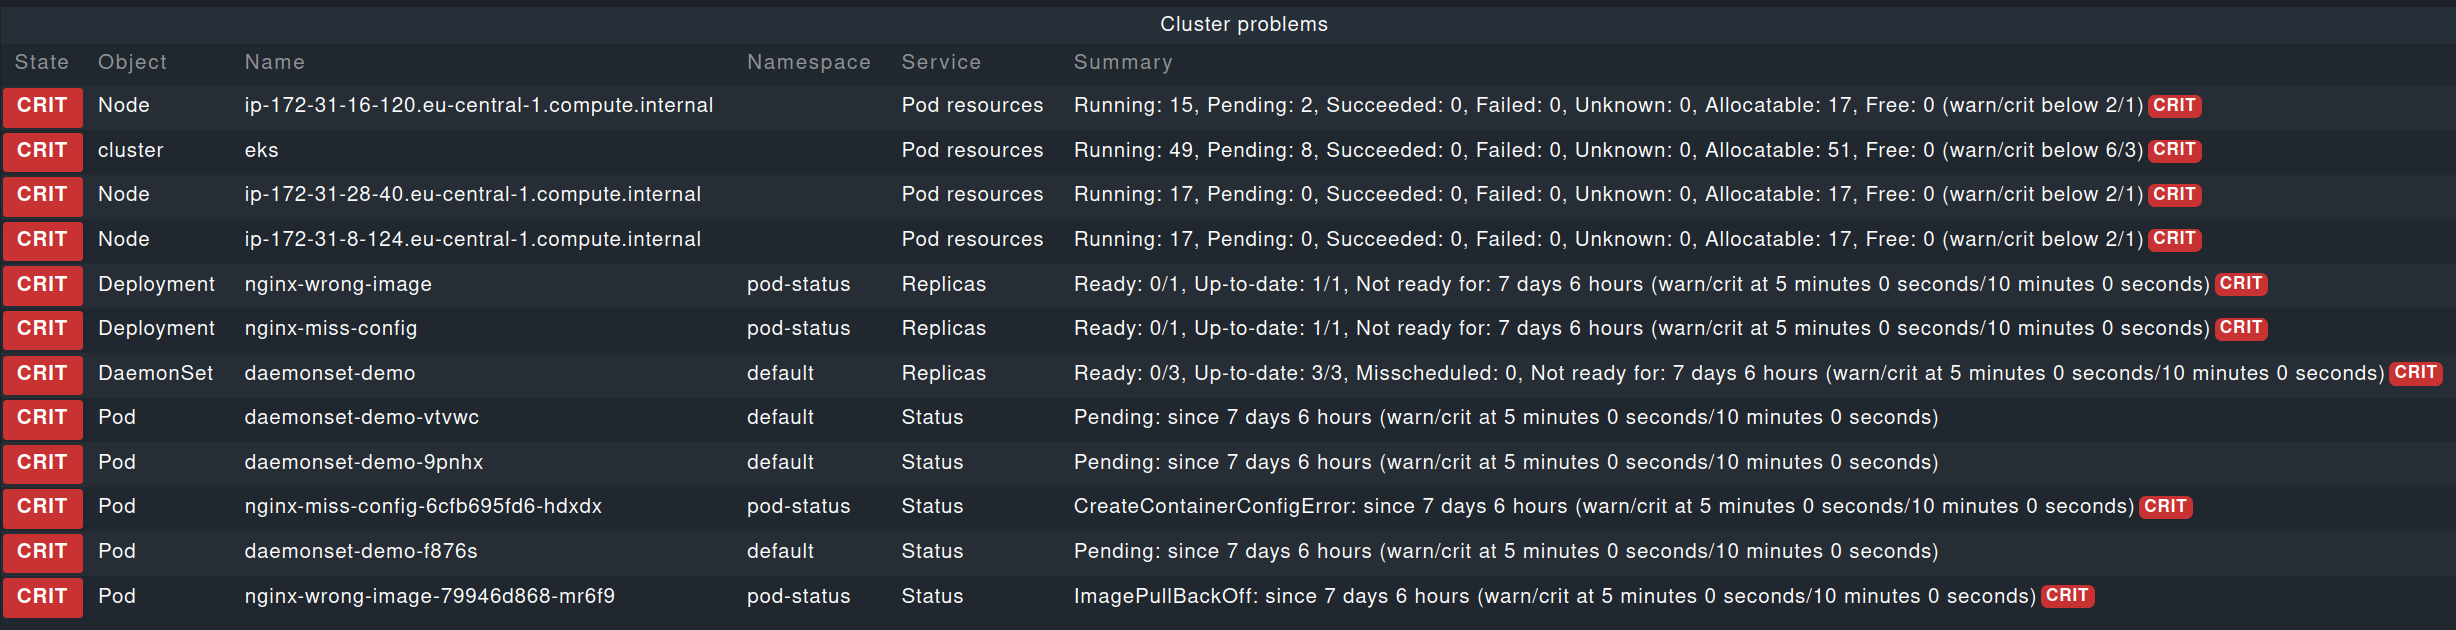
- Intelligent alerting: Checkmk Kubernetes monitoring provides smart alerts that account for Kubernetes' self-healing features, notifying you only if issues persist beyond a certain threshold.
- A comprehensive view of your Kubernetes environment through Checkmk’s interconnected dashboards, offering valuable contextual information for troubleshooting and high visibility into containers.
Essential features of a container monitoring tool
When evaluating a container monitoring solution, the following aspect should be considered:
Real-time monitoring of all key metrics in the container environment for immediate detection of problematic states of existing applications or identification of CPU or memory bottlenecks, instabilities, or heavy consumers. Monitoring solutions must be capable to provide:
- Support for monitoring all components of the container platform in use, including clusters, nodes, deployments, pods, DaemonSets, and StatefulSet for Kubernetes.
- Precise alerting when real problems occur, including detailed root cause information.
- Data visualization for easier analysis of dynamic relationships.
Final thoughts
The widespread adoption and growth of containers is a testament to their benefits to developers, organizations, and users. Monitoring plays a critical role in ensuring the availability, performance, security and compliance of containerized workloads.
It is important to use a monitoring solution like Checkmk that can handle the unique requirements of container applications.
FAQ
What are Docker container logs?
Docker automatically generates output and error streams for containers. Docker container logs aggregate these output streams. You can analyze Docker container logs to evaluate container performance and health.
What is container resource monitoring?
Container resource monitoring refers to measuring host resources (CPU, memory, network, storage, etc.) used by a container during its lifetime. You can monitor the resource usage of individual containers and the total resource usage of all containers running on a node. The advantage of container resource monitoring is that it allows you to be proactive. Instead of reacting to resource unavailability that leads to performance degradation, you can add or free up resources well in time so that your container and application performance are unaffected.
What do we mean when we say that containers are 'ephemeral' in nature?
The "ephemeral" nature of containers refers to the fact that provisioning and destroying a container is a swift process. After starting, a container lasts for as long as required and is then destroyed by the container orchestration scheduler.