A Beginner's Guide to Kubernetes Monitoring
Kubernetes is one of the best container orchestration tools to help manage your containerized workloads seamlessly.
Before Kubernetes, DevOps teams and IT admins had to perform many manual steps to set up, manage and scale their containerized applications. Kubernetes revolutionized the process by providing automated deployment, management, and scaling of containers.
Kubernetes, also known as K9s, takes care of complex container orchestration tasks, which enables businesses to focus on the application instead. It's no wonder that tech giants like Google, Spotify, and Airbnb have adopted Kubernetes to scale their businesses. Understand the benefits of Kubernetes by reading our practical guide to Kubernetes.
While Kubernetes simplified the process of container management, it also increased the complexity of monitoring and logging different metrics important for DevOps teams and IT admins to keep things running smoothly. In this article, we will discuss Kubernetes monitoring in detail.

TL;DR:
Monitoring Kubernetes ensures that containerized applications run efficiently while helping DevOps teams detect and resolve issues proactively.
- Effective monitoring tracks clusters, nodes, pods, deployments, and namespaces to provide insights into resource utilization, performance, and potential bottlenecks.
- Native Kubernetes tools alone are insufficient for enterprise needs, so third-party platforms like Checkmk offer automated log aggregation, alerting, and holistic visibility across workloads and infrastructure.
What is Kubernetes monitoring?
Kubernetes monitoring refers to the proactive management of applications deployed on Kubernetes clusters. Proper Kubernetes monitoring involves tracking the status of the Kubernetes environment and helping to delve deeper into the utilization of resources. Before we dig into the details of Kubernetes monitoring, let’s take a look at the essential components.
What are the components of Kubernetes?
Components of Kubernetes include clusters, nodes, pods, namespaces, and deployments. Learn more about the Kubernetes objects in our blog “What is Kubernetes?”. Due to the dynamic nature of Kubernetes and the interaction of the various objects and functions, K8s has become quite complex. Monitoring helps cut through this complexity to ensure the smooth operation of the Kubernetes environment.
Why is it important to monitor Kubernetes environment?
Monitoring Kubernetes provides many benefits to businesses. Some core benefits include:
- Optimization of your Kubernetes environment. A proper monitoring tool provides insights into resource usage. Through properly configured monitoring, you can evaluate any under-usage or over-usage of the infrastructure and receive alerts if any defined metrics exceed a certain threshold.
- Efficient troubleshooting. The complexity of tracking an issue can be problematic. Monitoring Kubernetes through a monitoring tool will help to quickly pinpoint the logs and data to resolve the problem.
- Performance tuning. Based on the data provided by monitoring, you can fine-tune different components of your Kubernetes cluster without impacting application performance. If, for example, a Kubernetes pod is failing because of insufficient memory, you can allocate more memory to that pod.
Why use an IT monitoring tool to monitor Kubernetes?
The benefits of Kubernetes monitoring stand and fall with the capabilities of the monitoring solution used. Although there are already native Kubernetes monitoring tools build into Kubernetes, they are insufficient to gain all the benefits mentioned above. Tools like Kubernetes dashboard, kubectl, and log aggregation must be implemented, which in turn creates additional overhead. They are mainly suitable for status or log monitoring. For an enterprise-level containerized application deployed on a Kubernetes cluster, you need more.
The native monitoring tools lack the following vital features for monitoring:
- They lack automatic log collection and aggregation. With native tools, you must manually collect data and understand how to aggregate appropriately to gain meaningful insights.
- They cannot collect and evaluate audit data. Therefore, you cannot track audit events properly.
- They lack a comprehensive alert system based on resource metrics, pre-configured alarms, and log alerting.
Due to the weaknesses in native monitoring solutions, you need a third-party monitoring solution that remedies these aforementioned problems with simplicity and ease.
What are the key metrics in monitoring Kubernetes?
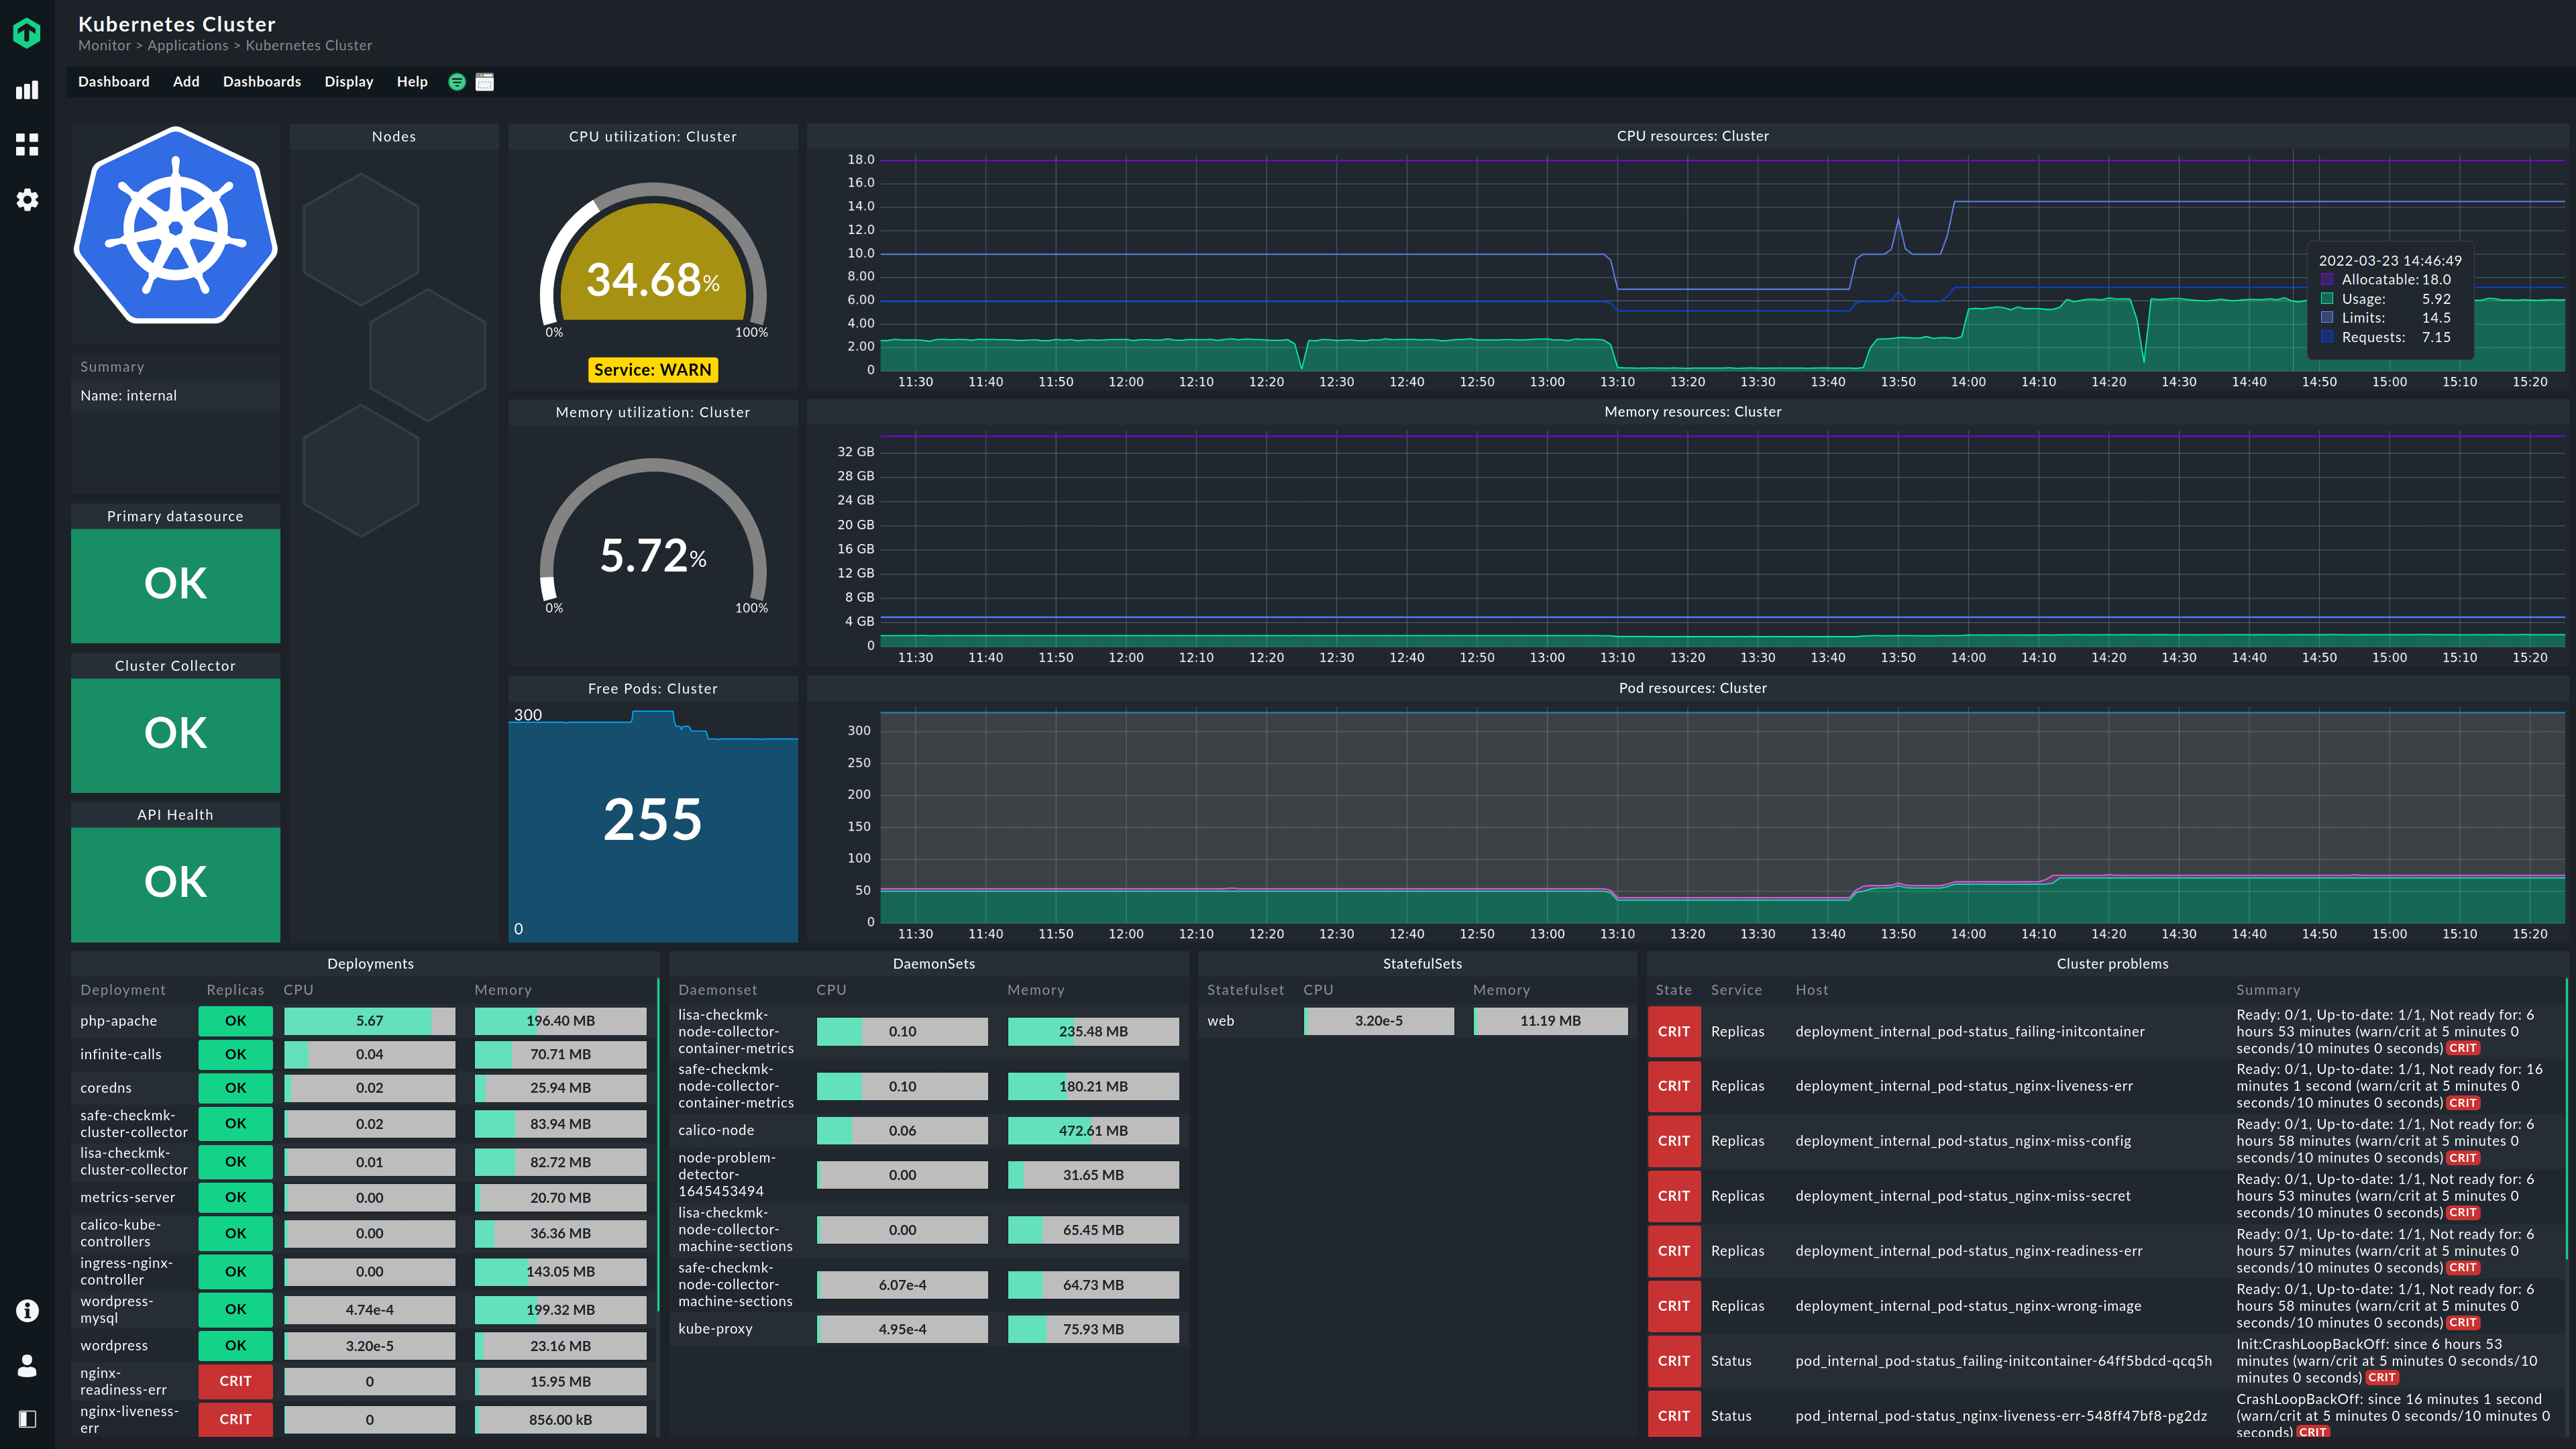
To get a general idea of the health of a cluster, you need to keep track of certain metrics. The key metrics include the number of nodes in a cluster, the resource utilization of the nodes, and the number of pods.
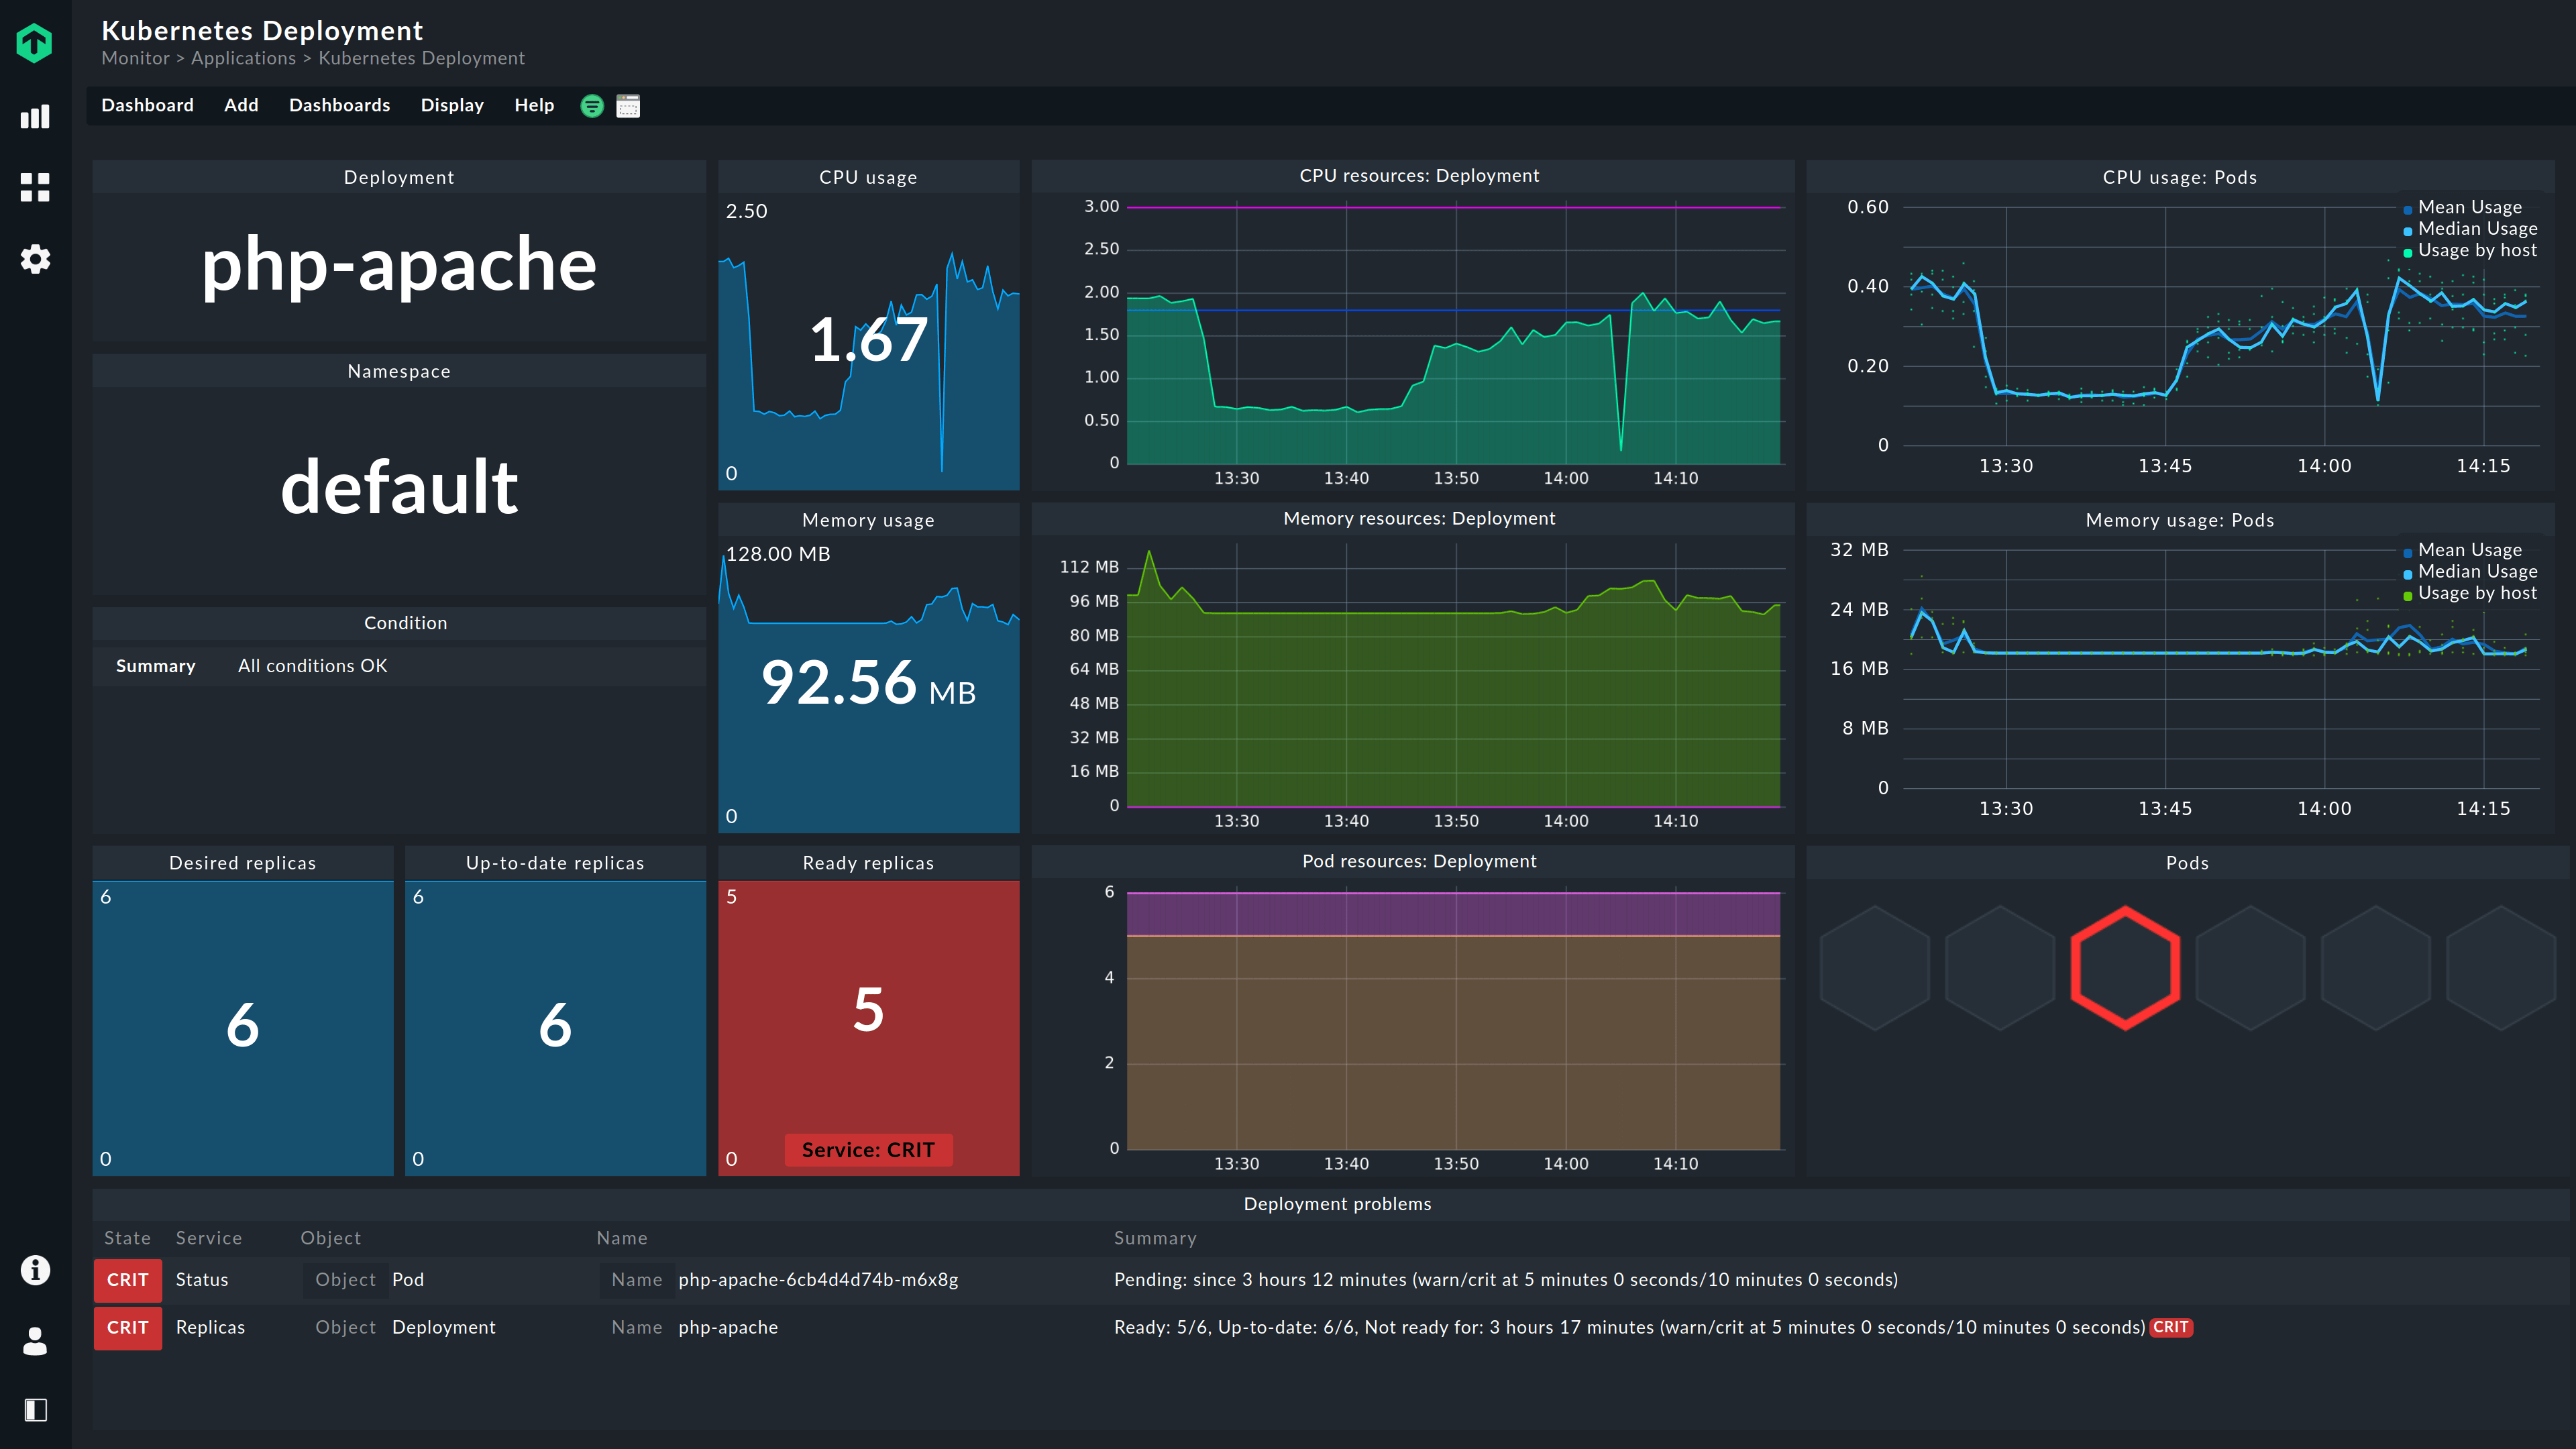
When monitoring pods, it is not only the resource utilization of the individual pods that matters, but also that of the respective deployment.
You can also monitor the health of deployments, such as whether the desired amount of replicas is available, as well as the containers and their performance.
You also have the possibility to get more detailed insights. For example, the monitoring tool should tell you if a container keeps crashing. Otherwise, since Kubernetes restarts it automatically, you cannot easily detect this yourself. Therefore, you should track the container restart counter to keep an eye on this issue.
General performance metrics you should monitor are, for instance, CPU, memory, file systems, disk I/O, kernel performance, and threads. The monitoring should also set appropriate thresholds to trigger alerts when needed.
How does Kubernetes monitoring work?
You can use native tools to monitor Kubernetes. You can also use tools that collect and save metrics for later analysis. Or, you can follow a more holistic approach by collecting metrics from each node, like Checkmk does. To get a holistic view, it makes sense to combine monitoring of the workloads as well as the underlying infrastructure.
In addition, you need to implement log aggregation to detect patterns or investigate problems.
However, the monitoring of different Kubernetes objects differs from each other.
How do you monitor containers in Kubernetes?
You can monitor containers via kubecetl. This is a get command for the API Server that provides a JSON file containing the container's status and events. If you have more than one container running in a pod, you need to specify to get the data from the wanted container. However the API does not provide usage metrics.
You can also use tools like Kubernetes Dashboard to get the data from a base metric in a user interface. However, you need to implement Dashboard, which results in some additional overhead.
To monitor containers, Kubernetes has the feature liveness check. Based on this, Kubernetes uses liveness probes to monitor whether the application is available or not. Alternatively, the status can also be determined using readiness probes, but usually liveness probes are used.
How do you monitor logs in Kubernetes?
Log monitoring is especially important for successful troubleshooting. With kubectl you can access the logs and start troubleshooting when you detect a problem.
Normally, however, one works with Health endpoints to monitor the status of applications. If something is wrong, the monitoring software sends an alert.
How do you monitor services in Kubernetes?
Services are responsible for the communication of the individual objects within a cluster. They assign a name and a unique IP address to a pod group and ensure that they are accessible to other pods.
However, the monitoring of a service is only interesting when it opens an application to the outside world. The service thus enables access to application endpoints. You can monitor these, for example, with an HTTP check in Checkmk and check the health of the application. So, in the end, you are not monitoring the Kubernetes object ‘service’, but you are using the application service to monitor the application and check whether it is running or not.
Why does Kubernetes fail?
There are many reasons why a Kubernetes cluster or pod might be faulty. The most common reasons include resource bottlenecks, configuration errors, dependency issues, network problems, and targeted attacks.
Some common pod error messages include:
- “CrashLoopBackOff”: The pod is failing to start or is crashing repeatedly.
- “ImagePullBackOff”: The pod is unable to pull the required container image.
- “ErrImagePull”: There was an error pulling the required container image.
- “ErrContainerNotFound”: The container specified in the pod's configuration could not be found.
- “ContainerCannotRun”: The container specified in the pod's configuration is unable to run for some reason (such as resource constraints or configuration errors).
Best practices for Kubernetes monitoring
Kubernetes monitoring offers you a lot of benefits. These best practices will help you find the right solution:
1. Find the right tool for your requirements
Know your requirements and choose the tool that fits your needs. A developer has different requirements for Kubernetes monitoring than the admin of a cluster. For a developer, it is fine to have a tool that can store all needed metrics for later analysis. A cluster admin, on the other hand, is responsible for resource management and must ensure, among other things, that enough resources are available, that nodes are available and healthy, and that a namespace does not consume all resources. Thus, the admin needs a monitoring tool that provides all of these critical insights and alerts.
Kubernetes is complex, and it is easy to lose track. Your monitoring tool must remove the complexity and be able to handle the dynamic changes in Kubernetes. It needs an auto-discovery and must be able to deal with changing workloads.
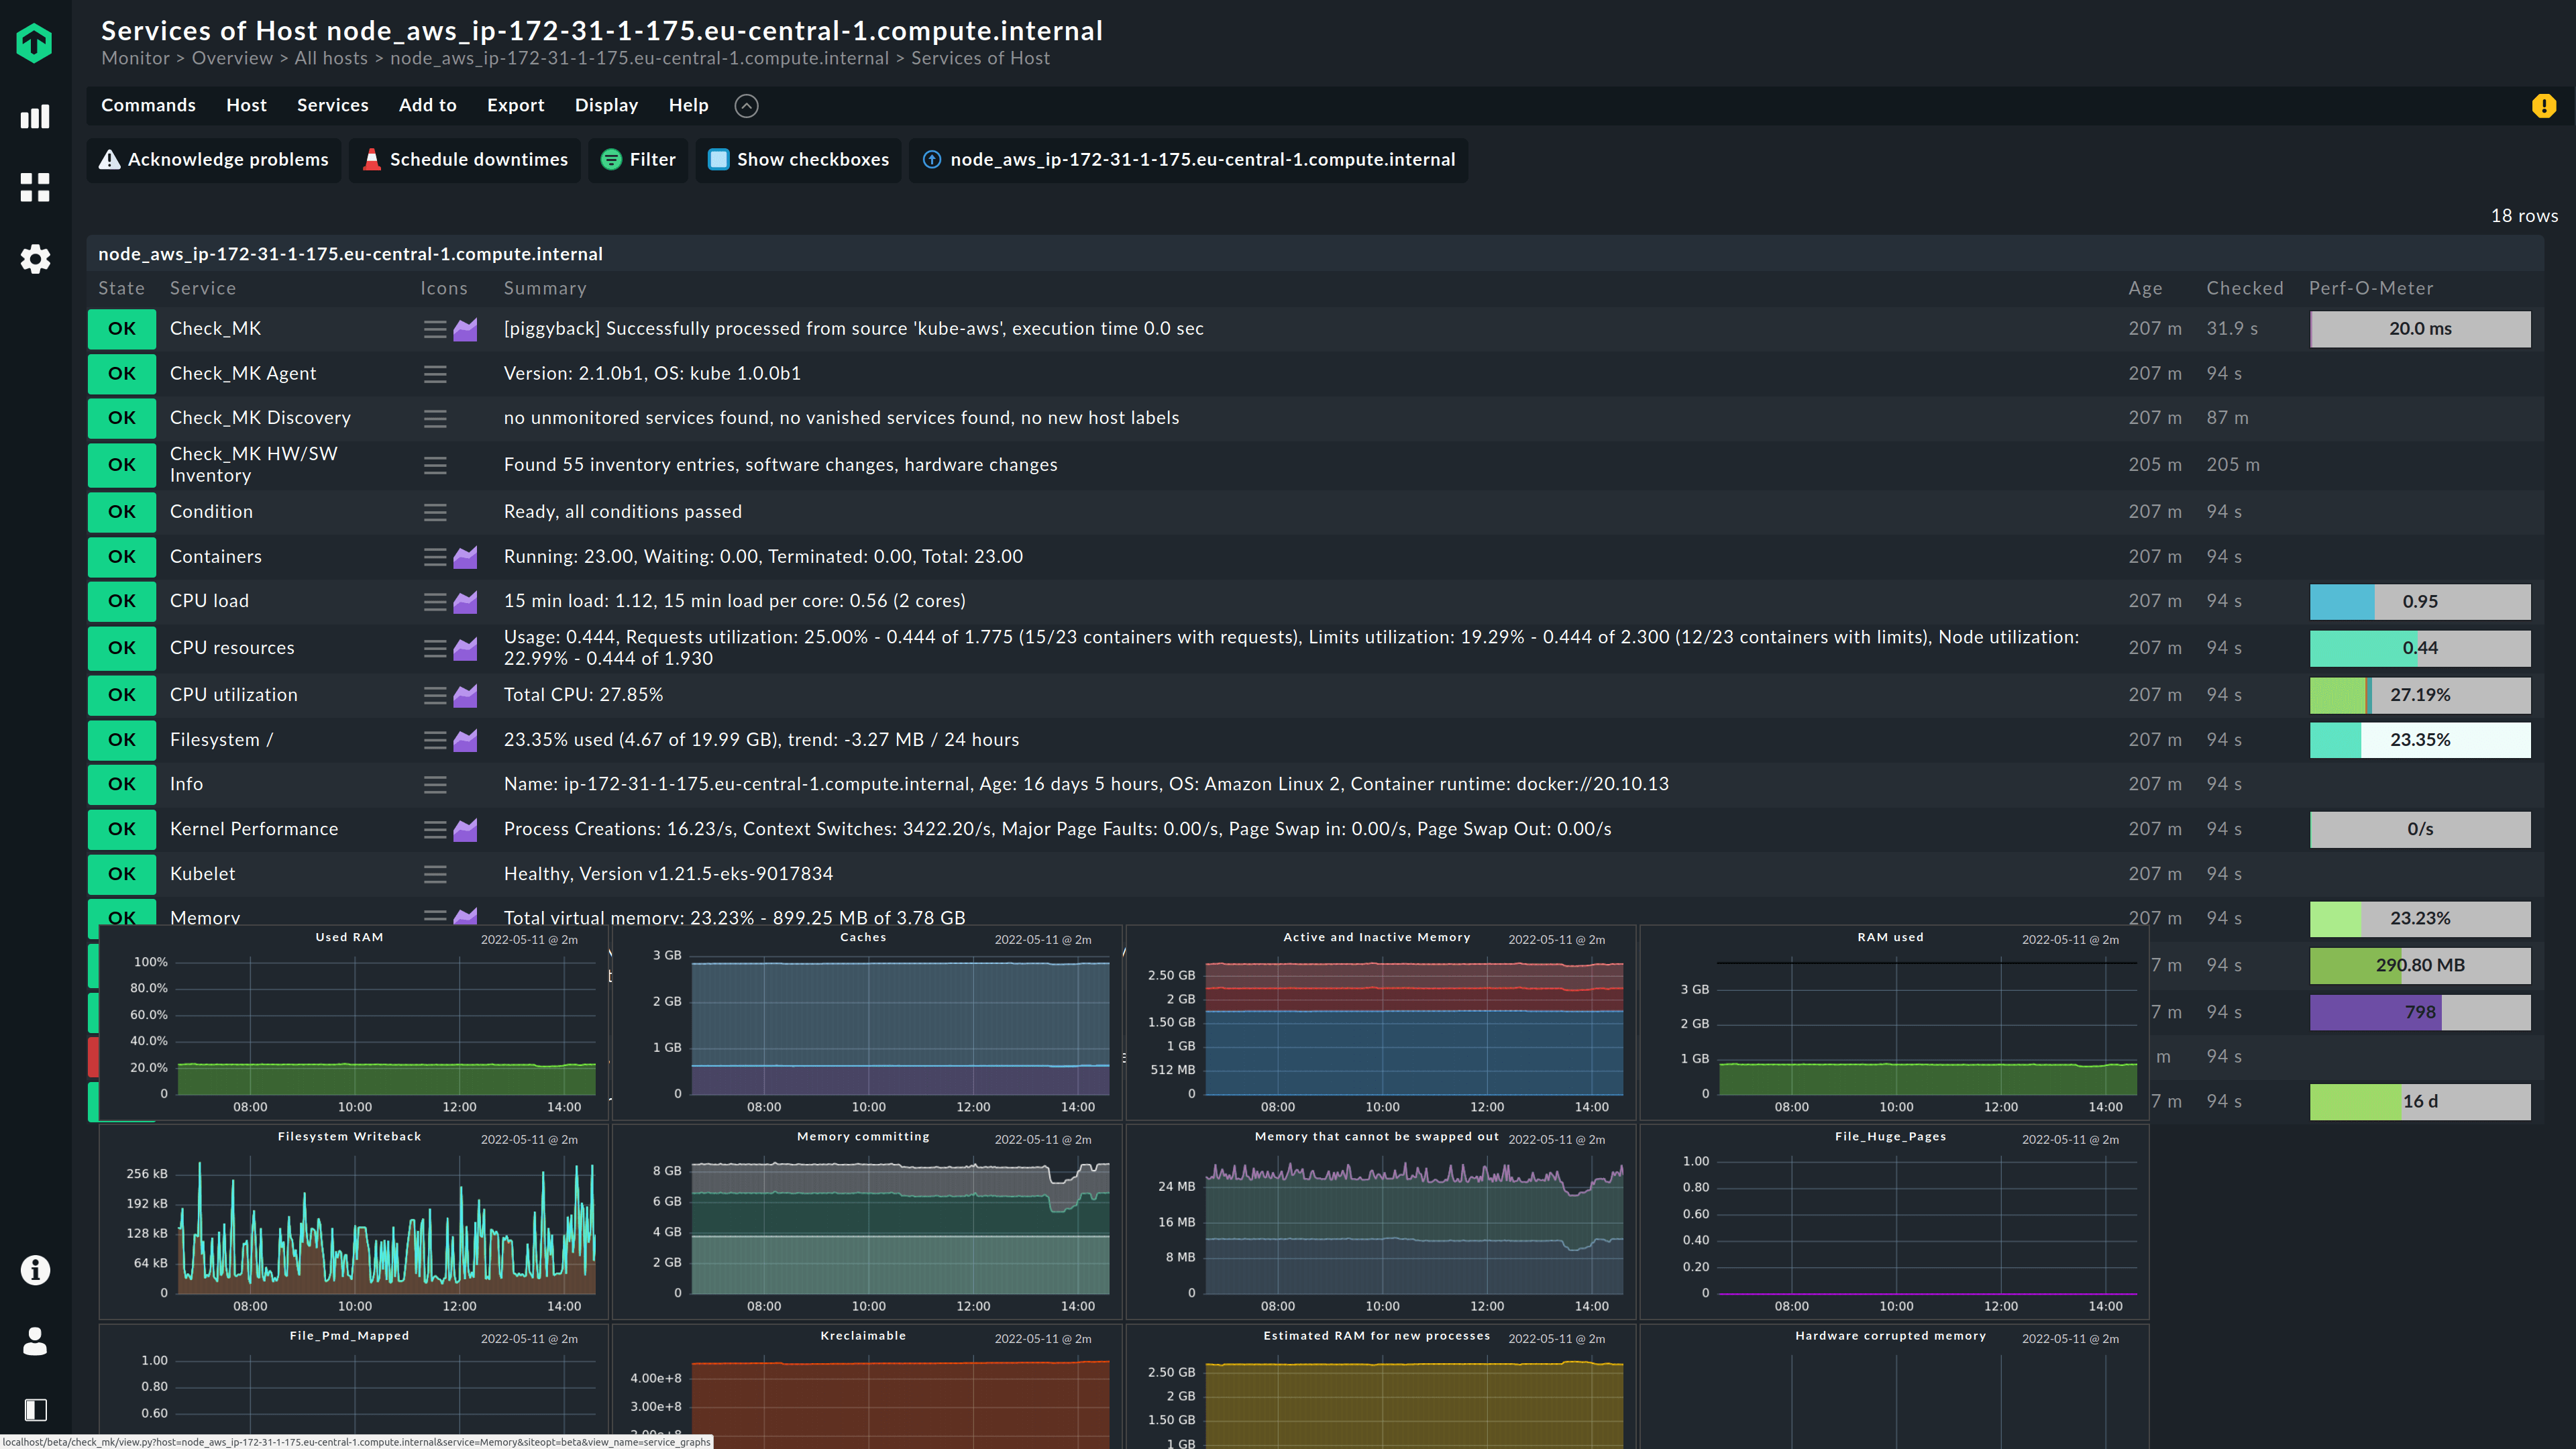
2. Get a holistic view
It is not enough to monitor your Kubernetes workloads. You also need to monitor the infrastructure your applications are running on – the worker nodes. This is also the case in managed Kubernetes environments. You need to know what is happening on your nodes, such as spawning zombie processes or applications that inadvertently fill your file system, as this can shut down your Kubernetes.
3. Keep the Kubernetes knowledge gap in mind
Do not depend on a single person, but rely on software that breaks down the complexity of Kubernetes. Even though one member of your team should be very familiar with Kubernetes to set up monitoring alerts, for example, the others with little or no K8s knowledge must also be able to understand and comprehend them.
Imagine the following scenario: Your Kubernetes experts are unavailable, and you need to set up an alert for a specific Kubernetes cron job. Let's assume the following alert has been set up or, as also often happens, simply copied from the Internet:

How would you go about this? Checkmk, for example, does not just provide pre-configured alerts for Kubernetes objects. It automatically assigns labels that allow you to easily customize the notifications to your needs.
Final Thoughts
Kubernetes as a container orchestration platform has changed the way enterprises build their containerized applications. It automates the deployment and management of large numbers of containers, which reduces manual work related to monitoring, rolling out, fixing, copying and migrating containers.
This article covered various aspects of Kubernetes monitoring. It introduced the basic architecture of Kubernetes, essential metrics for monitoring, core benefits, and best practices for effective monitoring.
Checkmk is a monitoring platform that also monitors your Kubernetes clusters. The Kubernetes monitoring software captures all the important aspects of your Kubernetes environment, and it gives you a holistic view of your nodes. Thanks to the interconnected Kubernetes dashboards, it also allows you to navigate from cluster down to pod level, so you can analyze interrelationships in your environment, even without prior Kubernetes knowledge. Join the Kubernetes Tour to see Kubernetes monitoring in Checkmk live.