Proxmox monitoring: How to do it efficiently with Checkmk
 on Jun 11, 2021
Proxmox is a total server visualization open-source Linux-based platform. The software blends two virtualization technologies for operating virtual machines (VMs) and containers.
This article discusses the technologies that drive Proxmox, its uses, why we need to monitor it, and how to set up its monitoring using Checkmk.
TL;DR:
Proxmox monitoring ensures efficient oversight of virtual machines and containers, helping IT teams maintain a stable and high-performing virtual environment.
- Checkmk allows continuous tracking of Proxmox nodes and clusters, providing real-time insights into VM performance, memory usage, storage, and backup status.
- Proper configuration of users, API access, and monitoring agents ensures accurate data collection and prevents missing or outdated information.
- Clustering and interface assignment in Checkmk maintains service continuity when VMs or containers move between nodes.
Technologies Involved
Proxmox uses the Kernel-based Virtual Machine (KVM) and Linux containers (LXC) technologies.
- Kernel-based Virtual Machine: an open-source virtualization technology that converts Linux into a hypervisor, allowing a host machine to run multiple guests or VMs.
- Linux Container: This technology refers to a set of one or more processes run by files provided from a distinct image, making it portable.
What Proxmox Virtual Environment (PVE) Does
Proxmox VE has a configuration interface that allows easy management of containers, VMs, virtual networks, and storage on the host systems. Generally, the platform operates as many Proxmox servers in a cluster but may also operate as a single node.
You need to include the Proxmox nodes and clusters when you monitor your IT infrastructure to guarantee the seamless operation of the VMs and containers that are Proxmox-managed.
To do that, you need to keep track of your PVE’s significant metrics to ensure timely and accurate identification and resolution of relevant issues. Checkmk has that capability.
Why Monitor Proxmox
Proxmox monitoring is essential to ensure real-time analysis of VMs and IT infrastructure. With this analysis, you will be given accurate, on-time insights into the state of your virtual environment.
You can monitor virtual servers and track down how Proxmox configuration affects your end-users. You can immediately spot the instance where an application poses a problem to the end-user, allowing you to identify the cause quickly.
The swift identification of problems permits technical teams to fix these problems before they escalate into bigger proportions, creating a collaborative and proactive environment.
The results of a well-monitored Proxmox will also serve as a data source for evaluating infrastructure performance trends. In turn, these trends create a basis for modeling optimum performance and predicting the impact of changes in the features of installed applications.
Preliminary Work for Monitoring with Checkmk
The first step is to ensure that you have completed the Proxmox VE configuration interface and the API access setup.
PVE Configuration
Go to the "Permissions" tab to create user 'checkmk' and realm 'pve' for your cluster. Proxmox authenticates the user; the inherent Debian does not.
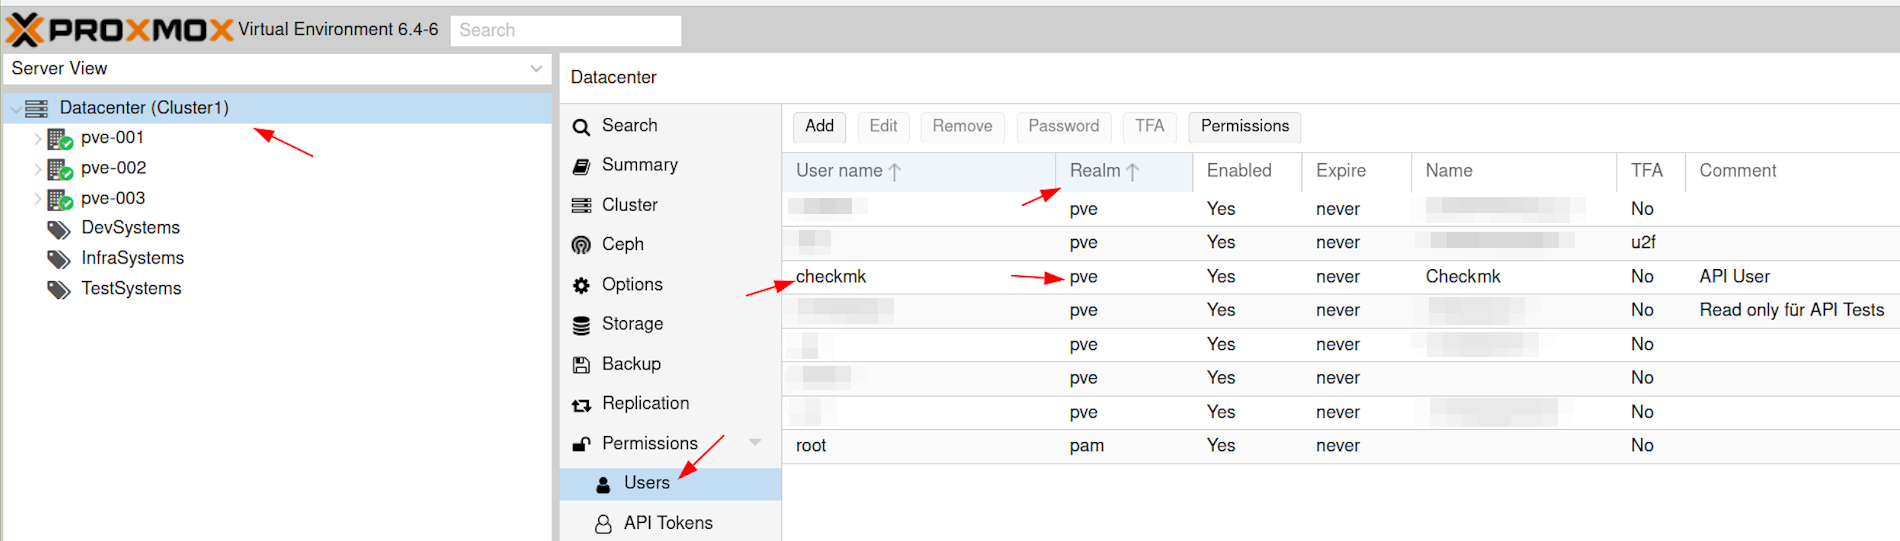
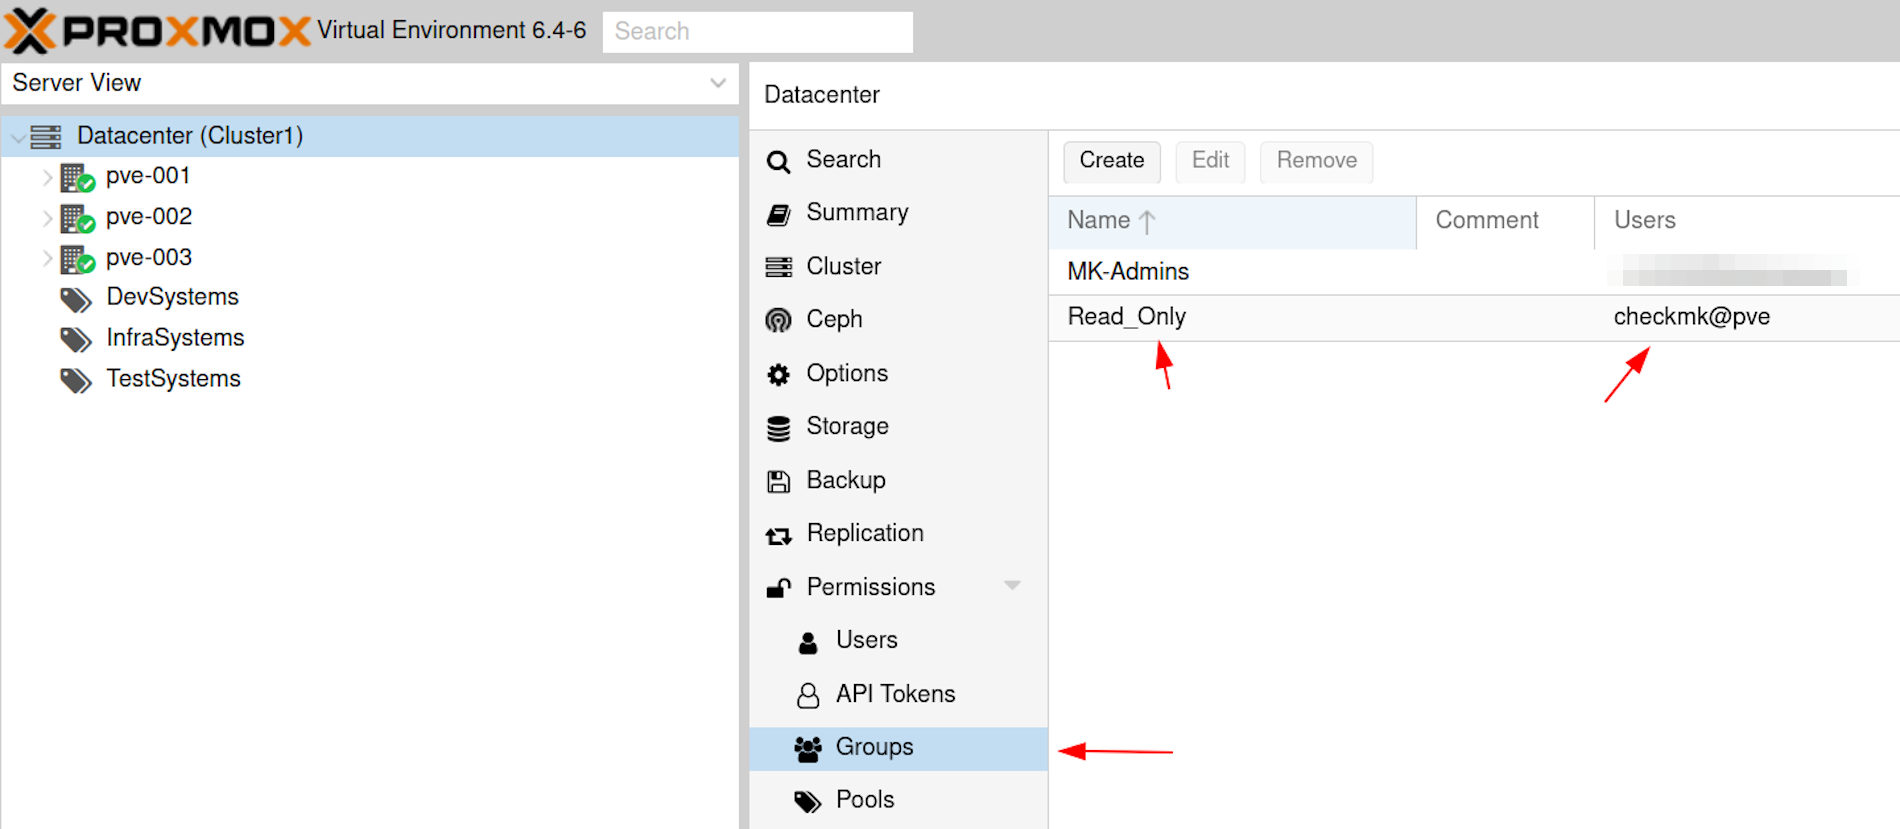
Then, designate the user you created to the 'Read only' group.
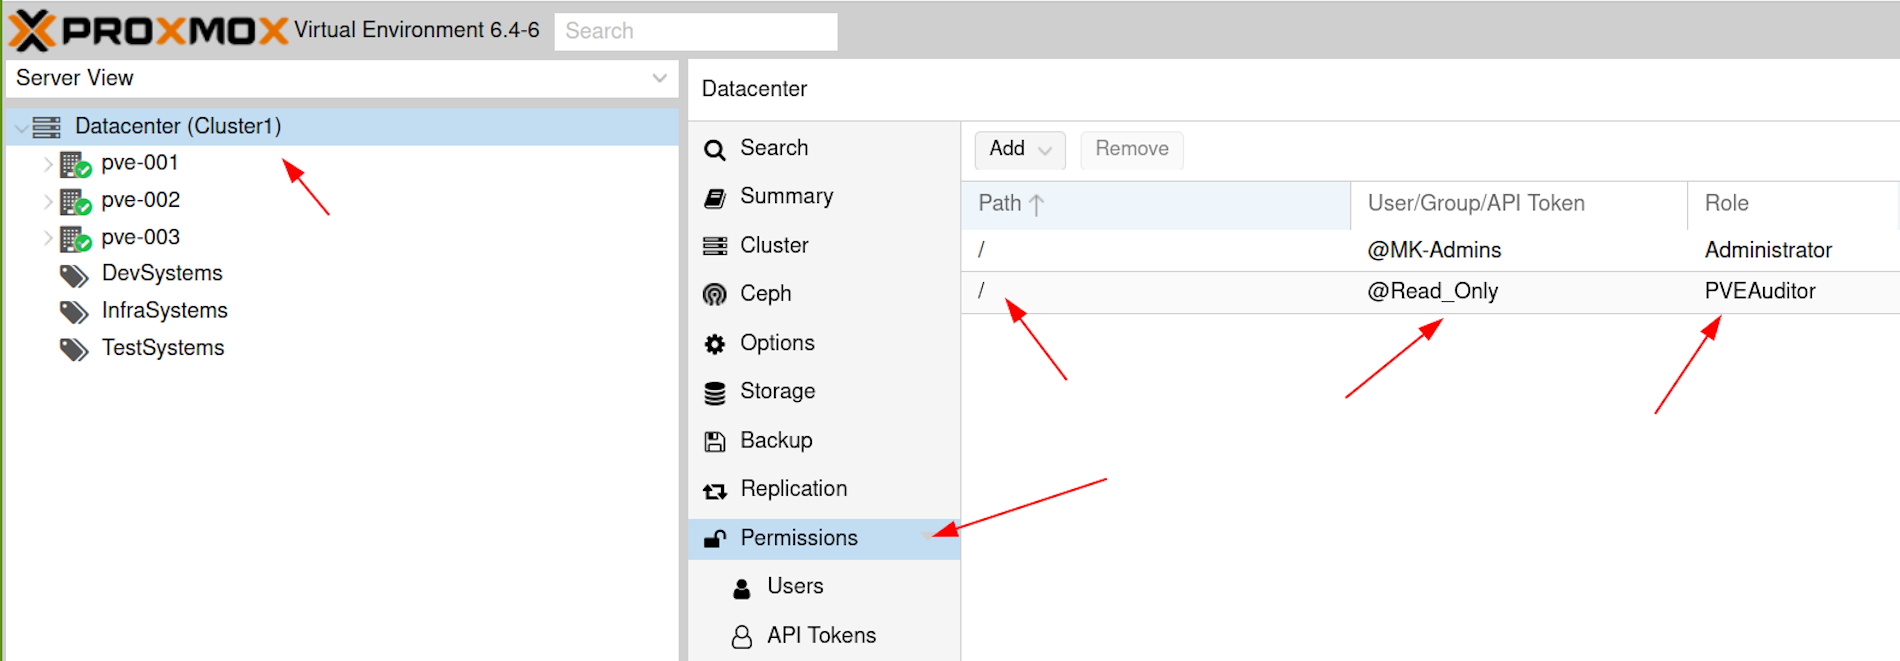
Hit 'Permissions,' still at the cluster level. Specify the intended path for the 'Read only' group, determining the point of origin for the API; that would be /, i.e., the root directory in our example.
We define the group's role here as 'PVEAuditor.' Combined with the root path, you, the user, may already view everything on the node. However, you would not have any other rights.
Installing the Checkmk Linux Monitoring Agent
Once you're done with the configuration, have the Checkmk Linux monitoring agent installed on your Proxmox nodes.
Follow the instructions on how to install the Linux agent. Then, query the monitoring data via port 6556 in the local network. If it is not in the local network, you can query in encrypted form through Secure Shell (SSH) using the public IP address.
Aside from the agent, configure and use the Proxmox VE special agent in Checkmk.
We suggest optimizing your network monitoring with Checkmk. Doing so would enable you to simply and efficiently monitor your interfaces.
Check out our blog article 'Three Rules to Rule Them All' to find a detailed guide on setting up a systematic network monitoring in Checkmk with only three rules.
How to Monitor the Proxmox Nodes
After completing the configuration, you can start to add your Proxmox nodes to the Checkmk monitoring.
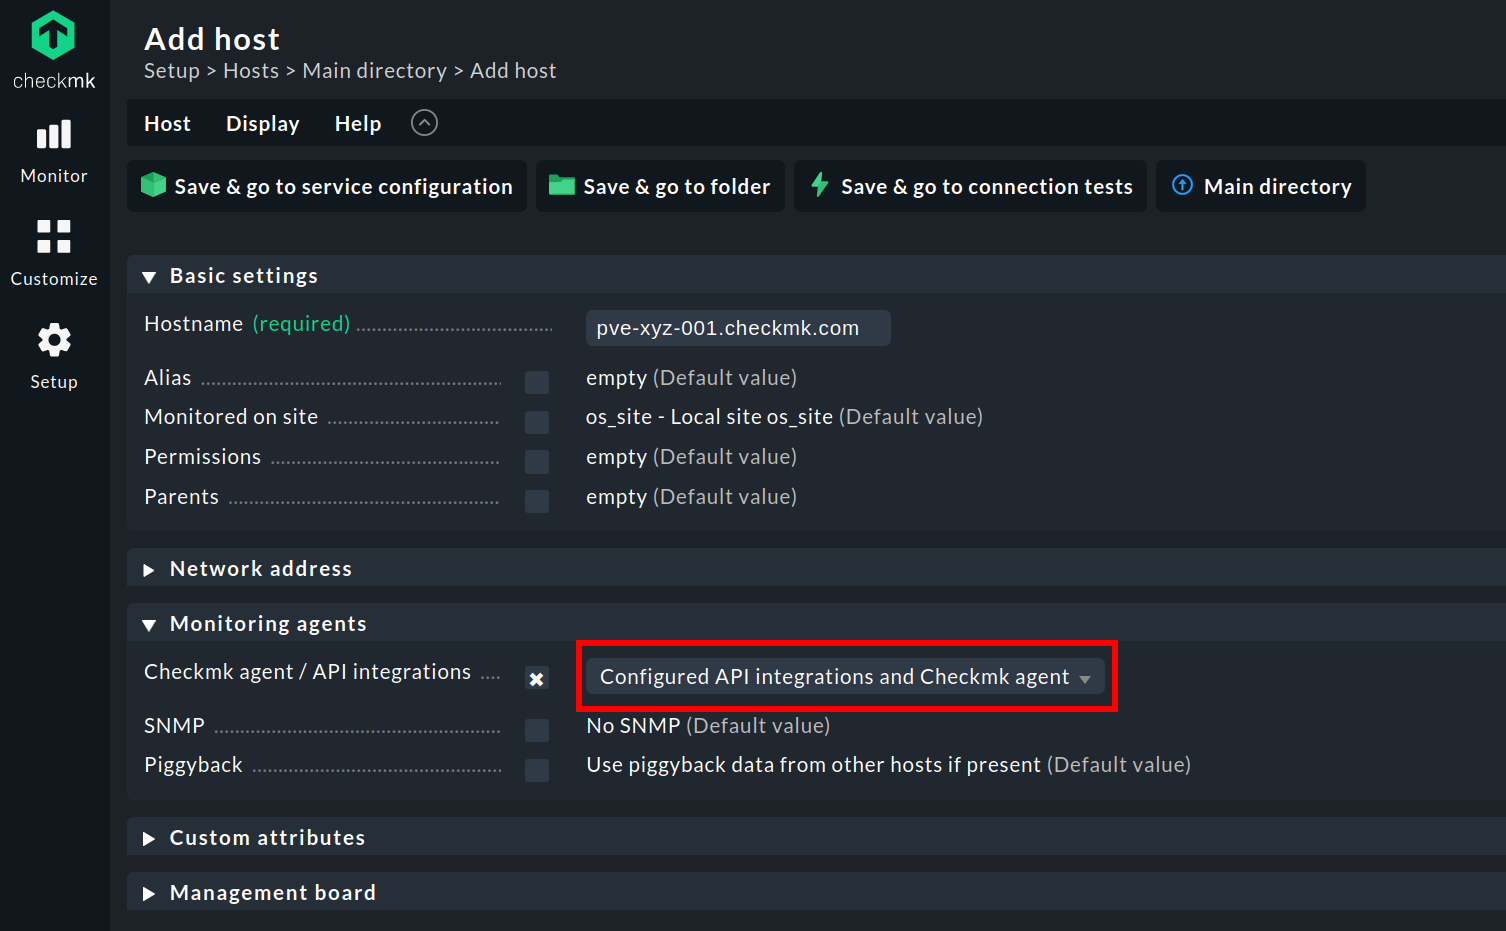
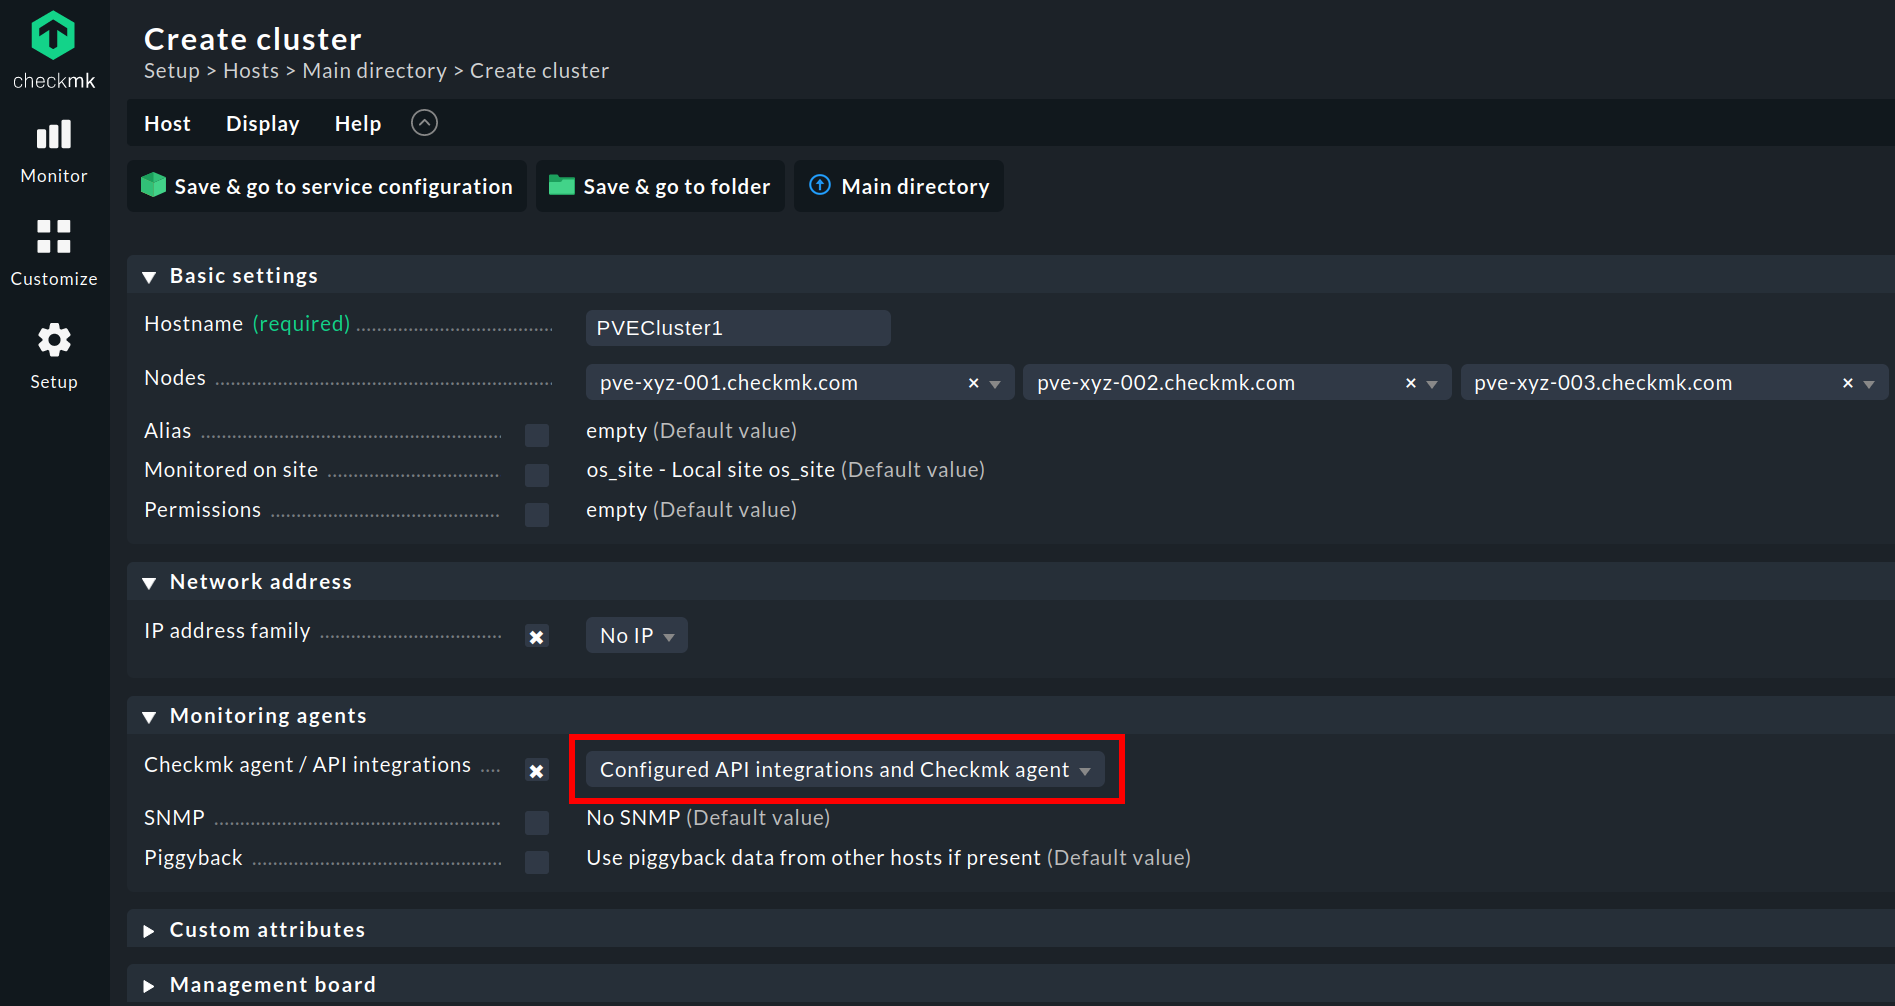
How to Add Proxmox VE Nodes to the Checkmk Monitoring
When you add the host, choose Configured API integrations and Checkmk agent in the section named 'Monitoring agents.'
Next, configure the special agent, the API integration through the following steps:
- Look for 'Proxmox' in the Setup menu.
- Pick the Proxmox VE rule under Agents ➳ VM, Cloud, Container.
- Enter the username created in Proxmox by entering [name]@pve in the Username field.
- Go to 'Explicit hosts.' Input your Proxmox cluster's nodes that Checkmk must monitor through the API integration.
- Save the rule and activate the changes.
Checkmk should be able to see all the services and various interfaces on your Proxmox hosts.
Note: The special agent mainly generates piggyback data. Therefore, you should select the Always use and expect piggyback data option in the Monitoring agents field in the settings of the receiving host (this would be a VM, not the Proxmox host itself). This will cause the Check_MK service to issue a warning if piggyback data is missing or out of date. Learn more about the piggyback principle.

If you follow the three rules in the blog mentioned above, you will have interface names similar to the Linux kernel, e.g., 'Interface ens16.' Interfaces with names that begin with 'bond' or 'eno' are with the local node and have been created by the virtualization for the VMs. VM interfaces begin with 'fw' and 'tap' depending on the config.
How to Monitor a Proxmox Cluster
We already have established that Proxmox servers operate as a cluster but can also run as single nodes. Chart the Proxmox cluster in your monitoring to prevent the above-mentioned VM interfaces from 'drifting' between the nodes as you shift a container or a VM from node to node.
Setting up the Cluster in the Monitoring with Checkmk
Find Hosts in the Setup menu, and under the Host tab, click on create new cluster. Name your cluster under Hostname before adding all the Proxmox servers you wish to designate to the cluster under Nodes.
Under IP address family, you will see a drop-down menu. Choose No IP from the menu. Despite each Proxmox node having its own IP, the Proxmox cluster does not have any, so it’s impossible to ping or query the cluster.
Go to Monitoring agents. Set the Checkmk agent/API integrations option to the same setting you set for the individual nodes: Configured API integrations and Checkmk agent.
If the cluster and nodes have a different data source, you will be alerted by an error message. Save the cluster after a successful configuration.
How to Assign Services to a Proxmox Cluster
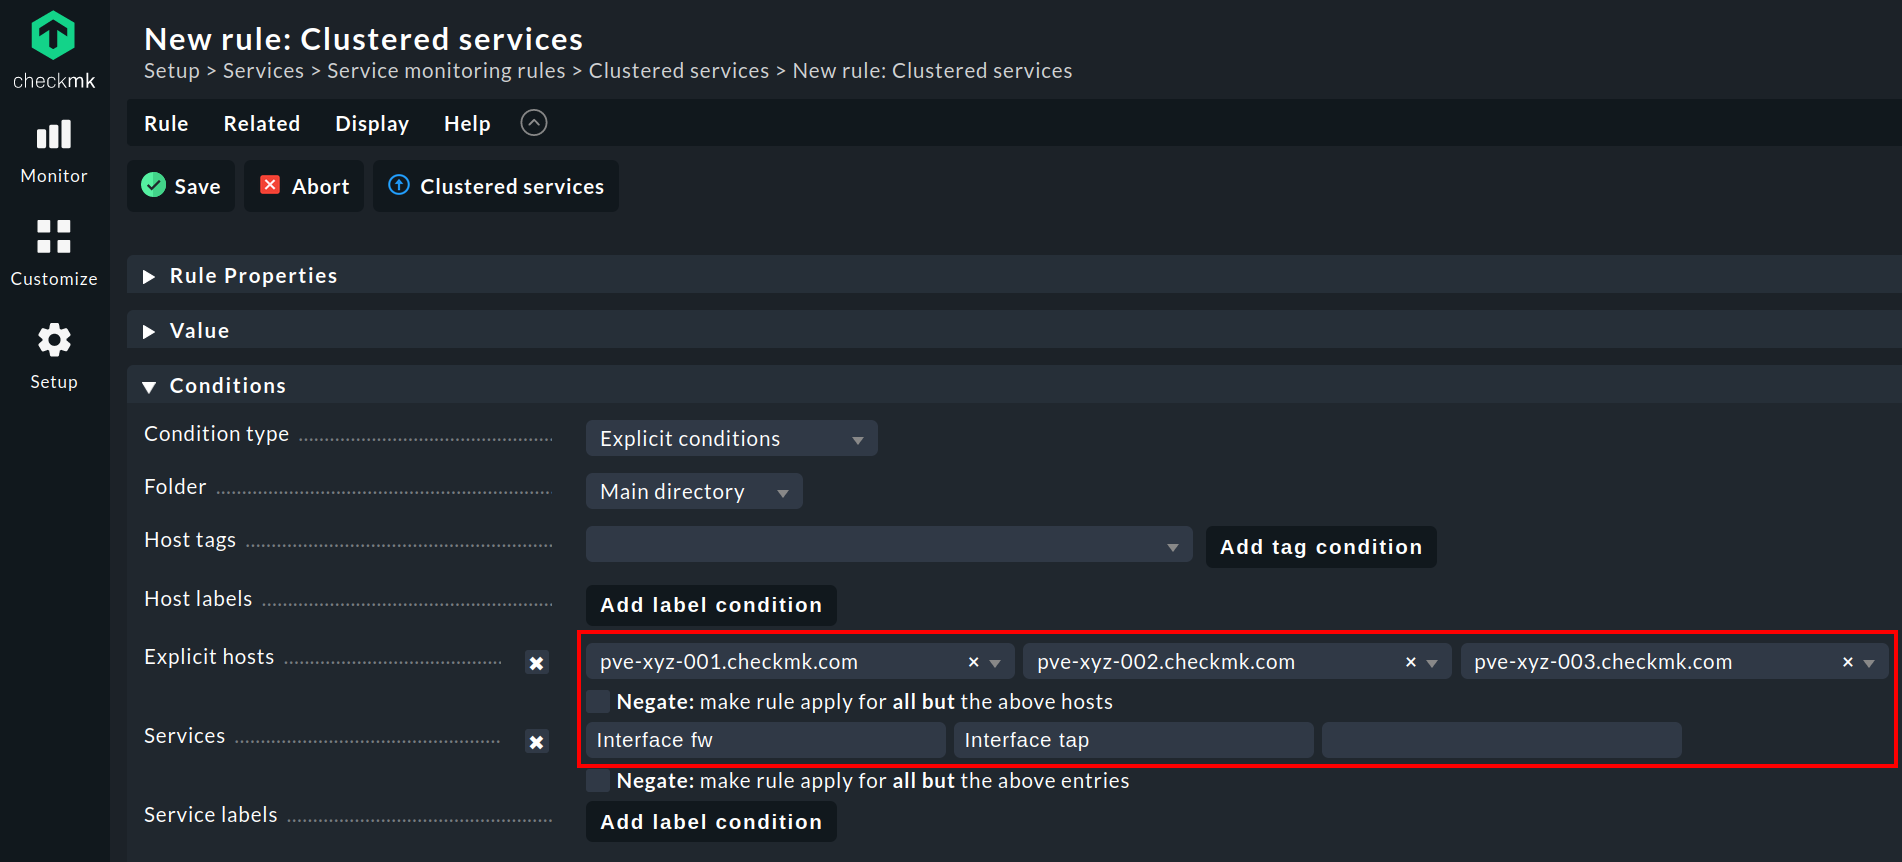
Type in 'clustered' in the search field In the Setup menu. Go to Service monitoring rules and choose Clustered services, redirecting you to another menu. From here, activate the Explicit hosts checkbox.
Put your Proxmox nodes to the displayed row. As an example, please refer to the screenshot. The nodes are 'pve-xyx-001.checkmk.com,' 'pve-xyz-002.checkmk.com' and 'pve-xyz-003.checkmk.com'.
Next, activate the Services checkbox. Type in Interface fw and Interface tap in the search fields. Since Checkmk commits the rule to the nodes only, it will now assign these interfaces seen on the nodes to the cluster.
The assignments of these interfaces to the cluster support the movement of services from one node to another. Checkmk will not tag them as Vanished Services on the preceding node or consider them as new services on the current node.
They continue to be part of the cluster, so you don't need to remove the interface services on one node and add them on another. Save the rule and activate the changes to enable Service Discovery to recognize these interfaces on the cluster host.
Key Points to Assigning Services to a Cluster
However, you must remember that interface assignment at the cluster level only pays off if you follow the three rules in the blog mentioned above. Following those rules will enable you to effectively refine the interfaces in Checkmk because that would mean the interfaces have undergone the required naming.
Given this config, Checkmk provides the benefit of allowing you to monitor your Proxmox environment meticulously.
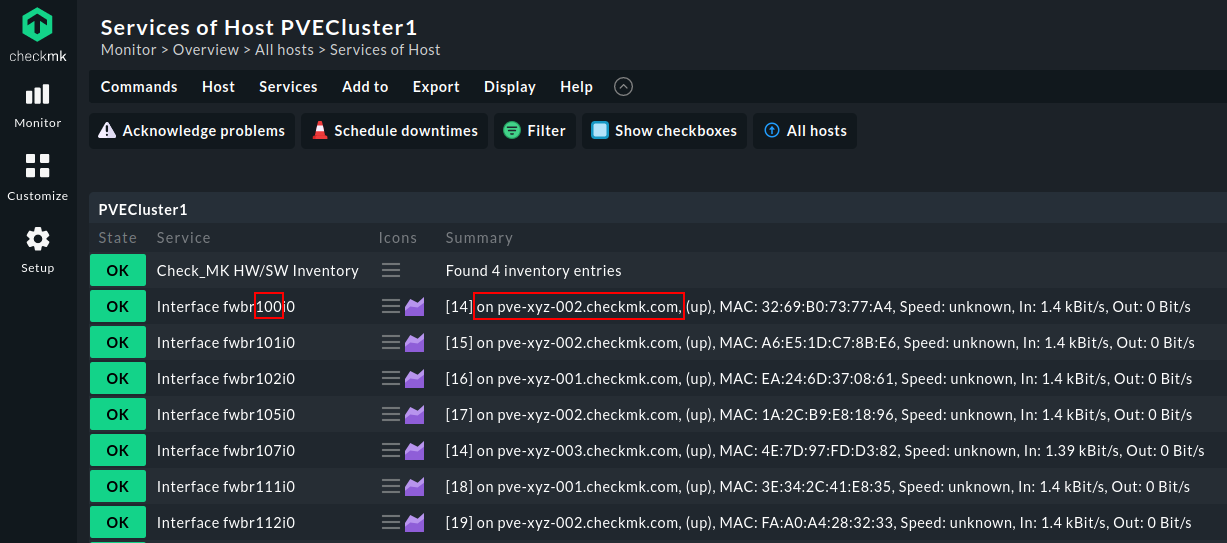
When you go to Service in the cluster's host view, you will see, let's say, the interface 'fwbr' with a numeric suffix representing the VM ID.
You will also view which node the interface is located in when you check the Summary. In our example, VM ID 100 is found on node 'pve-xyz-002.checkmk.com'.
Dealing with Volatile Virtual Machines
Suppose your Proxmox environment contains unstable VMs, e.g., test VMs you don't intend to monitor. In that case, you may create a container or virtual machine in Proxmox using a customized VM ID outside your standard numeric range, e.g. 600-699.
Using that ID as an example, Checkmk will show these VMs as 'Interface tap666io.' In the Setup menu, activate the Disabled services rule. The rule will allow you to use the regex 'Interface fw6\d\d' and 'Interface tap6\d\d' that correspond to these interfaces, canceling them from services you need to monitor.
Other Benefits of Monitoring Proxmox with Checkmk
Checkmk can retrieve data from the VM. The data source can be virtual machines' memory or storage space. It can do this through API integration's piggyback mechanism. You will get insights into the container's backup status and the size of the allocated memory that has been used.
Even if you cannot install an agent in a virtual machine, you are assured that Checkmk will provide you with the most important and relevant data about the VM and a rundown of the current backup status.
Should you decide to use Ceph storage for your Proxmox server, complement it with the Ceph statistics plug-in from the Chechmk Exchange. The plug-in will give you access to Ceph data, pools, on-screen displays, and overall status.
Additionally, Checkmk has several official plug-ins for Proxmox monitoring. In the action menu for the corresponding service, click on Parameters for this service. The action should allow you to tailor your Proxmox services' default threshold.
The Bottomline
Proxmox is a practical solution for IT professionals. Pair it off with Checkmk, and be assured of smooth operations for your VM.
FAQ
How do you install PVE?
Compared with other virtualization solutions, Proxmox VE is relatively easy to install so that even a new user can do it within a few minutes. Since it runs on Debian, the experience is what you would have with Linux.
Its source code is free to download, share, and use under the free software license GNU Affero General Public License (AGPL), v3.
Download the Proxmox VE ISO Installer. Alternatively, you can check the code in the public code repository (git).
Enable booting from USB or CD/DVD (or another installation medium) in your servers' firmware settings. Plug in the installation tool, and copy the ISO image using the specified command line.
Follow the installation process instructions before you proceed to configuration through a graphical user interface (GUI).
Are there PVE subscriptions?
Choose from among four plans to suit your business needs. These plans are based on the number of CPU sockets and physical servers.
