Building custom dashboards for vSphere monitoring
 on Apr 12, 2019
Checkmk comes with a powerful dashboard builder. Ok, getting started could be easier, but once you have build your first dashboard, you will have gotten the feel for it and will be able to build the next one super fast.
In this post, I will show you how to build a dashboard to monitor your vSphere environment. VMware vSphere is a cloud computing virtualization platform and consists of VMware vSphere ESXi, a type 1 hypervisor, and VMware vCenter, a configuration tool.
Note: This article bases on Checkmk versions older then 2.0. A tutorial for newer versions can be found here.
Checkmk can both monitor the ESXi hosts and also its VMs. Thus, for example, on the host it is possible to query Disk-IO, datastore performance, the status of physical network interfaces, diverse hardware sensors, and much more. Checkmk likewise offers a series of check plug-ins for the VMs. A comprehensive list of these can be found in catalog of check plug-ins in the VMware ESX section. Checkmk gets the data via the vSphere-API, so there is no need to install any software on your ESXi hosts. For more information on how to monitor VMware ESXi, read this article.

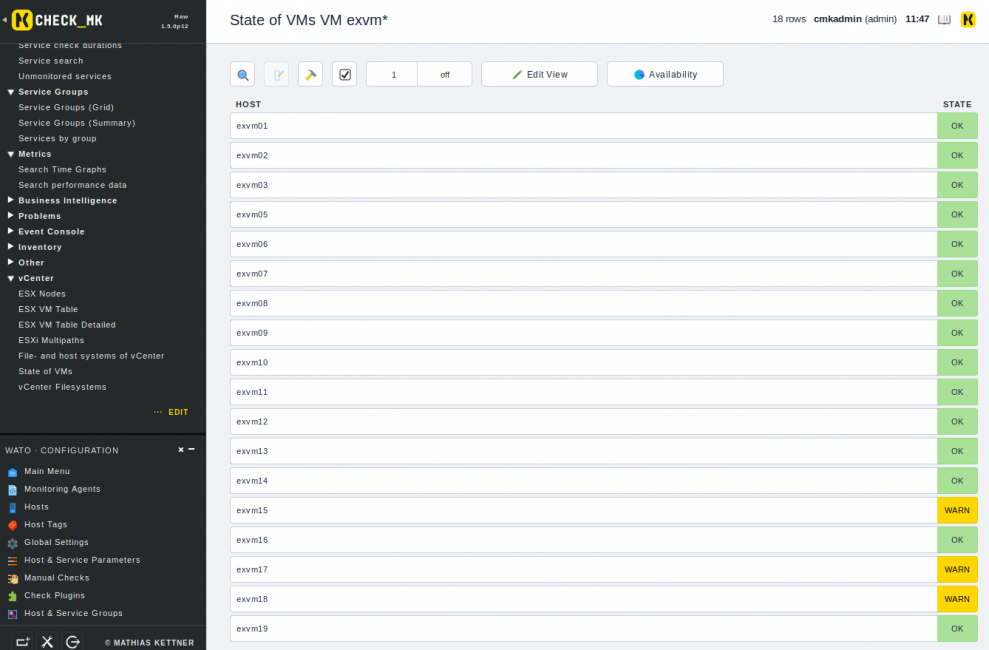
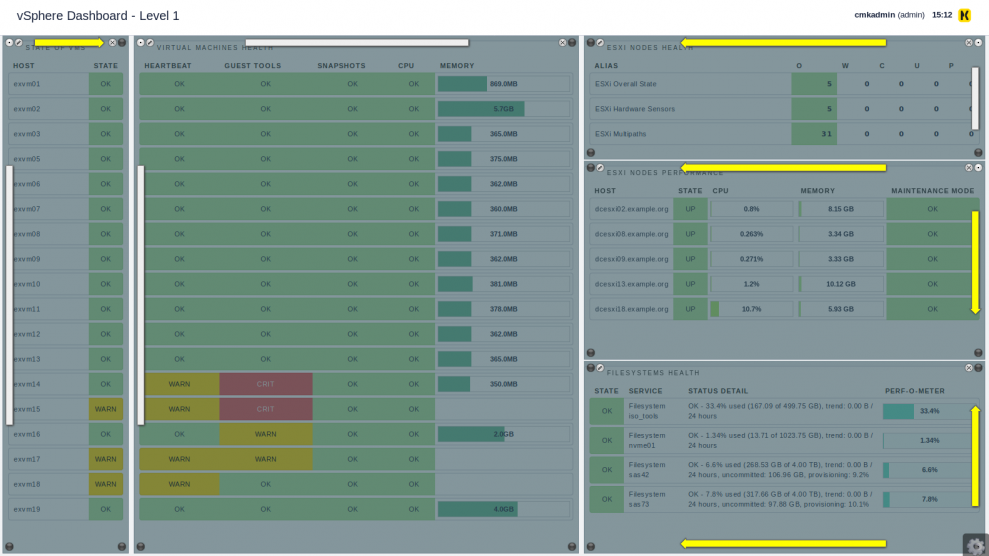
The vSphere dashboard I build shows you in the very left column the power state of the VM (exvm15, 17 and 18 are powered-off as indicated by the WARN state). Next to it, you can see the health of the virtual machines. Right away you can see, that most VMs are fine, but some have an issue with the heartbeat and the guest tools (e.g. no VMware Tools installed or the an outdated version of the VMware Tools is installed).
On the right hand side of the dashboard, you can see information on the ESXi nodes. On the top right, I aggregated the states, as I am not interested in the health of a single machine, but rather if all hardware sensors and multipaths are fine. However, when I look at performance, I am actually interested in the performance of each single node. In the bottom right I can then also see the different filesystems used by all my VMs to see, if I might be running into capacity issues soon.
Building the dashboard
To create the dashboard, you need to first create the views, which I explained above. These views can then be added very easily to the dashboard. I will first explain each view individually. This way you can see the many possibilities to create views in Checkmk. Feel free to skip after the first view to the section: Adding views to the dashboard.
Creating views
State of VMs - showing individual services in a view
First let's create the view for State of VMs, which shows the state of each VM we have.
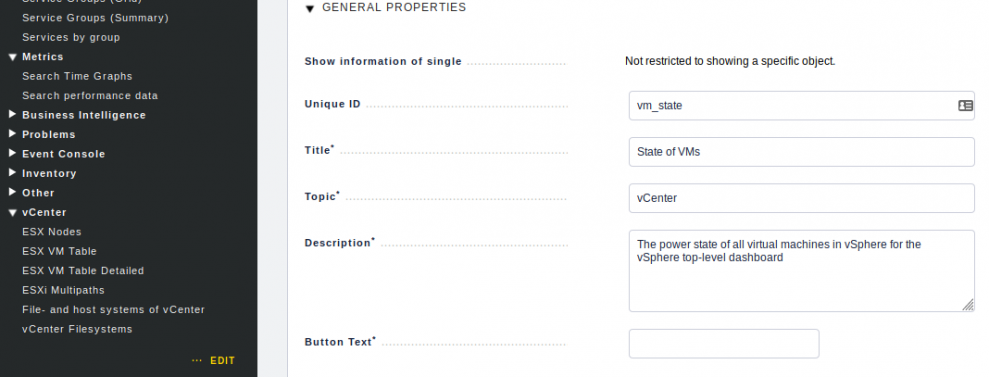
Go to the sidebar and find the Views section. In the bottom of this section, click Edit. Click in the new screen on the button New in the top to create a new view. Select All services under Datasource and continue. Do not select any specific objects in the next screen, just click continue. Now enter info for the general properties of the view. The topic is helpful as it defines in which section of the views you will find your newly created view. You can see on the left my section vCenter, which is home to all the views regarding the vSphere monitoring.
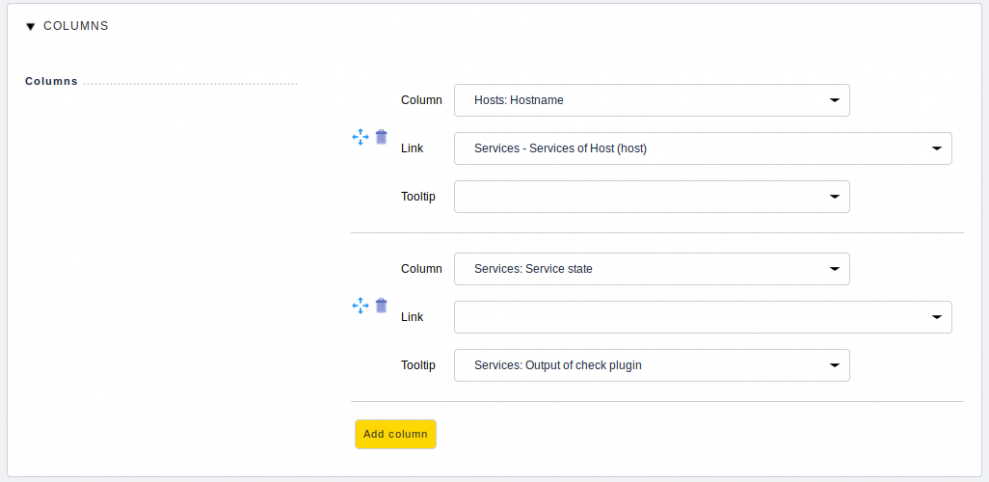
Now you need to select the columns, which you want to see in this view. I just want the hostname and the service state as can be seen below. Click Add column, select Hosts: Hostname in Column, then add another column and select Services: Service state. This is all you need. The Link and Tooltip is just a nice to have. In this case, clicking on the host in the view will lead me to all services of the host. Hovering over the service state will show me the output of the check plugin, so that I understand, why the state is actually WARN or CRIT for example.
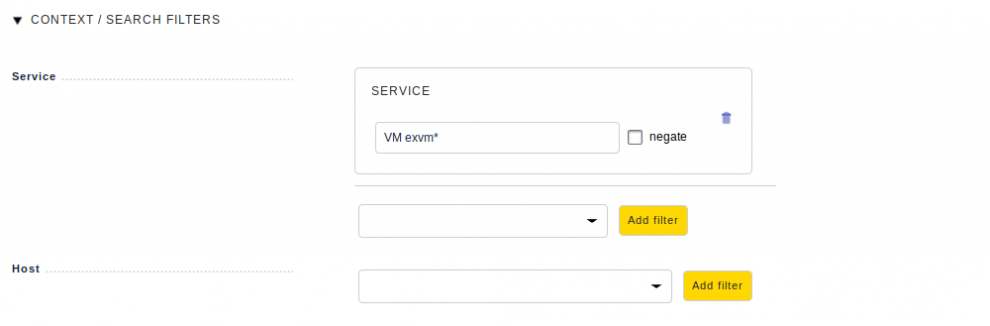
Now we need to make sure, that we only see the services, which are of actual interest for us. Go down to Context/Search filters, in the Service row select Service and click Add filter. In my case, I can enter VM exvm* here as this will now filter all services which start with VM exvm across all hosts.
Note: A good naming convention helps here to automatically identify the relevant VMs. All my virtual machines start with the name exvm.
Just click Save now and in the respective view section, you should be able to find the newly created view. Mine looks like this now:
You can skip now to adding views to the dashboard or continue with creating views.
Comment: This view is not essential for the dashboard. The following "ESX VM Table" view shows the key information around the VMs - however it is not possible to show the state of the VM in that view as every service describing the state of the VM has a different name and a "Joined column" does not work with wildcard.
For both views to integrate to each other, there are some requirements which have to be met, which you can see at the end of the section describing the "ESX VM Table"
ESX VM Table - showing the same services of multiple host in a table view
Now we can create a very powerful view, which can be used, if you have a lot of hosts with similar services and you e.g. want to compare them to each other
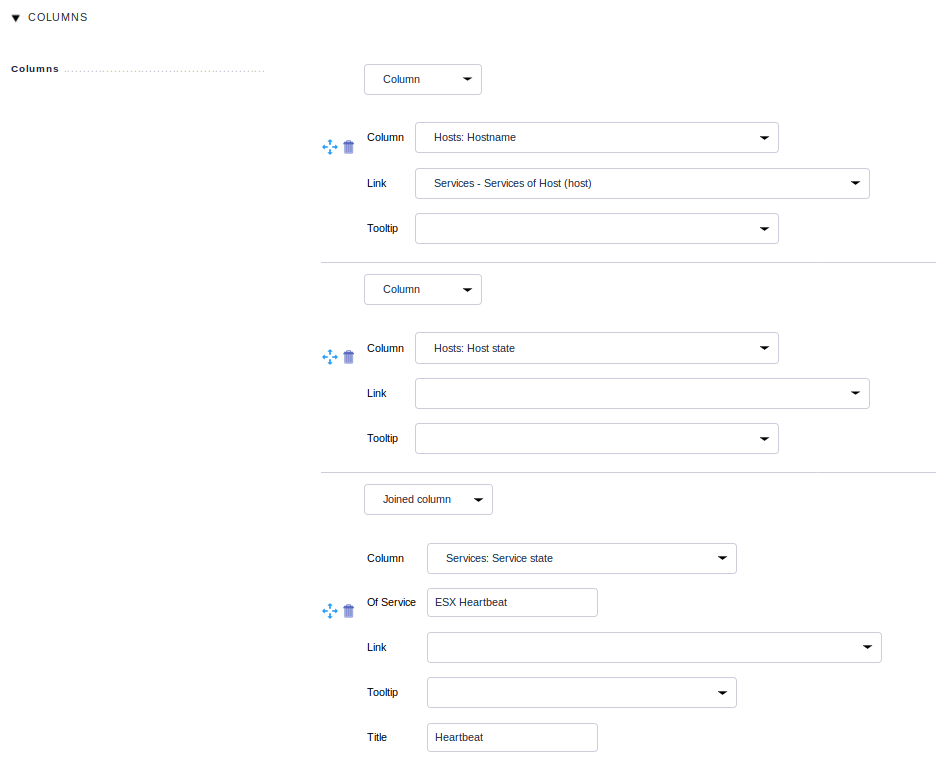
As before, create a new view. Select All hosts as Datasource, do not select specific objects, just continue. Enter the info for the general properties again. When you add a new column, you need to select Joined column now. Select Services: Service state for the Column. Enter name exact name of the service you want to monitor in Of Service, for example ESX Heartbeat and optionally enter a Title for that column.
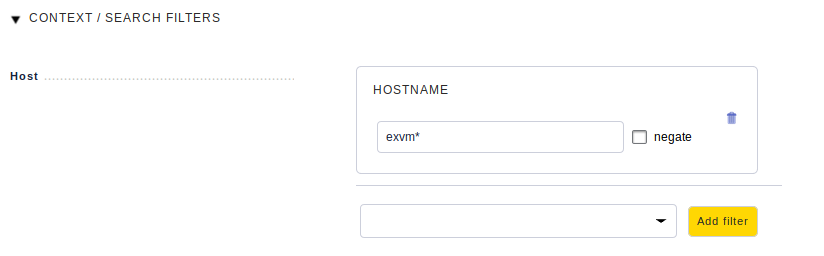
Now you just need to filter the hosts, which should be monitored. In Context / search filters, select Hostname, click Add filter and enter a regular expression, which matches the name of all your virtual machines.
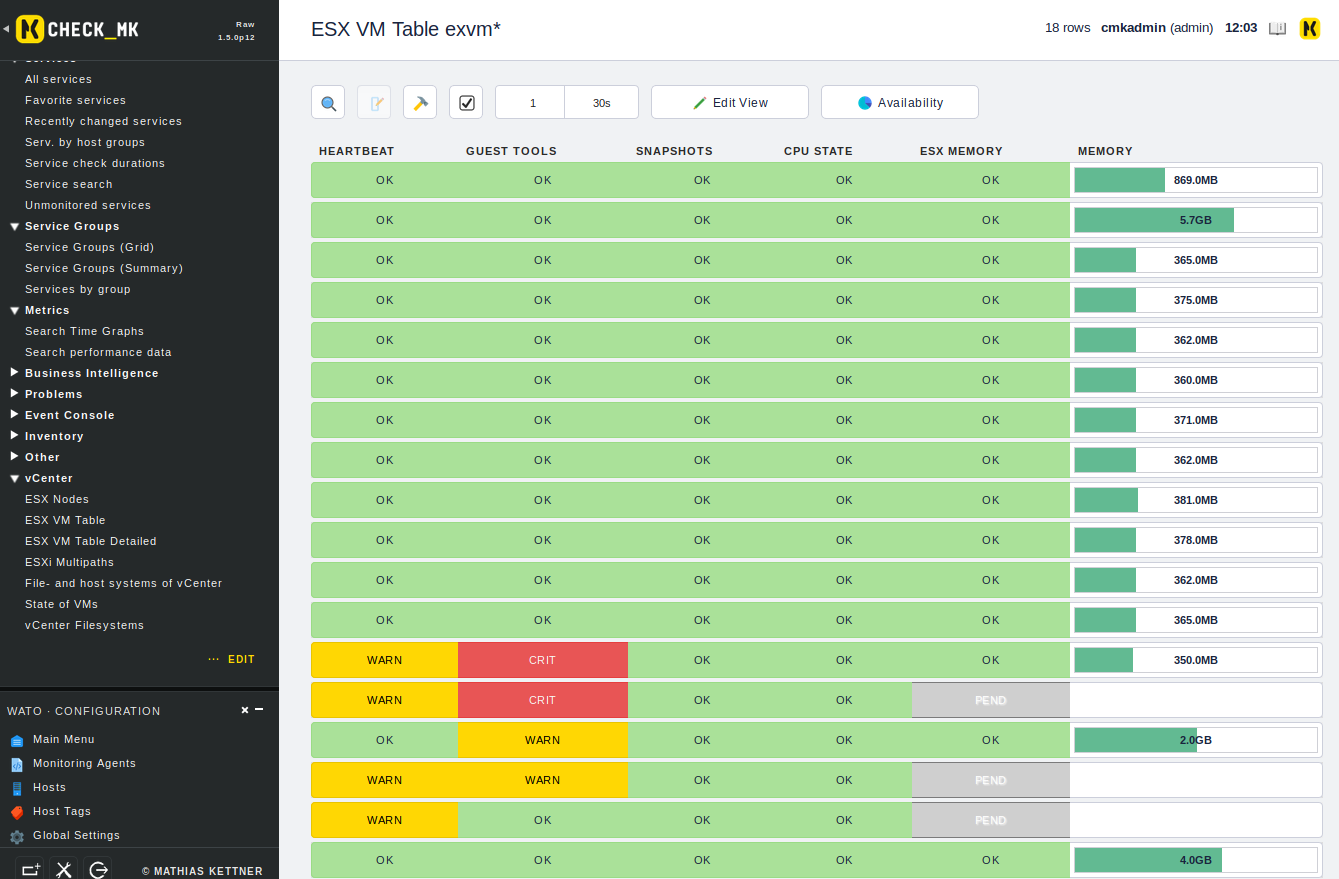
Now I can see a nice table for all of the services of the host. In this case, I did not enter any hostname, so actually you don't know for which host you can see the service. This info however can be seen by the view, we just created before and which will be located next to this new view.
Note: We will position the "ESX VM table" view next to the "State of VMs" view. For this to work, following requirements need to be met (thanks Marsellus)
- all VMs must also be in monitoring - so that the ESX VM table is as long as the ESX state table
- all VMs must be named exactly(!) like in ESX - so that the contents of "ESX VM table" match to those of "ESX VM state"
- both views must be configured not to be sortable by users - because if you sort one of them by hitting a column header, the table contents do not match to each other anymore
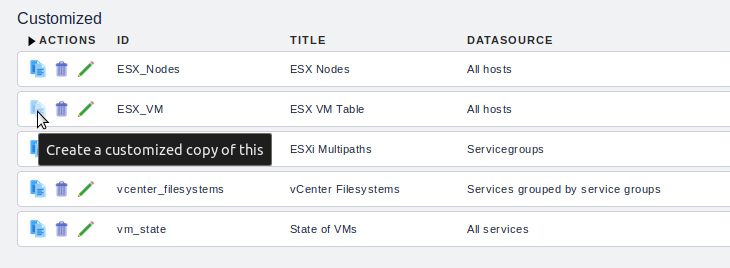
Now we have all the views required for the virtual machines. I will not go into detail how to create the view for the ESXi nodes performance as it can be created exactly in the same way as the previous view. You can for example use the clone button to copy the ESX_VM view and then you only need to adjust the columns and set the right filter for the hostname (for me: .*example.org$ as all my ESXi nodes end with the name example.org).
ESXi Nodes Health
This is a new view as we here will also use the concept of Checkmk service groups. This is also covered in documentation here. Follow the documentation and create the service groups esxi_hwsensors, esxi_multipaths, esxi_state. Create a rule Assignment of services to service group and assign the services to its service group, e.g. Hardware Sensors. Repeat for the other service groups.

If you click now on Service Groups (Summary) in the sidebar in the View section, you will be able to see a summarized view for your service groups. You can click here Edit View to create a copy(original templates of views can't be overwritten, instead a copy will be created).
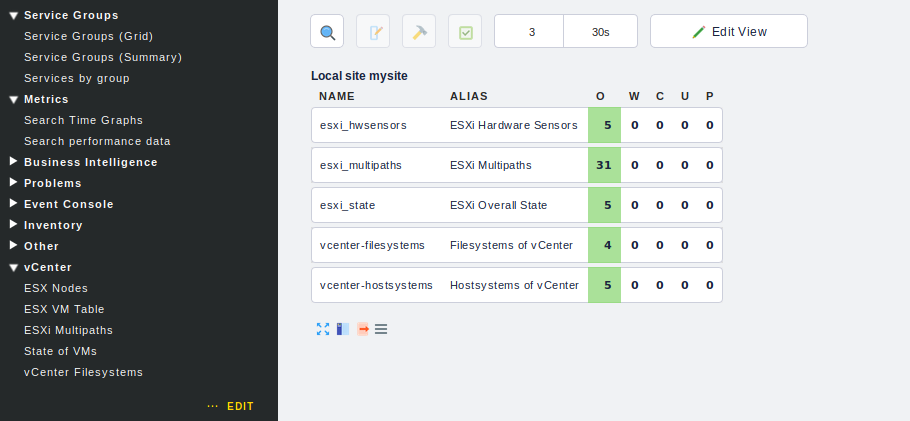
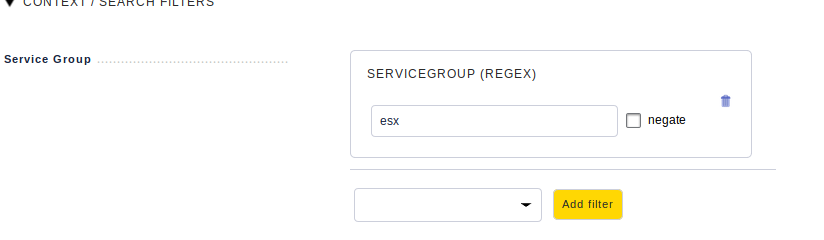
Rename the General properties and make sure to enter the right Topic, so that you can easily find the modified view again. The only thing you need to do now is to set a filter to only see the Service Groups, which you want to see. My relevant Service Groups all start with esx, so I can just enter esx in the Servicegroup (Regex) field.
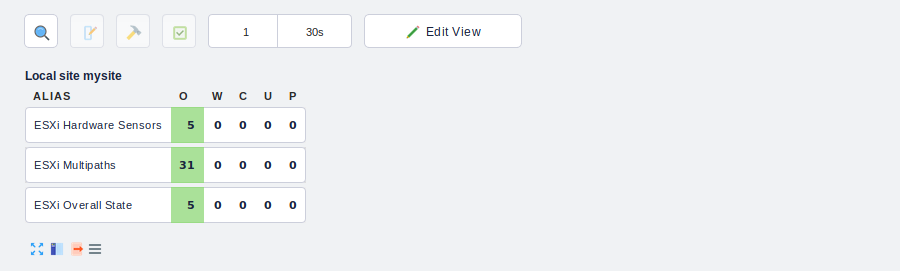
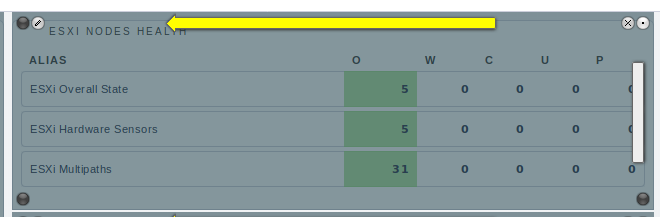
As a result, I now have the summarized view by service group. I can see all my hardware sensors independent from the hosts and can immediately see, if one of them is in WARN (W), CRIT (C) etc. and then react to fix the issue.
vCenter Filesystems - Detailed service views
For the last view, I got quite lazy. I just used copied the "allservices" view.

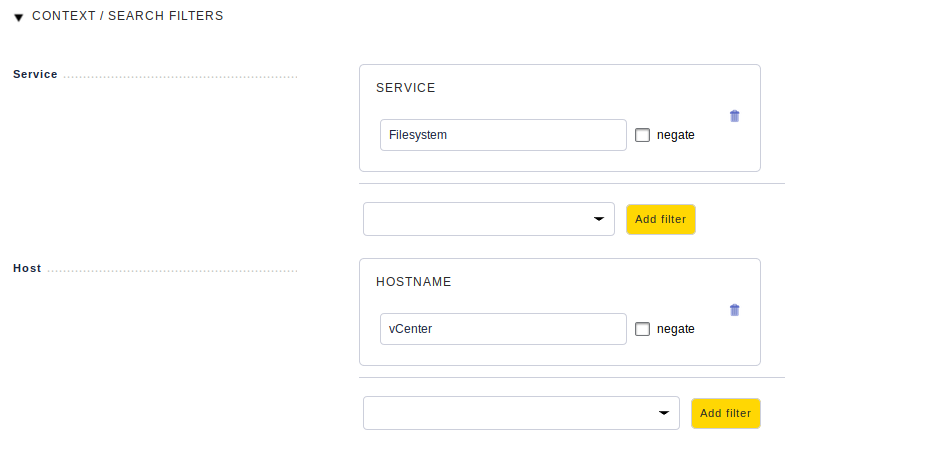
I then renamed the General properties, removed the columns I don't need anymore (Hosts/Services: Service icons, Services: The age of the current service state, Services: The time since the last check of the service). After this, you only need to set the filters for the service as can be seen below.
As you can see - creating the first view will seem like a hassle. But creating views after that is mostly just copying old views and then setting the right filter.
Adding views to the dashboard
Now let's actually build the dashboard. This article in the documentation describes the dashboards in detail.
As before, click the Edit button in the Views sidebar section. Now click on Dashboards in the menu on the top. Click New to create a new dashboard. Don't select anything, just click Continue. Set in General Properties the Topic to Overview, so that the view will appear next to your other dashboards, but don't set any Context / Search Filters and then don't forget to hit Save.
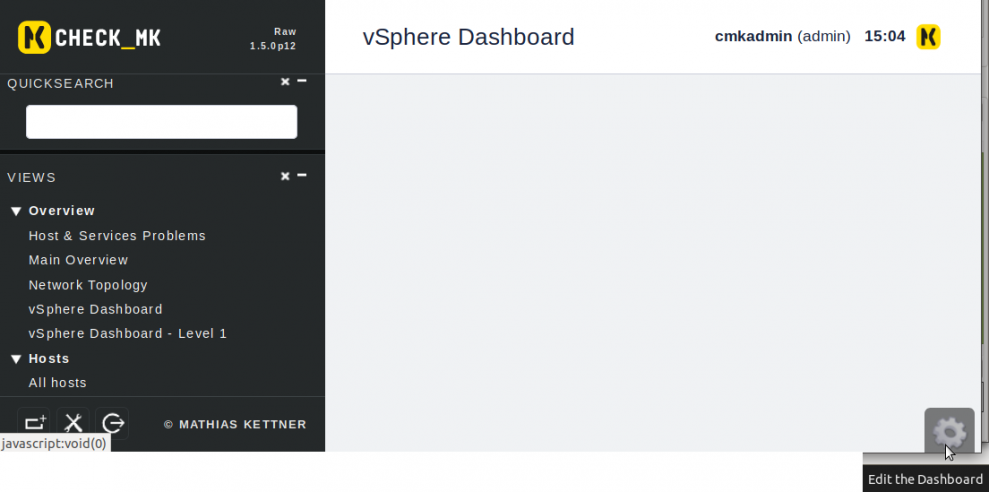
Your new empty dashboard is now available in the Overview section in the Views. The Edit the Dashboard button is not easy to find in the first place - it is hidden in the bottom right.
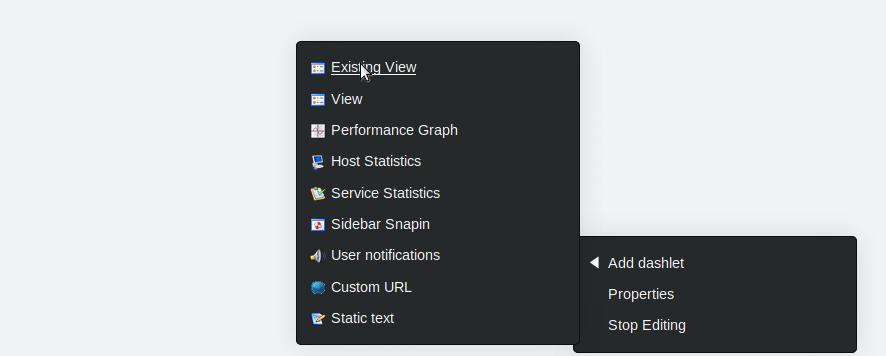
Click on the gears and then click Edit Dashboard. Click again on the gears, click Add dashlet -> Existing View. Select one of the views, we created before. On the next screen just scroll down and click Save.
Do this for all the views, which we have created. And then you can start moving them around via Drag & Drop.
This is how I arranged them:
Some little tricks:
You can resize by yourself (white bar on the side or top of the dashlet), let Checkmk figure out the best width and height by clicking on this white bar, which then turns yellow. You can also force the maximum length by clicking on the bar again, making it turn into the red bar.
The circle in the corner, which is not black, indicates the fixed origin for this dashlet. E.g. here it is top right, thus all the arrows will move from there and that is where Checkmk will start maximing the width/height from.
This was a rather lengthy how-to for creating a dashboard. But now you are equipped to put almost anything into a dashboard at your will.
Have fun designing your own dashboard and feel free to share dashboards, which you are very proud of with us!
