Building a dashboard for vSphere monitoring in Checkmk
 on Feb 27, 2023
Note: The content on this page uses the former names of Checkmk editions. Checkmk Enterprise is now Checkmk Pro, Checkmk Raw is now Checkmk Community.
Checkmk comes with a wide range of predefined dashboards that instantly provide you a good overview of your monitoring and monitored systems. At the same time, you can also build custom dashboards yourself. In this blog, I will show you how to build a dashboard for VMware vSphere.
VMware vSphere is a popular virtualization platform and just one example of the use of custom dashboards. It is also worth reading this tutorial to create custom dashboards for other areas or specific groups of systems.
TL;DR:
The article shows step by step how to create your own dashboard for VMware vSphere in Checkmk – based on the existing vSphere dashboards.
- First, the existing views (vSphere Servers and vSphere VMs) are extended by adding additional information such as CPU and memory usage as well as overall status.
- Then both views are combined into a custom dashboard – giving you a central overview of all important information about your vSphere environment.
- You can use the same steps to create your own dashboards for other systems or application areas.
Requirements
You need a running Checkmk instance with a current Checkmk version. This tutorial is based on the Checkmk Enterprise version 2.1.0p19. Basically, dashboarding is also part of Checkmk Raw (CRE), but some features like certain dashboard elements are only included in Checkmk Enterprise. With the Checkmk Trial, you can test all the features of the commercial editions for 30 days. Follow this video tutorial and your Checkmk instance will be up and running in only a few minutes.
Additionally, you need to have your vSphere environment included in the monitoring. To do that, you can follow this tutorial on VMware monitoring with Checkmk if you haven't already. You should also be familiar with the basics of layout and configuration, as well as the different dashlets and dashboard features. For details, you can check the docs on dashboards.
Starting point: The pre-built vSphere dashboards
Checkmk comes with two vSphere dashboards off-the-shelf since Checkmk 2.0.
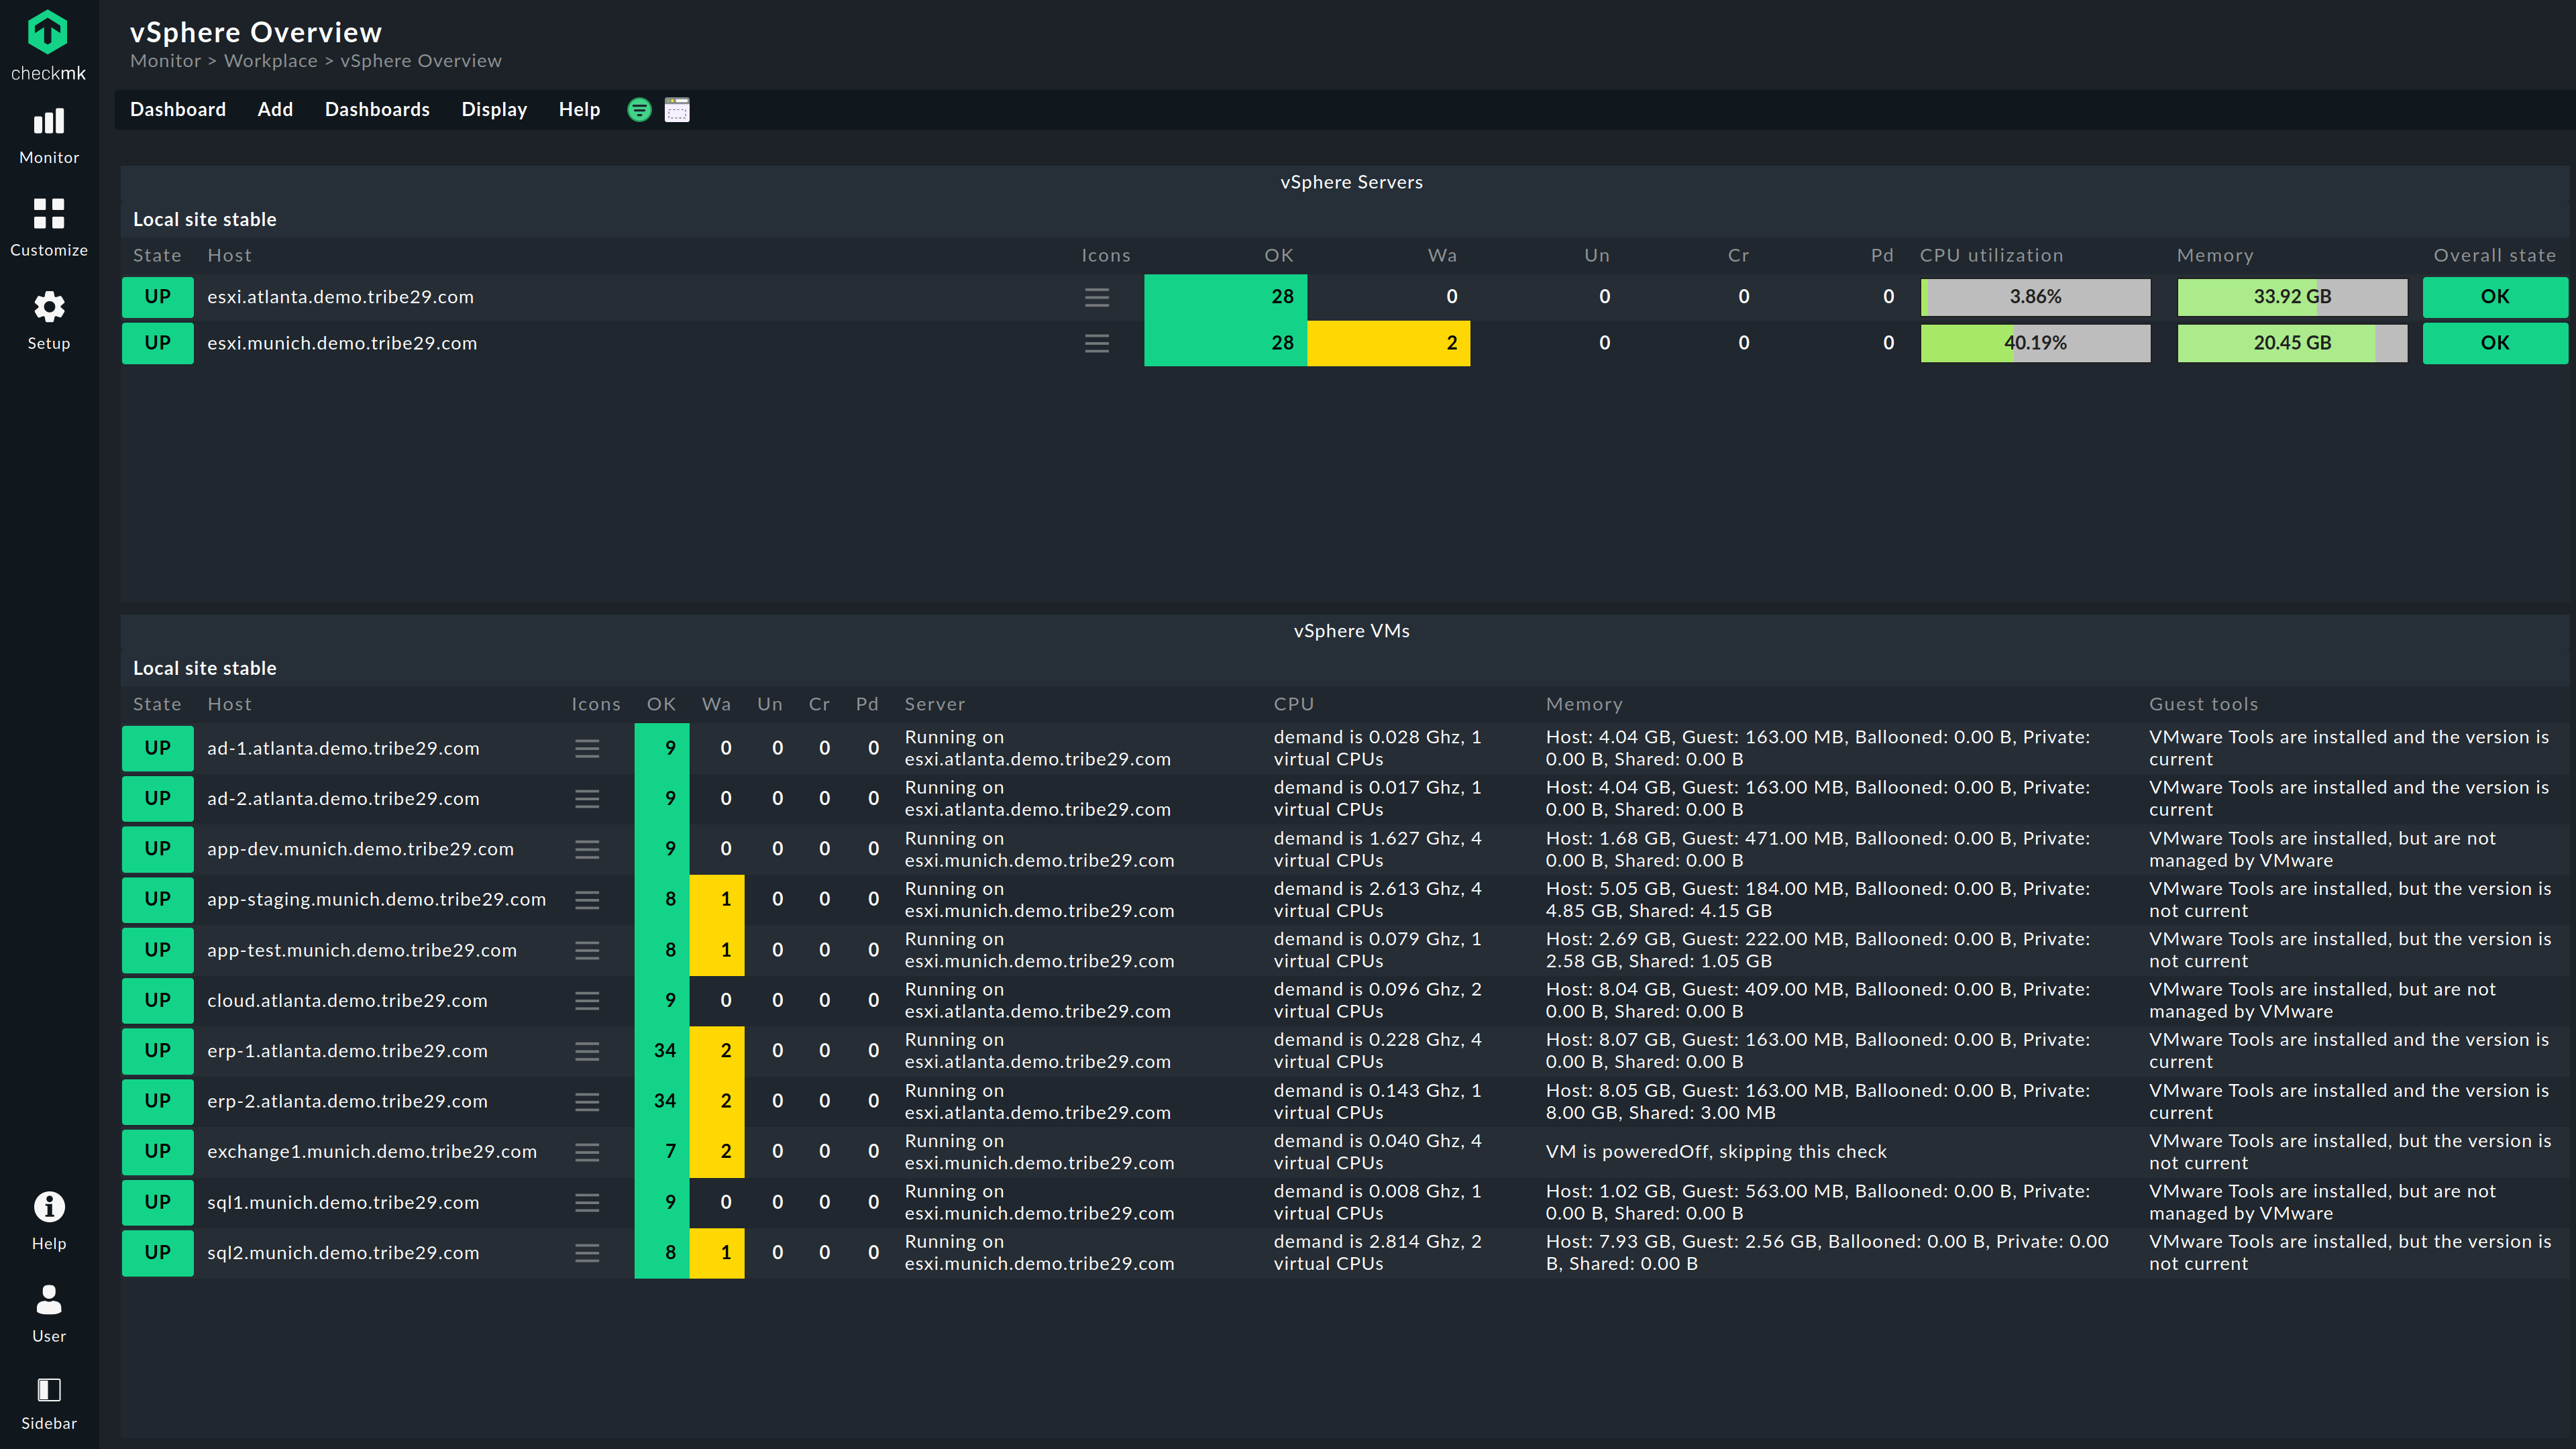
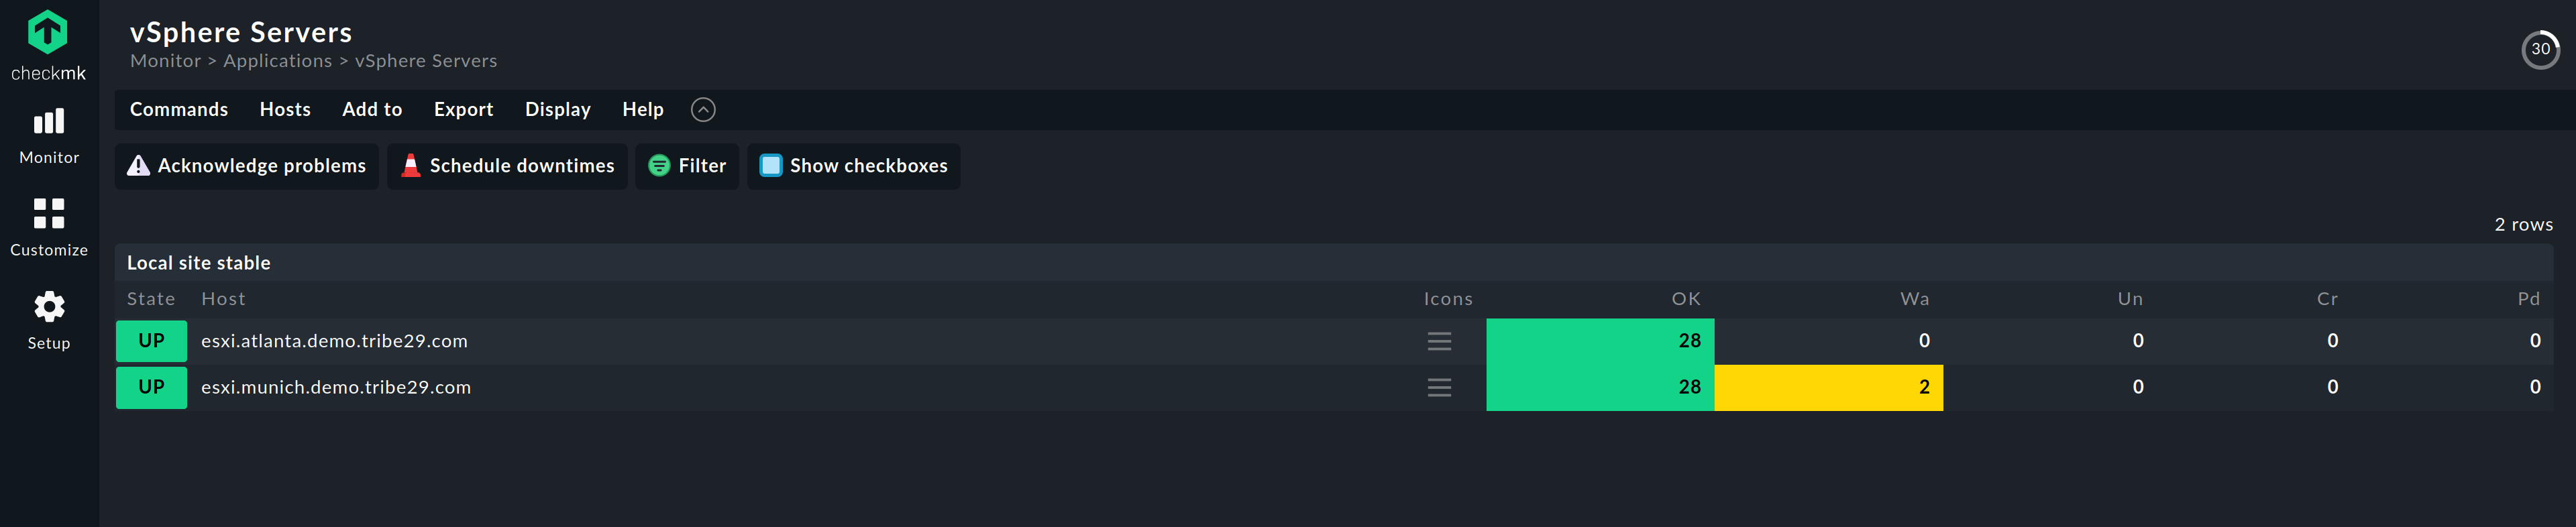
The vSphere Servers lists all hostsystems automatically and gives an overview on the state of each system. While it doesn't provide any details into the systems, it's purpose is to immediately catch services in a WARN or CRIT state.
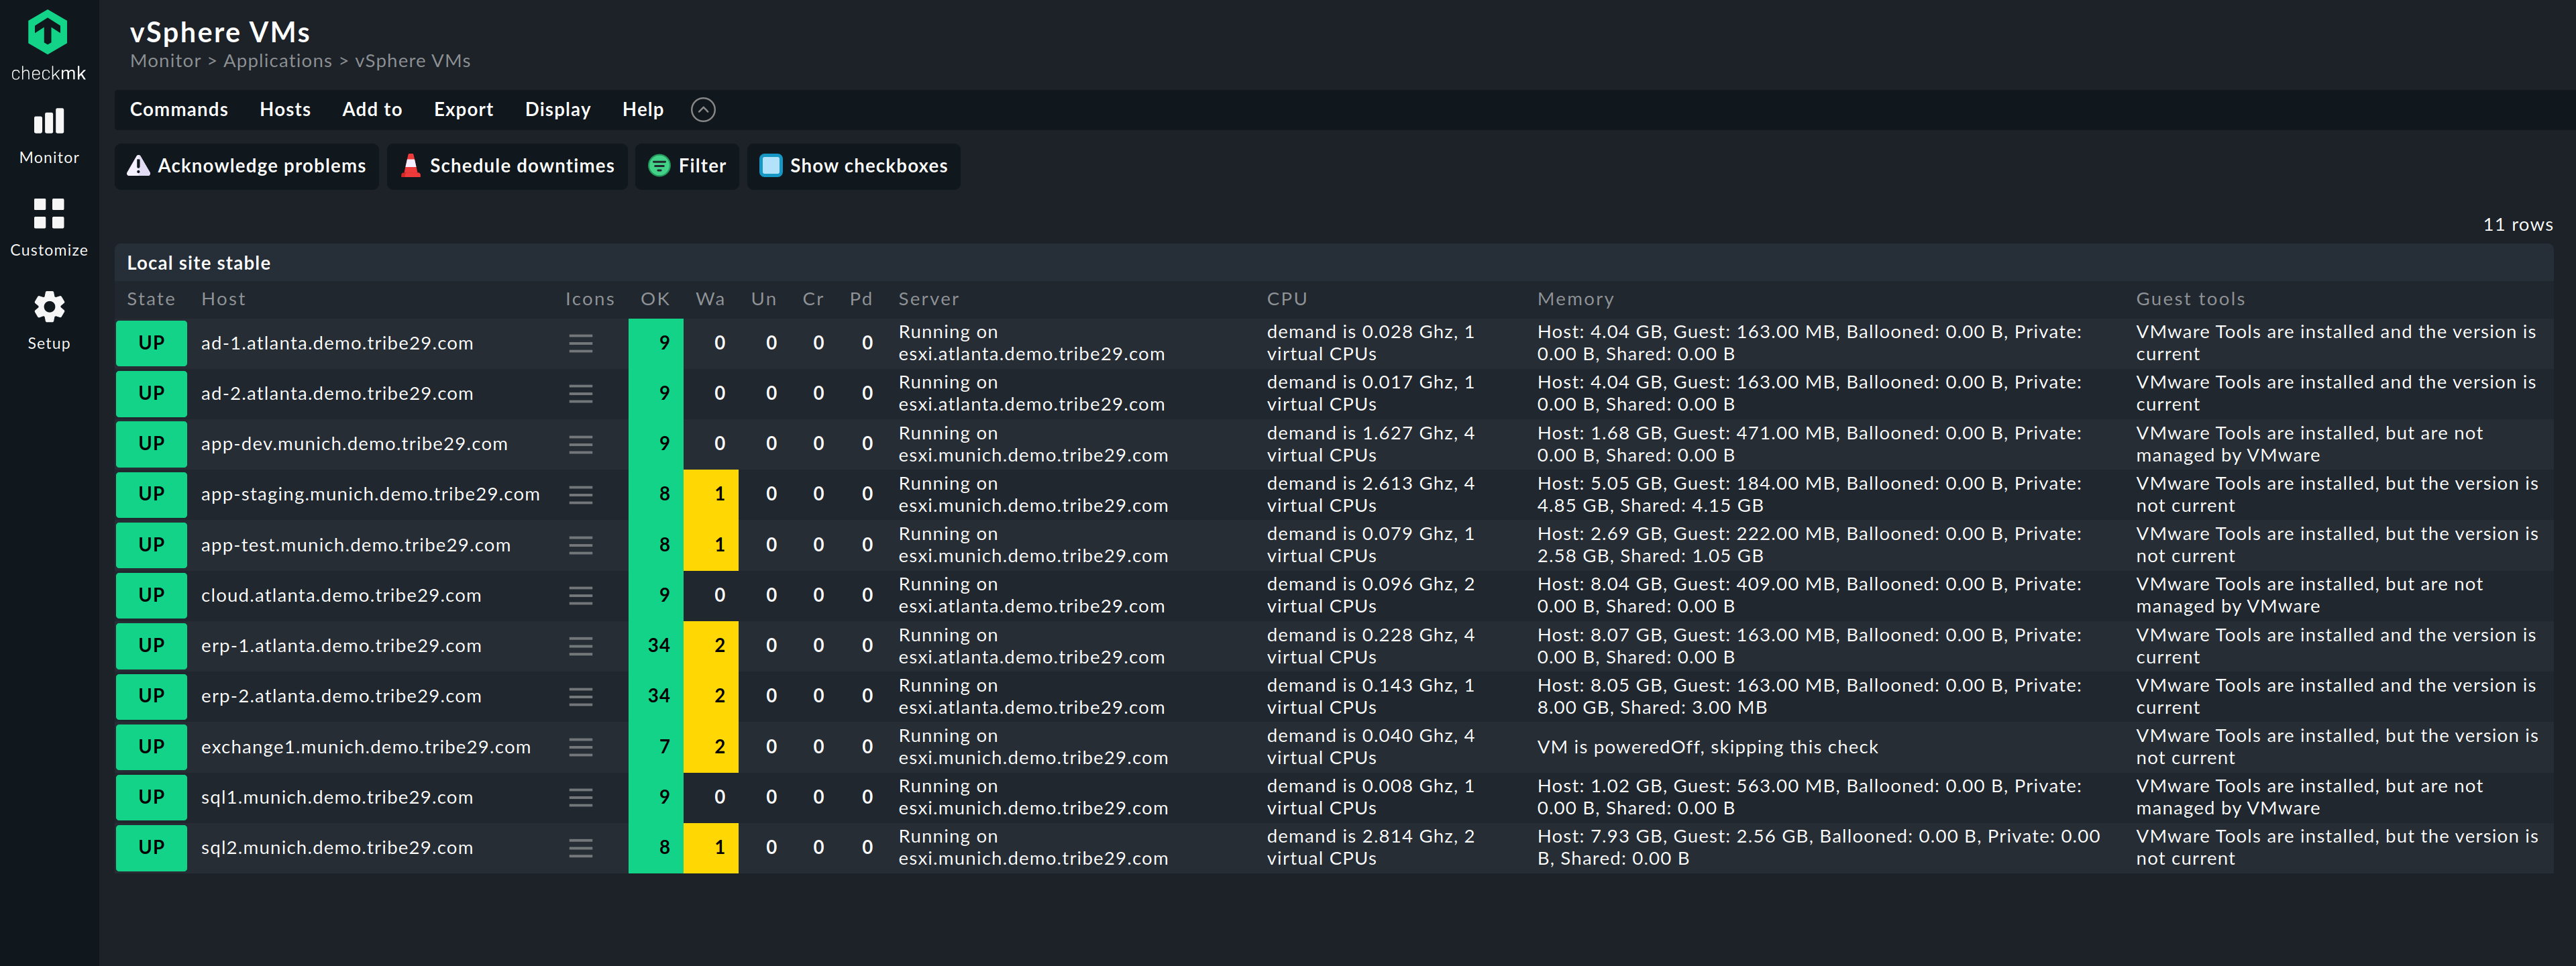
The vSphere VMs lists all virtual machines running on your hostsystems automatically. It contains also some more context and performance insights. Besides a high level overview on the state of the services of each VM, you can also see on which server the VM is running. Also the status of guest tools, e.g. if they are installed in a current version is immediately visible.

The CPU utilization and memory is also shown as performance indicators. However, in our exemplary case, only two of the VMs contain CPU utilization info. The CPU information is supplied by the Checkmk agent, which I installed on the VMs to gather additional information on-top of what is provided by vSphere. For demonstration purposes, I only installed the agent on both the ERP servers.
We will now assume that users don't have the Checkmk agent installed, but just want to work with what comes directly via the vSphere integration. Therefore let's showcase how you can adapt dashboards easily to your needs.
Step 1: Enrich the vSphere server view
So, how can we enrich the existing view? Let's first figure out what is available on our vSphere servers.
- In Checkmk, click Monitor -> vSphere Servers. Use the search to find this entry faster.
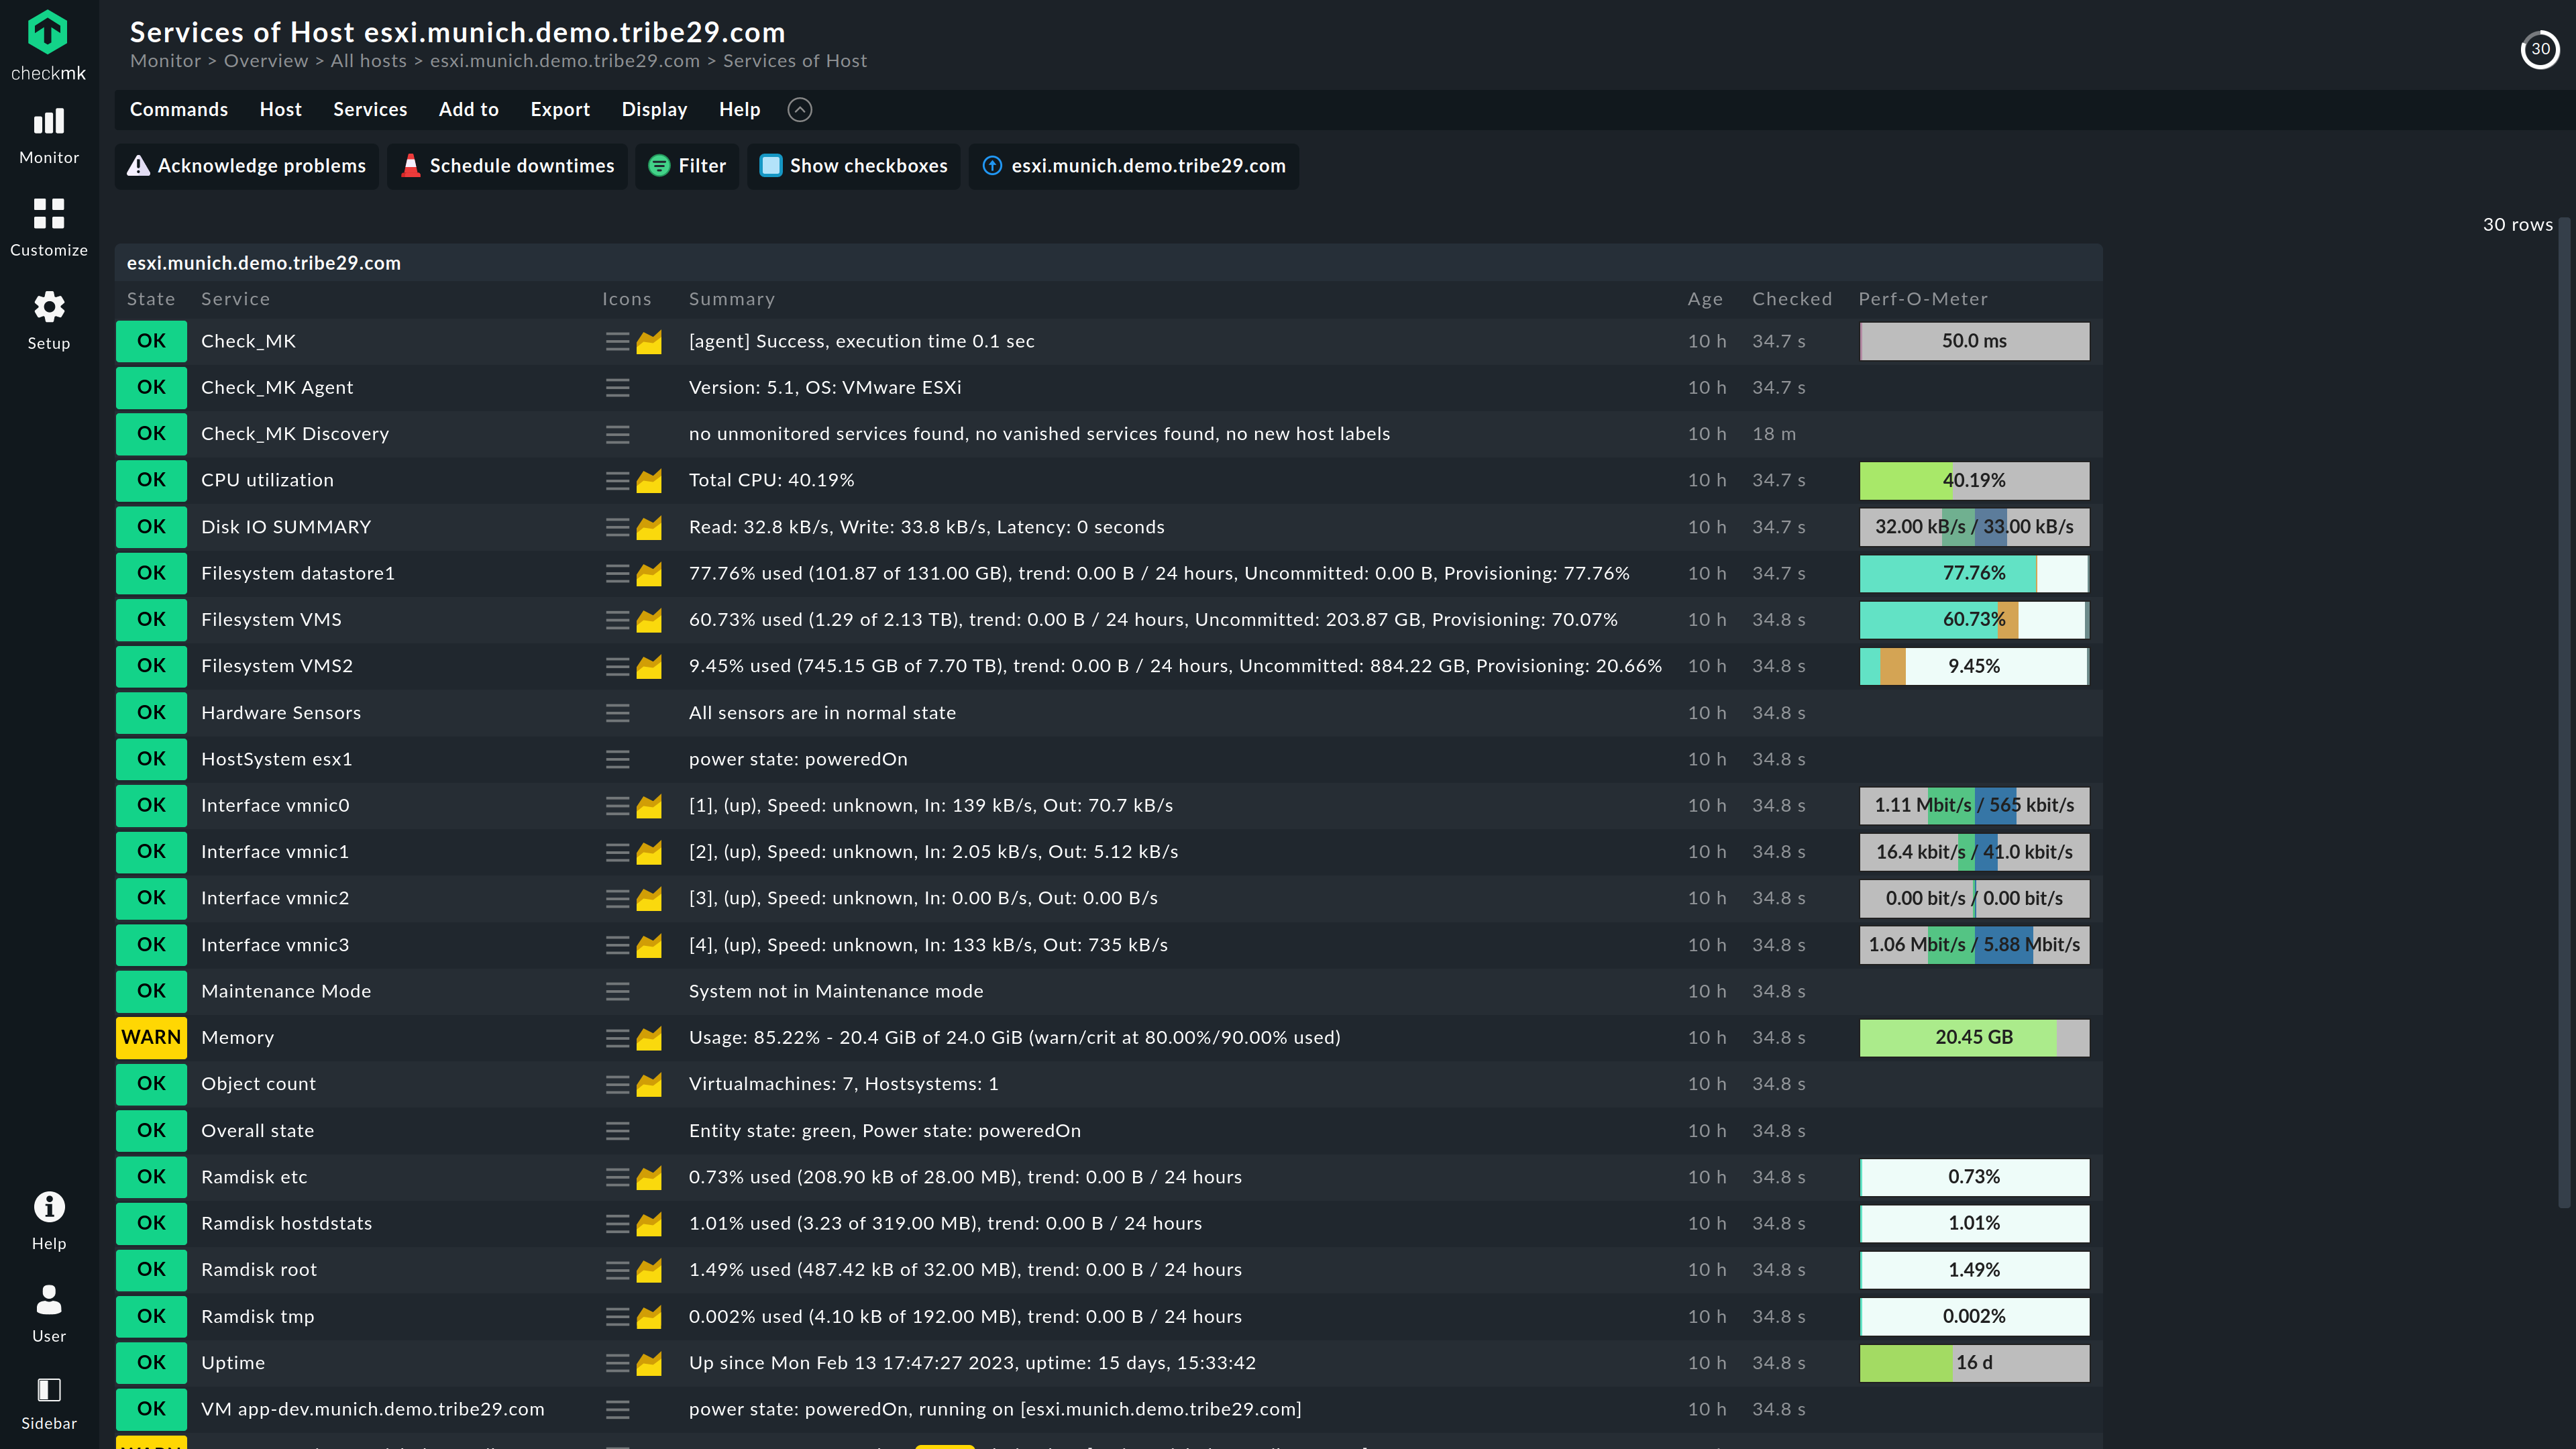
- Click one of the hosts to get to the services view for that host.
We will see plenty of services. I deem CPU utilization, Memory and Overall state as interesting and want them in my final dashboard!
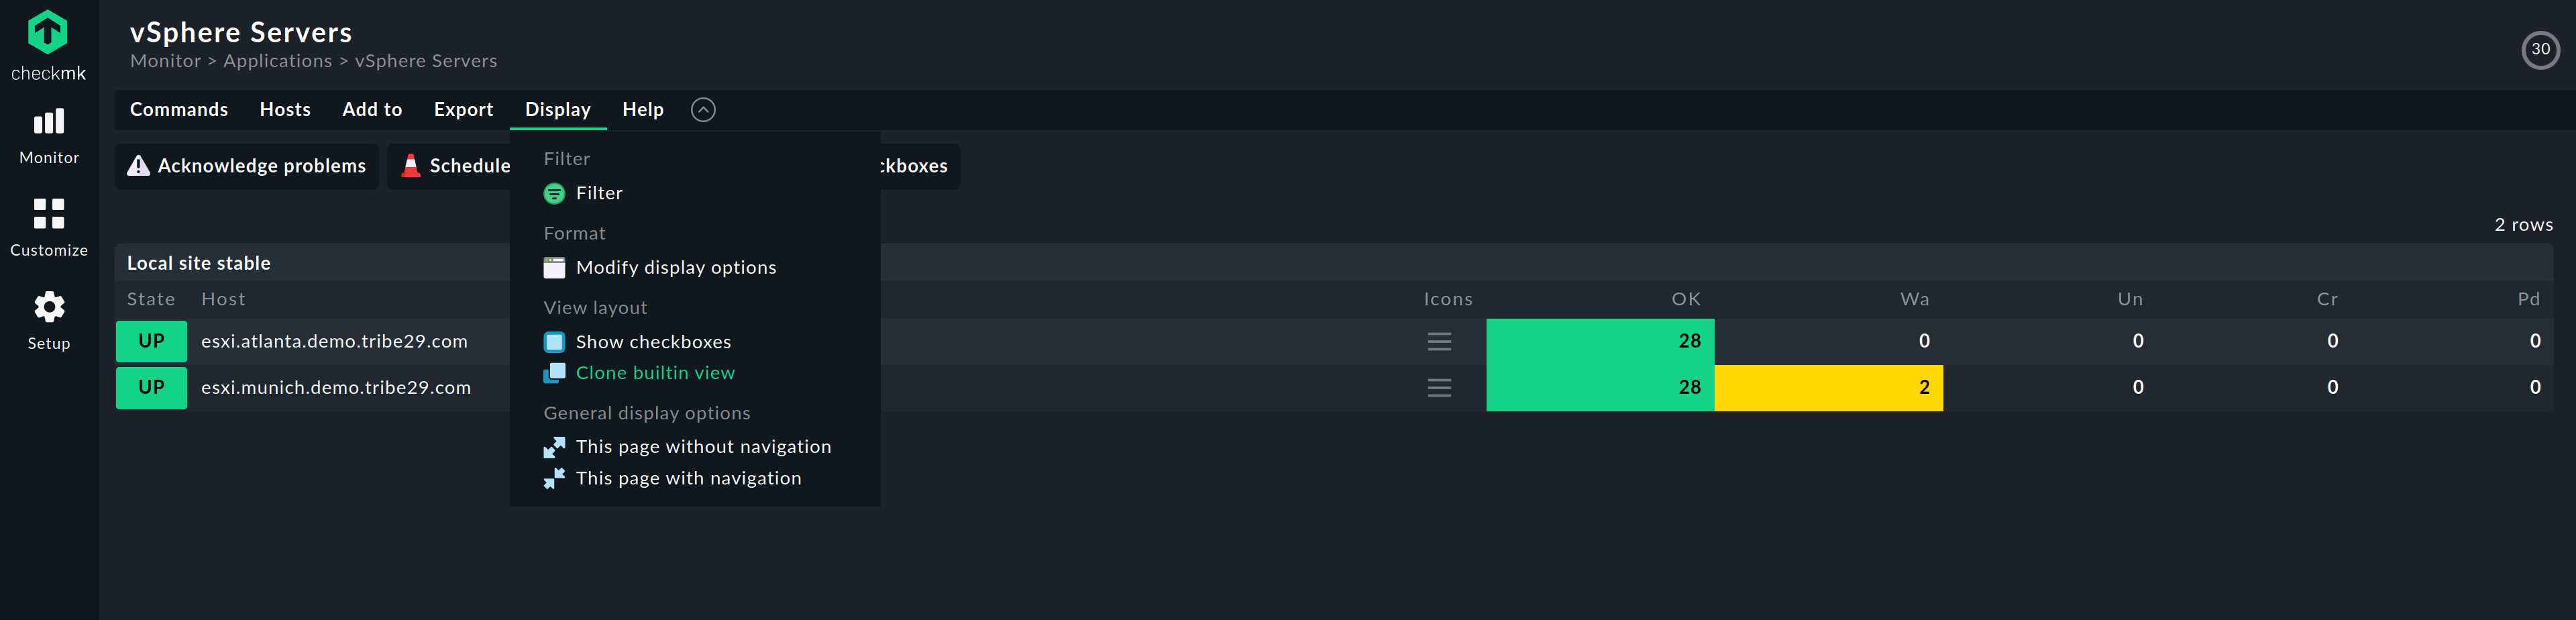
Let's add them! We start by cloning the built-in view for vSphere Servers.
- In Checkmk, click Monitor -> vSphere Servers. Use the search to find this entry faster.
- Select from the top menu Display -> Clone builtin view
We end up in the Edit view screen and can now modify the columns being shown. up at the bottom of the section Columns.
- Click Add column
- Select in the dropdown Joined column. This way we can join information of services with hosts.
- Select Services: Service Perf-O-Meter to get the neat visualization which we just in the services view of the server
- In the field Of Service enter CPU utilization
Rinse and repeat this for Memory by doing the same steps, except entering Memory instead of CPU utilization in step 4.
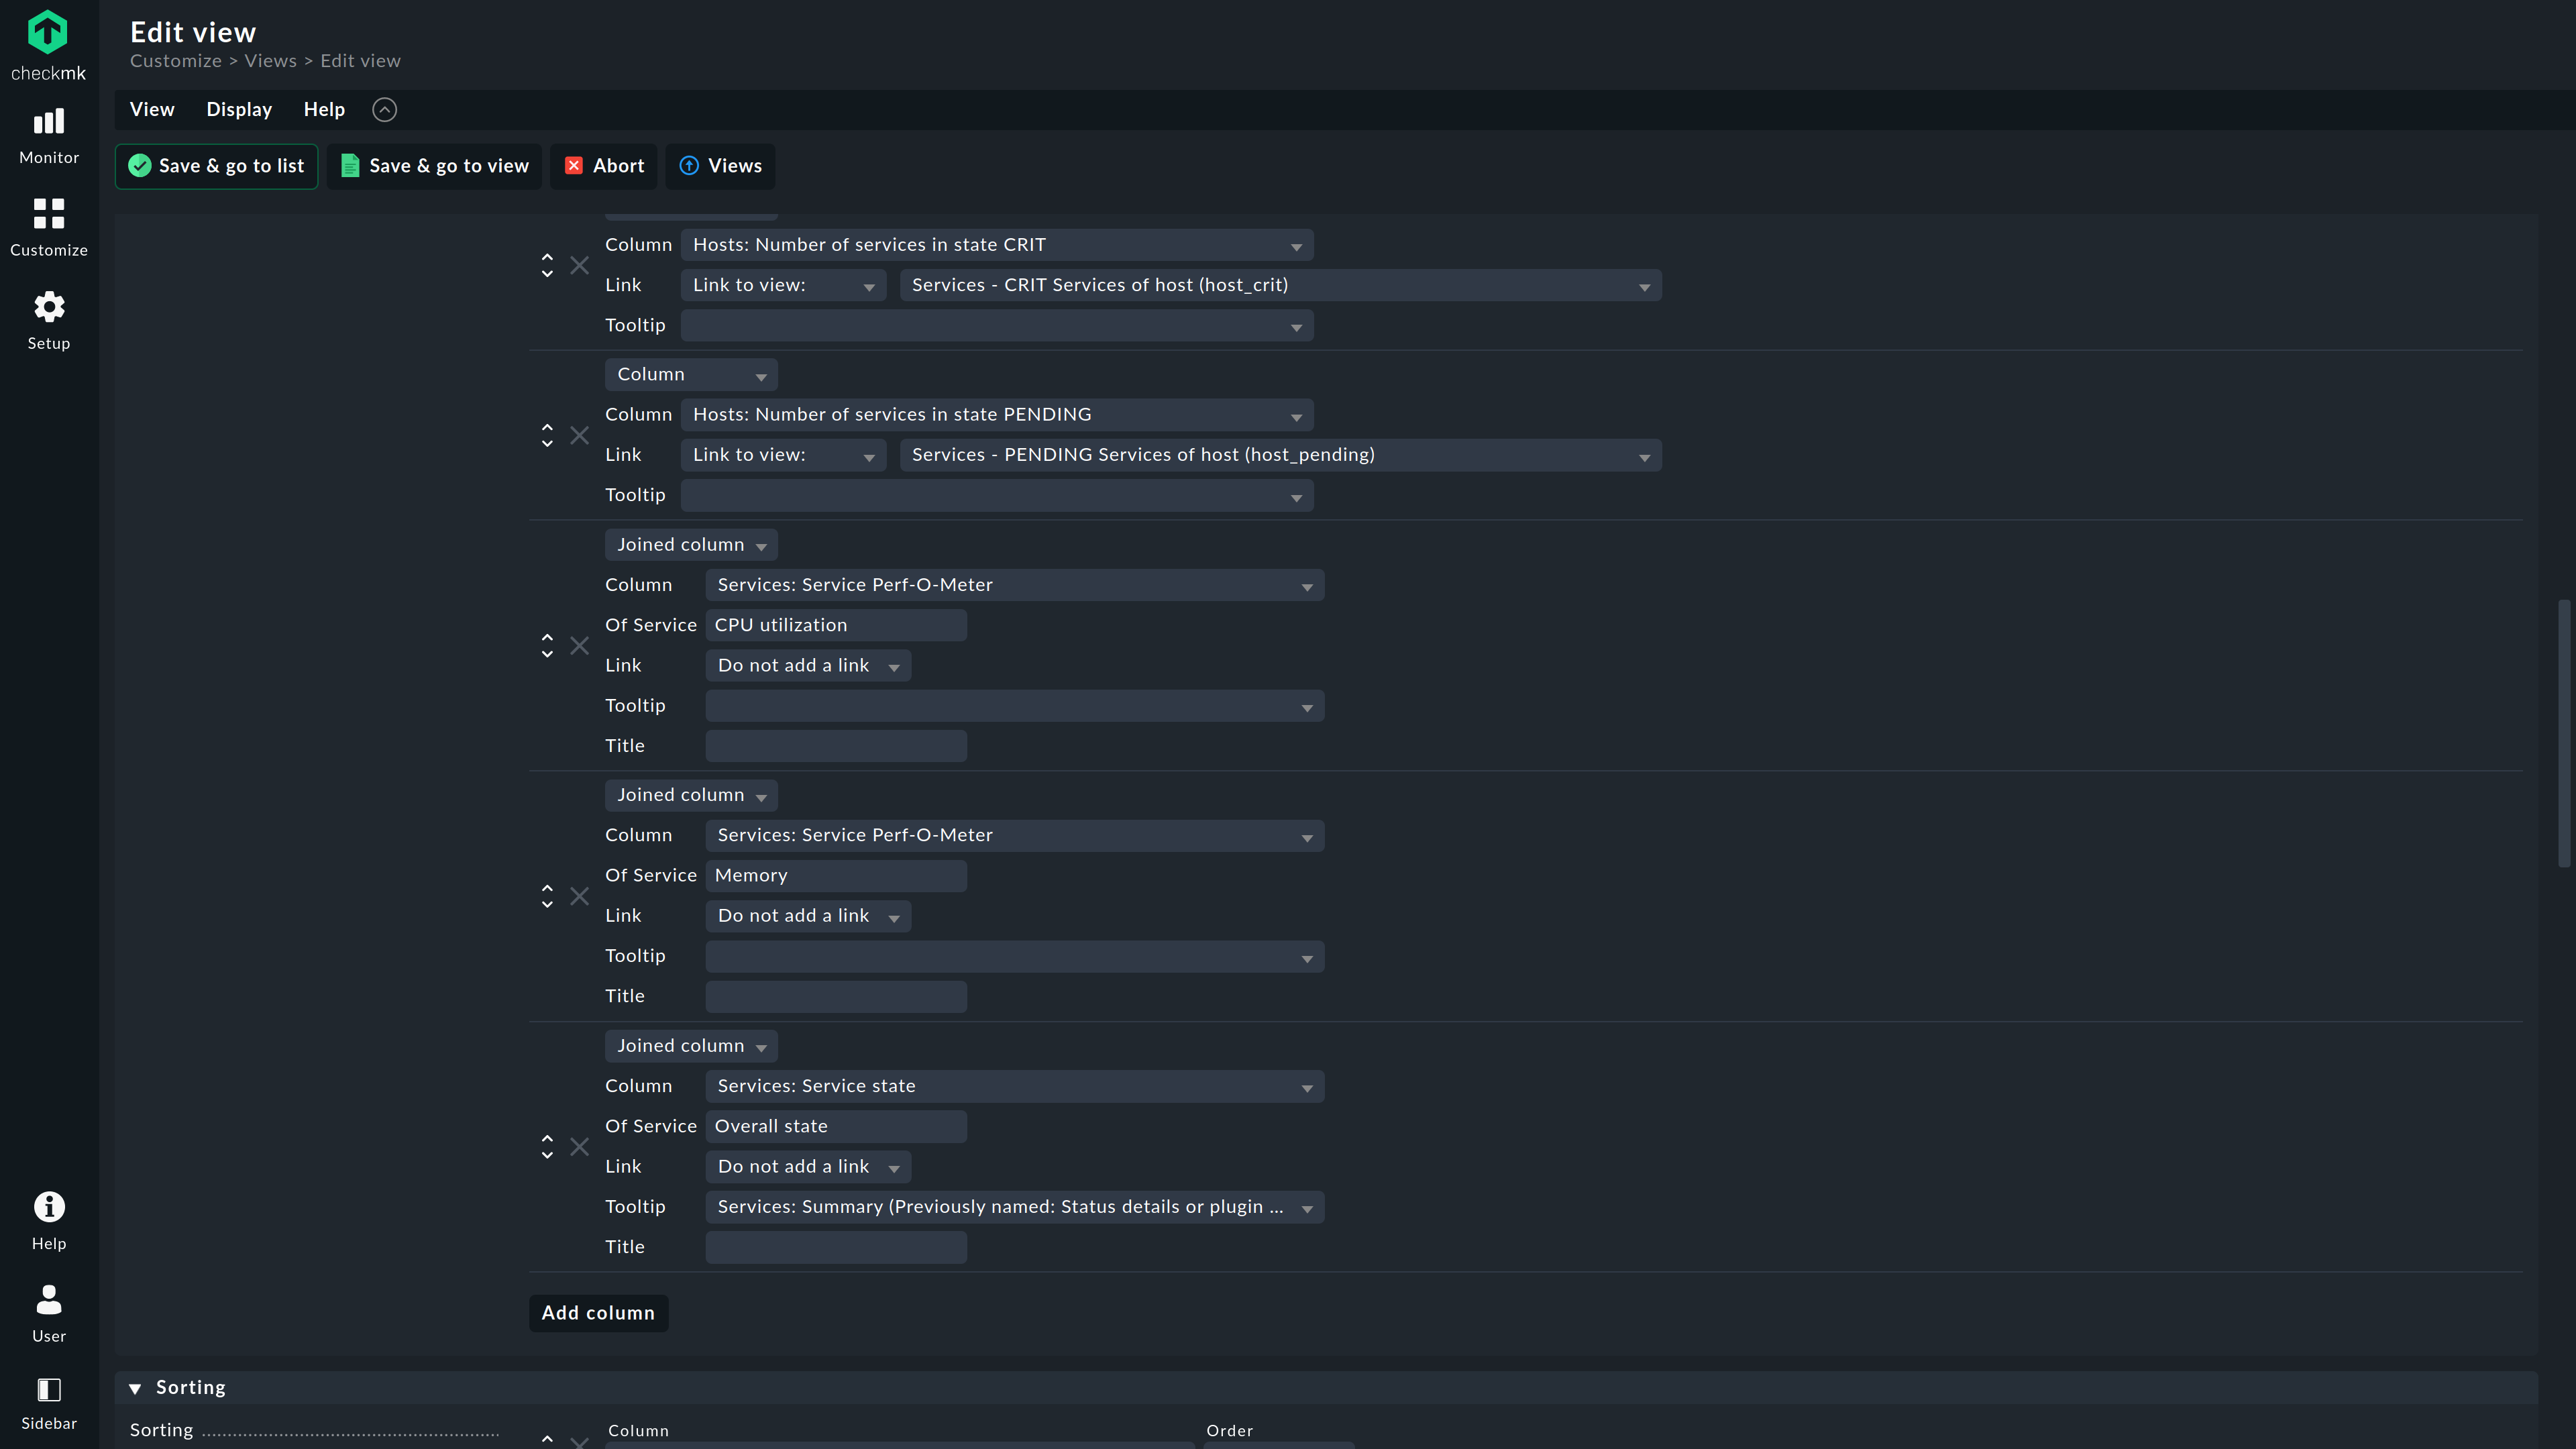
For displaying the Overall state, we choose a slight different approach as we want to see the actual state.
- Click Add column
- Select in the dropdown Joined column.
- Select Services: Service state
- In the field Of Service enter Overall state
- In the dropdown for Tooltip select Services: Summary (Previously...)
With the tooltip, we can see more details on the Overall state when we hover over the Checkmk state of that service.
Click Save & go to view in the top menu to see the results
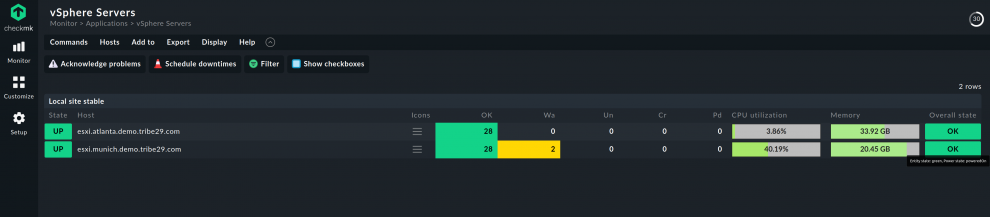
Whenever you select the dashboard vSphere Servers, you will now see this customized view!
Step 2: Enrich the vSphere VM view
For a tailore-made view of your virtual machines, let's also adapt that dashboard. How? Up to you. You learned everything you need to know in step 1.
This is what I did as I wanted to utilize only the data provided by vSphere.
Step 3: Combining your vSphere dashboards
Viewing both the vSphere servers as well as the VMs through a single pane of glass is the a final touch we do.
Let's create a new dashboard!
- In the side bar, click Customize -> Dashboards
- Click Add dashboard in the top menu
- Directly click Continue - no need to configure anything here
- Under General Properties give your dashboard a Unique ID and Title
- Click Save & go to dashboard in the top menu
You should end up with an empty dashboard now. Let's get the vSphere Servers and vSphere VMs view into this dashboard.
- In the top menu, click Dashboard -> Enter layout mode
- In the top menu, click Add -> Link to existing view
- Under Select view -> View name, choose in the dropdown Hosts - vSphere Servers (vsphere_servers)
- Click Continue
- In the next view, directly click Save
The view should appear in the dashboard now.
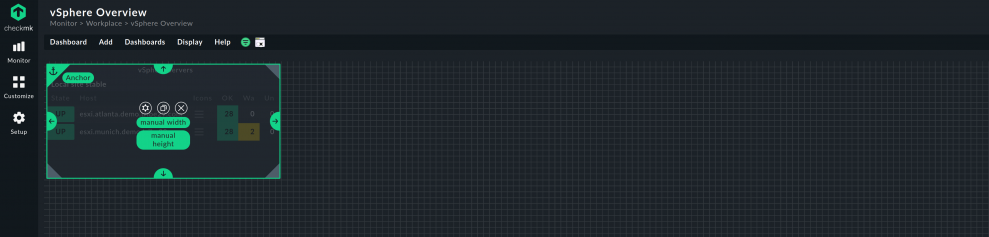
Click on manual width and manual height to automatically scale the view across the screen.
Now we need to add the vSphere VMs view and thus repeat the steps 2-5 except that in step 3, we use Hosts - vSshere VMs (vsphere_vms). We also change manual width and manual height to auto and position the new in the lower part of the dashbord by clicking into it and dragging it around with your mouse.
To wrap it up, in the top menu, click Dashboard -> Leave layout mode.
Conclusion
If you have followed this tutorial so far, you now know how to easily build a dashboard for your VMware vSphere environment. In addition, you have a good foundation for creating more dashboards for other use cases or customizing them for your own needs.
This video on dashboards will show you more options and ideas. In addition, the Checkmk forum is available to answer any questions you may have.
