Monitoring VMware with Checkmk
 on Sep 2, 2022
Note: The content on this page uses the former names of Checkmk editions. Checkmk Enterprise is now Checkmk Pro, Checkmk Raw is now Checkmk Community.
Monitoring VMware can quickly become a nightmare with an inappropriate monitoring solution. When not automated, the adding and management of VMs in your monitoring is cumbersome. At the same time, without granular filtering capabilities, you can quickly lose track of what's going on. The monitoring also needs to properly capture information from disparate sources so that IT teams can easily identify potential problems and inefficiently used resources in virtualized environments.
With the vSphere virtualization platform, VMware provides a popular solution for deploying virtual machines in data center infrastructures. In addition to the production VMs and the hypervisors, there are usually other software and hardware components that should be monitored. These include, for example, the VMware vCenter Server (or vCenter for short) management software, which usually also runs on a VM, as well as storage and networks.
In this tutorial, you will learn how to set up scalable VMware monitoring in just a few minutes. Checkmk is particularly well-suited for this purpose, as it facilitates the implementation with several automation mechanisms. It additionally has the ability to combine monitoring data from multiple sources in a meaningful way. For example, in the case of VMware, Checkmk merges information from the main vSphere components (vCenter, ESXi and the VMs) into your monitoring. Checkmk also helps you monitor backup solutions, such as Veeam Backup and Replication.
If you are looking for more general information, I recommend this guide on virtual server monitoring. Checkmk supports not only VMware but also other virtualization solutions such as Microsoft Hyper-V, Proxmox or Citrix XenApp. Following the configuration, which only takes a few minutes, you will be able to monitor all virtualization platforms with just one monitoring tool, including notifications and escalation policies.
TL;DR:
The tutorial shows how to quickly set up scalable VMware monitoring with Checkmk.
- Checkmk automates large parts of the setup and combines data from various VMware sources (vCenter, ESXi, VMs) into a clear, well-structured monitoring view.
- In addition, backup solutions such as Veeam Backup & Replication can also be monitored — all centrally within a single tool.
Prerequisites: A suitable naming policy and read-only permissions for the VMware API
Checkmk can create the monitoring hosts for your virtual machines (VMs) automatically. For the host names, it uses the display names from VMware vCenter. A consistent naming policy with DNS names is thus an important basis for this tutorial. You should follow this tutorial regarding naming concepts. It explains the criteria you should consider when naming your systems. However, do not change your systems' display names in VMware without first reading the linked article to the end.
Uniform read-only access for vCenter and ESXi hosts
To retrieve monitoring data via the VMware API, Checkmk requires a read-only user for the vCenter and for each ESXi host. Due to security implications, you should never grant further permissions to the monitoring user accounts.
For vCenter, you must assign read-only rights to the user account at the highest level and for the entire inventory. Therefore, in the vSphere Client, tick the ‘Propagate to children’ checkbox in the configuration. In my example, I have selected ‘monitoring’ as the vCenter username. Since by default the domain in vSphere is ‘.vsphere.local’, I will later set up access in Checkmk with ‘monitoring@vsphere.local’, since the username alone is not sufficient in Checkmk. As an alternative, here you could also use an account that you have set up via Active Directory.
On each of my ESXi hypervisors, I have created a read-only account named ‘checkmk’, and I use the same password for all ESXi accesses. Using the same credentials for all ESXi hosts is not a must, but it simplifies the configuration later.
Checkmk site ready for VMware monitoring
As an example for this tutorial, I set up a new Checkmk site with Checkmk Enterprise version 2.1 on a separate Linux server. With this edition, you can monitor an unlimited number of systems for 30 days. After the trial period expires, you can continue to use the monitoring, but the number of services will be limited to 750. Your Checkmk site must be able to access the REST API in your VMware environment on port 443. The latest version can be downloaded from the Checkmk download page. This video tutorial shows you how to install Checkmk.
This tutorial uses the Dynamic Configuration Daemon (DCD) for the automated host creation. The DCD is a feature of Checkmk Enterprise and is thus also included in the Checkmk Trial. However, the DCD is not a part of Checkmk Raw. You can also monitor VMware using Checkmk Raw, but you will need to manually create the hosts for your VMs in the monitoring.
Thanks to the automatic creation of the hosts, setting up the monitoring takes only a few minutes. This tutorial is therefore easily applicable to larger VMware environments. However, consider the size of your VMware environment when dimensioning your monitoring host server. You can add all VMs to the monitoring with a single click, so of course the monitoring server should have sufficient resources to cope with this.
Step 1: Monitoring virtual machines via VMware vCenter
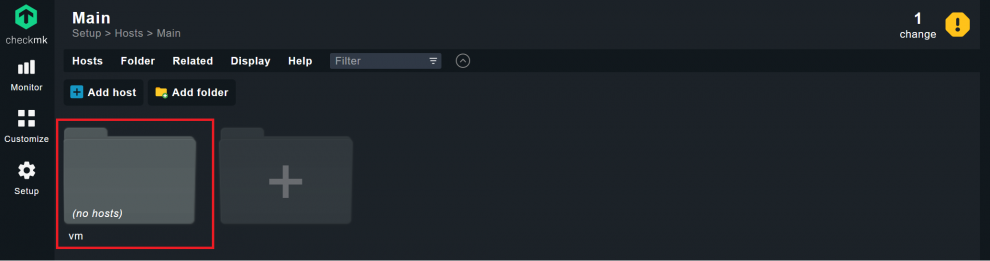
The first step is to create a folder in Checkmk to manage your VMs in monitoring.
- Under Setup -> All hosts click Add folder and enter a name of your choice under Title. I named the folder ‘vm’.
- Check the box at Checkmk agent / API integrations and select the ‘Configured API integrations and Checkmk agent’ option.
- Click Save.
You have now created a folder in Checkmk and defined that Checkmk expects the data from APIs and the agent for all hosts in this folder. This will still allow you to later install the Checkmk agent on the VMs to retrieve additional monitoring data.
Adding VMware vCenter as a host in monitoring
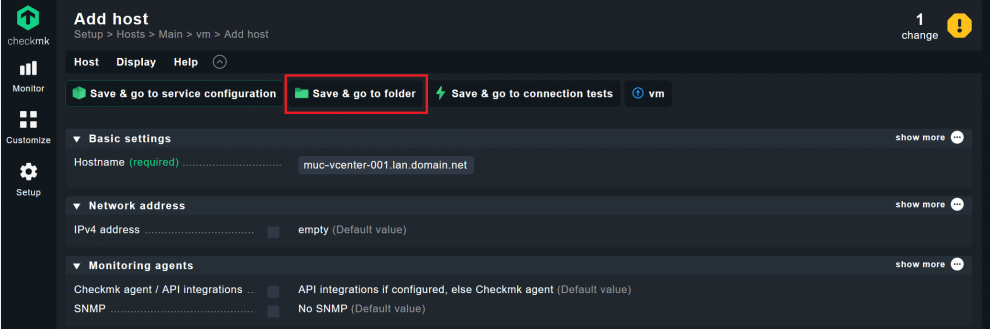
Now add vCenter to this folder as the first host.
- Open the folder you have just created by clicking on it.
- Click on Add host.
- Enter the display name of vCenter under Hostname. In my example, ‘muc-vm-vcenter-001.lan.domain.net’.
- Since the display names are DNS resolvable, you can leave all other settings as is and click 'Save & go to folder'.
If you have multiple vCenter servers in use, you can repeat this step, editing the host name for each vCenter server. However, depending on the distribution and structure of your IT environment, it may also make sense to set up the folder structure in Checkmk differently and, for example, first create a folder for each location. In that case, you should again use a separate folder with VMs for each location and not create all VMs from all sites in one folder.
If your display names in VMware are not resolvable by DNS, you would have to store vCenter's IP address under IPv4 address in Checkmk before proceeding. A non-stringent naming concept always leads to problems in the long run and makes it difficult to correctly assign monitoring data later, for example. I therefore recommend tailoring your naming concept according to the instructions linked at the beginning of this tutorial.
Retrieving monitoring data from vCenter via the VMware API
Now you need to grant Checkmk access to vCenter, and decide what data it should retrieve from there.
- Click again on Setup and search for ‘vmware’.
- Then click the ‘VMWare ESX via vSphere’ rule.
- Click on Add rule.
- Under VMWare ESX via vSphere, edit the items in order: Under vSphere User name, enter your prepared user account for vCenter. In my example this is ‘monitoring@vsphere.local’ followed by the password under vSphere secret.
- Since you are using VMware vCenter, you must set the Type of query selection to ‘Queried host is the vCenter’.
- You only need to check the box at TCP Port number if you have set the port for HTTPS to a different port, but this is not necessary in most environments.
- For SSL certificate checking you can stay with the default ‘Use hostname’ setting if you are using a certificate issued by a certificate authority for vCenter. If this is not the case, you would have to select the ‘Deactivated’ option under SSL certificate checking. Keep in mind that by default, VMware vCenter starts with HTTPS and a self-signed certificate.
- With the Connect Timeout option, you can tell Checkmk to abort in the event of excessive response times. You won't normally need this option, so don't check it.
- Under Retrieve information about, decide for which systems Checkmk should retrieve data from vCenter. Deselect the ‘Host Systems’ option so that the ESXi hosts do not end up in your VMs folder. You will create these hosts separately later. ‘License Usage’ allows you to retrieve the overall status of vCenter licenses in use. This is only required for very large datacenters with over provisioned licenses, so I do not use this option here.
- Leave the options for monitoring Placeholder VMs and Display ESX Host power state on disabled. You should, however, enable the VM snapshot summary option here, since forgotten snapshots can sometimes lead to dramatic problems.
- By default, Checkmk takes the display names configured in vCenter as the host names. Under Piggyback name of virtual machines, you can tell Checkmk to use the names as stored in the ESXi hosts. I don't need this option in this tutorial and don't recommend using it, as the VMware interface is prone to errors here in practice.
- Checkmk does not allow spaces in host names, but display names in VMware can theoretically contain blank characters (spaces). If you are using DNS names in VMware (according to my recommendation), you cannot include any spaces. If you have nevertheless used spaces in VMware, you can use Spaces in hostnames to decide how Checkmk should handle them.

- Under Conditions, select your vCenter server under ‘Explicit hosts’. If you have multiple vCenter servers in use and use the same credentials for all read-only accounts, you can query all vCenter servers together with a single rule. Simply add the appropriate vCenter hosts here. Alternatively, you will need to configure a new rule for each vCenter server and adjust the credentials and explicit host for each.
- Click Save to save the rule.
Checkmk can now retrieve the data from vCenter via the VMware API. For this, you should start the automatic service discovery in Checkmk for your vCenter host.
- Go to Setup -> Hosts and click on your folder. You should now see the vCenter host.
- Click on the yellow icon for your vCenter host right in the middle of the toolbar.

- Wait for Checkmk to complete the automatic service discovery and click Accept all.
- Important at this point: Do not activate the ‘pending changes’ yet, for now read this chapter to the end.
You have now included all VMs as monitoring services – and perhaps more than that. For example, the VMware API is not able to distinguish between templates and VMs. Therefore, if you have created templates in vCenter, in the monitoring Checkmk will identify your templates as powered off VMs in addition to the real VMs and would by default assume an error.
You could manually disable the individual services in the templates following the service discovery. However, if you use a consistent naming concept in VMware, you will reach your goal faster with the disable service rule in Checkmk. This will also exclude any templates that you may create in the future from the monitoring.
For my purposes, I have prefixed all template display names in VMware with ‘template’. This makes removing the template services from monitoring child's play:
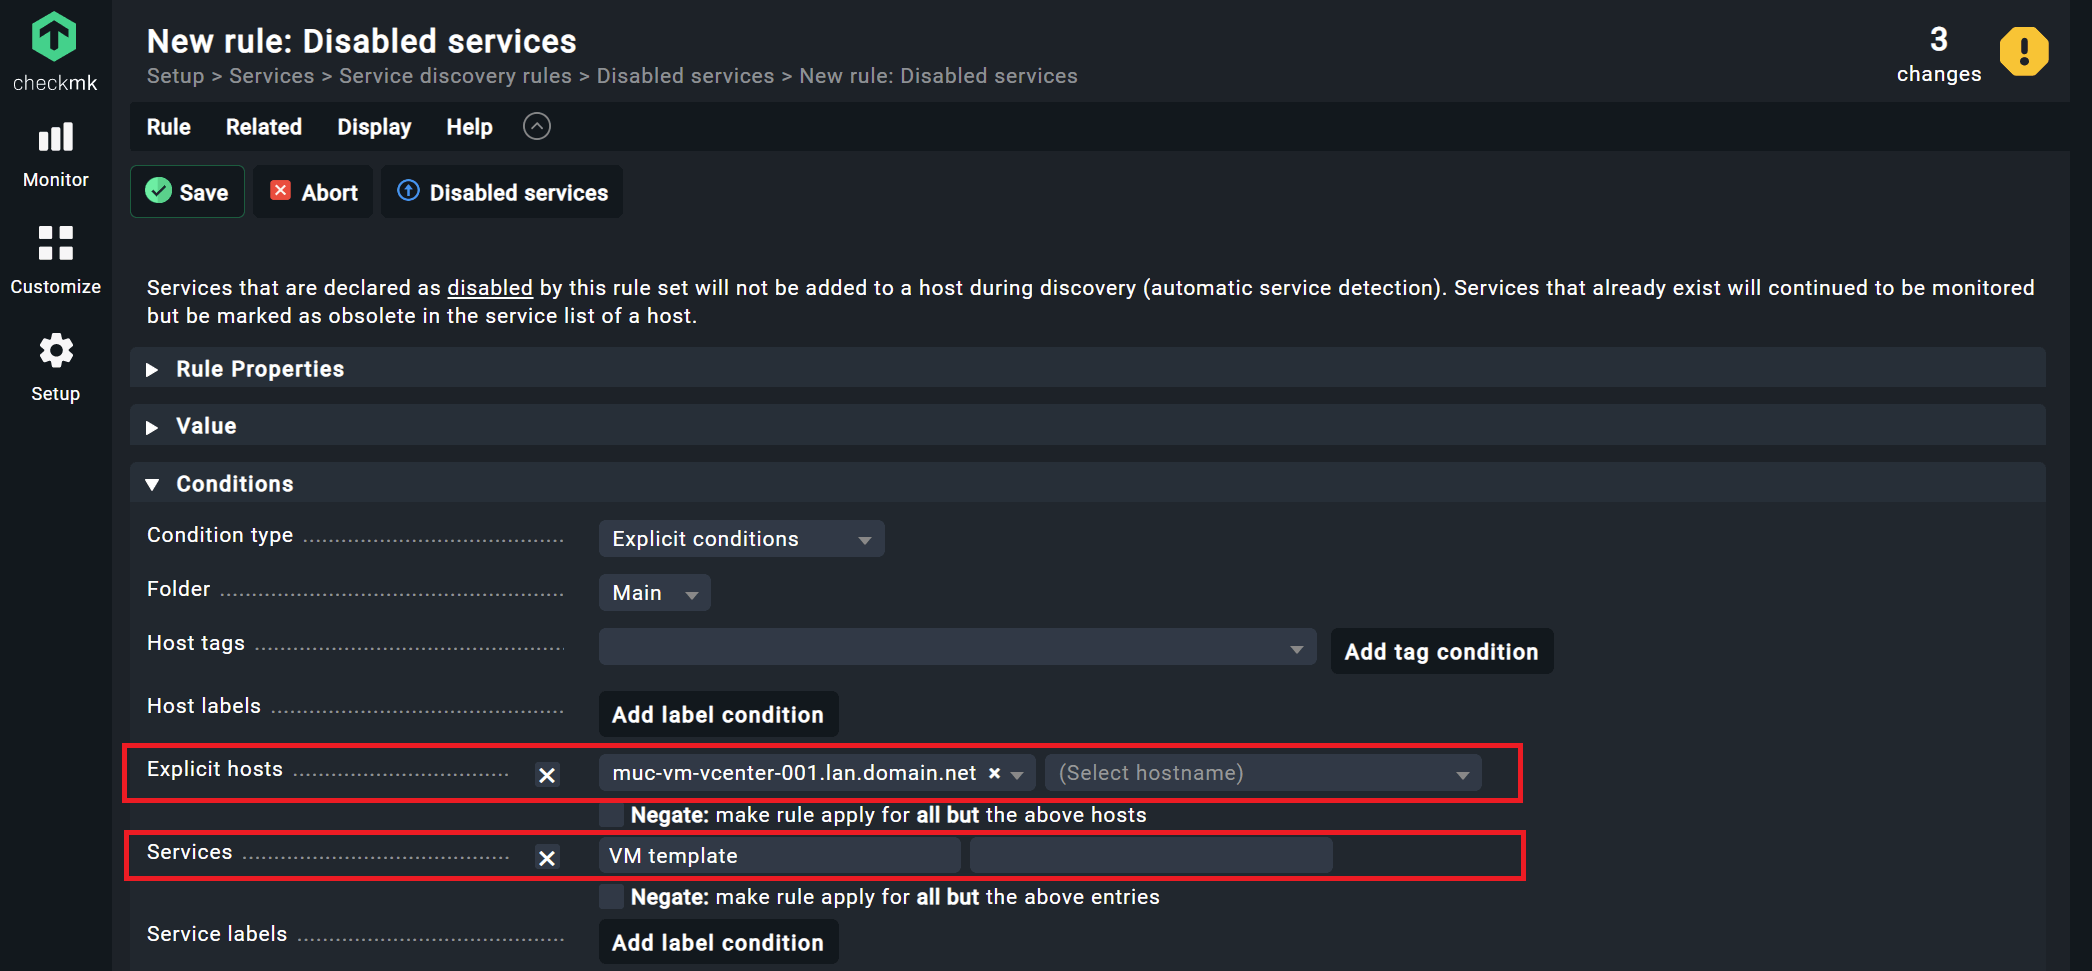
- Click on Setup. Search for ‘disable’ and click on ‘Disabled services’.
- Click on Add rule.
- Under Conditions, select the Explicit hosts option and enter your vCenter host there. If you use multiple vCenter servers, you can enter multiple hosts here. In my case, I enter ‘muc-vm-vcenter-001.lan.domain.net’.
- Then activate the checkbox at Services. Based on the service names, you can now disable services. I use the regex ‘VM template’. This disables all services with the prefix ‘template’ for vCenter. Note that Checkmk adds the abbreviation ‘VM’ prefixed to the VM service name.
- Save the rule with Save.
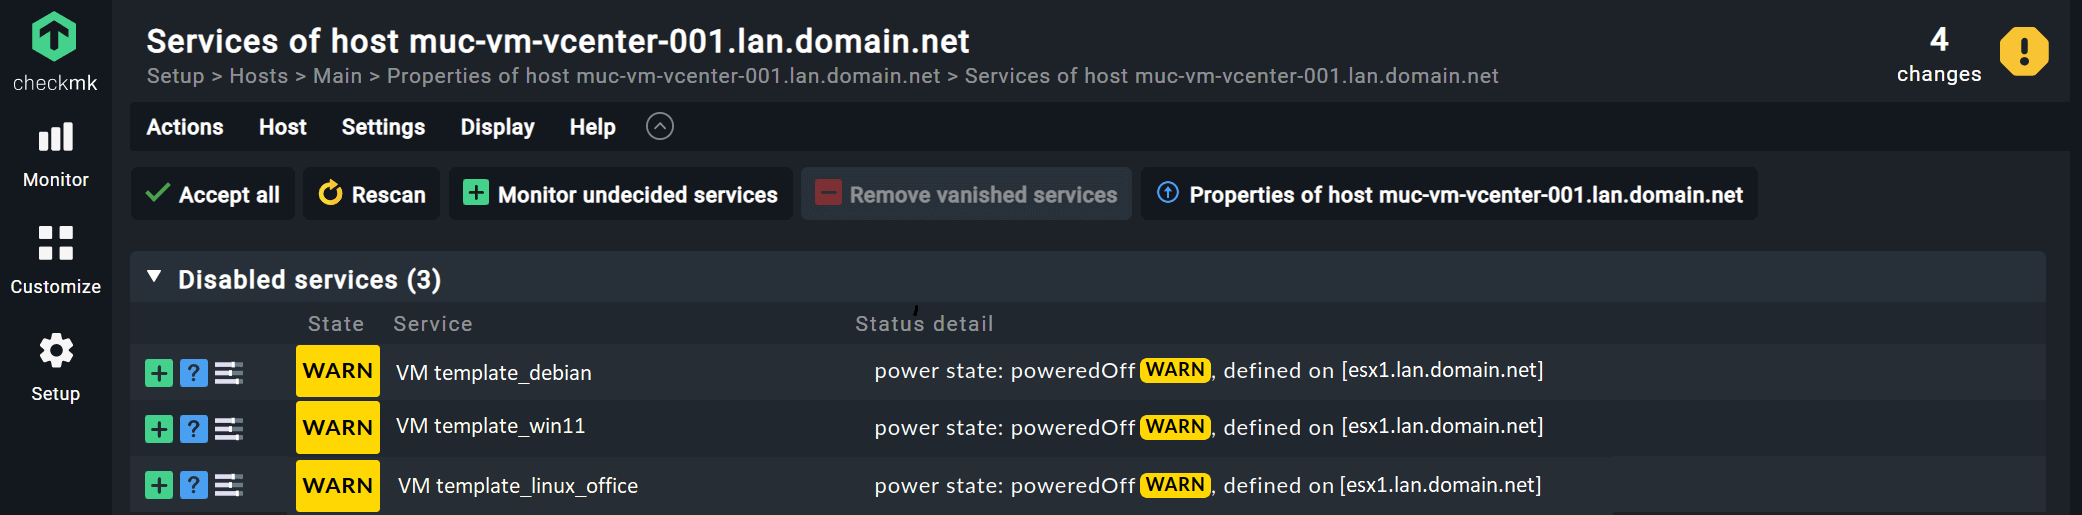
- Now, start the service discovery for the vCenter host again as before under Setup -> Hosts. Click again on the yellow icon in the middle in front of your vCenter host.
- Compared to previously, your template services are now all disabled. Click Accept all.
If you have a suitable naming concept, you can, of course, use this rule to sort out other vCenter services according to the same principle.
- You can now activate the changes in Checkmk. Click on the yellow icon with the exclamation mark in the top right corner. You should see the number of ‘changes’ there.
- Click Activate on selected sites.
You have now added the vCenter server as a host to your monitoring. Your VMs will now appear as monitoring services of your vCenter host.
Step 2: Create hosts for VMware VMs with the DCD
Checkmk uses the piggyback mechanism, with which it transfers information based on the host names to the appropriate hosts in the monitoring. This can be, for example, the data on the individual VMs from the ESXi host or vCenter.
However, to do this, you must first create the VMs as hosts in Checkmk, since they are currently only visible as services within your vCenter server. The host names in Checkmk must correspond to the display names in VMware. Only then can Checkmk correctly assign the piggyback data.
You could create the hosts for the VMs manually, but it can also be done more easily via the Dynamic Configuration Daemon (DCD) mentioned at the beginning of this tutorial, with which Checkmk can create the hosts for your VMs automatically:
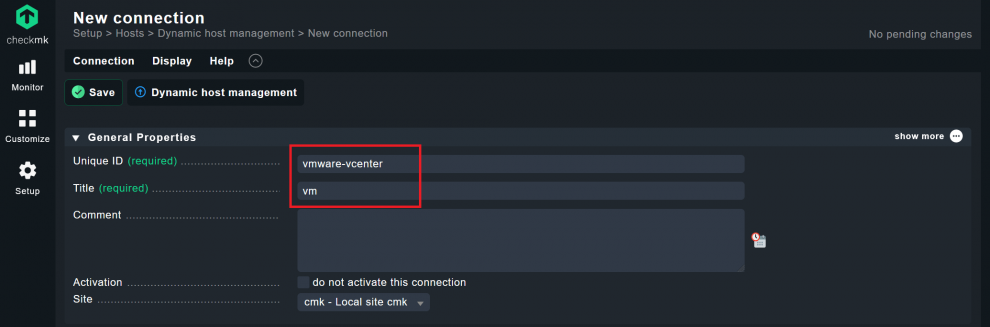
- Under Setup, search for ‘dynamic’ and click ‘Dynamic host management’. Click on Add connection.
- Under General Properties, choose any Unique ID and a Title. For my example, I chose ‘vmware-vcenter’ and ‘vm’.
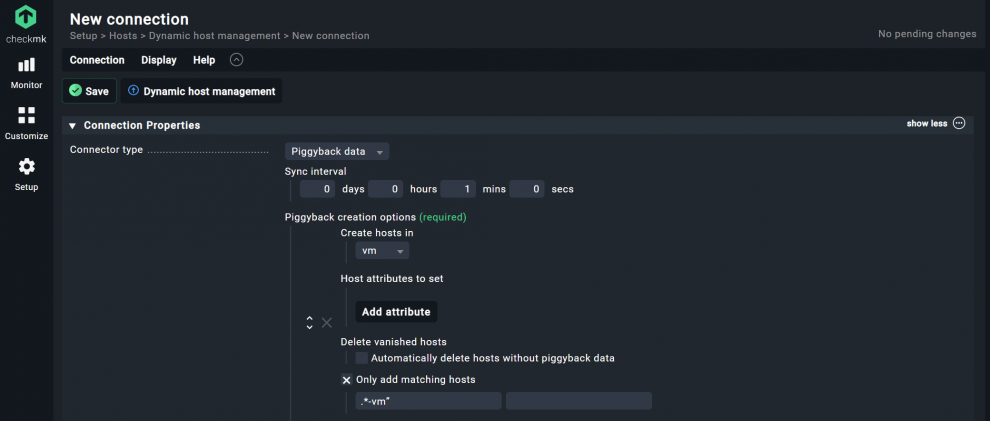
- Under Connection Properties, you must click ‘Add new element’ once to allow Checkmk to automatically create hosts.
- In addition, you must adjust the advanced options at Connection Properties. To do this, click on ‘show more’.
- Under Piggyback creation options, select the destination folder for your VMs. In my case ‘vm’.
- At Hosts attributes to set, attributes for Monitoring agents: SNMP, Monitoring agents: Checkmk agent / API integrations, Monitoring agents: Piggyback and Network address: IP address family are predefined. Delete the four defaults, since you do not need these for the VMware monitoring. To do this, click once on each of the four X symbols for the individual attributes, so that they disappear.
- Enable the Only add matching hosts option and use regex to create hosts only for the VMs. If you followed the link to the recommendations for a naming concept, you can enter " .*-vm" here. Leave the other settings as they are.
- Click on Save.
Checkmk will now create your VMs as hosts based on the piggyback data from the vCenter server and automatically assign the appropriate monitoring services to them. If you later add more VMs via vCenter, Checkmk will also create their hosts automatically.
Just as before with the services of the vCenter, the VMware API does not allow differentiation of, for example, templates and VMs. Therefore, the option Only add matching hosts and a consistent naming concept is again important. Then via a regex in Checkmk you can really create the hosts only for VMs in vCenter. In my case, all VMs have a ‘-vm’ in their display name, but templates do not.
If you don't use this filter option at this point, you will have to manually edit the unwanted hosts once the DCD has created them. This is another example of additional work that you can avoid with a consistent naming concept.
If you enable the Delete vanished hosts option, Checkmk will delete hosts if no data is available for them over a period of more than ten minutes. I do not use this option in this tutorial.
Step 3: Including data from ESXi hosts in the monitoring
Now retrieve the monitoring data from the ESXi hosts. To do this, first create a folder for the ESXi hosts.
- Under Setup -> All hosts you again create a folder with Add folder. As its Title I use ‘esxi’ here. You can use a name of your choice.
- Click on Save.
You cannot install Checkmk agents on ESXi hosts, so you can keep the default setting for this folder.
Setting up access to ESXi hosts via the VMware API in Checkmk
Create a rule to be able to retrieve the data via the VMware API:
- Click Setup and again search for ‘vmware’. Click on ‘VMWare ESX via vSphere’.
- Click on Add rule.
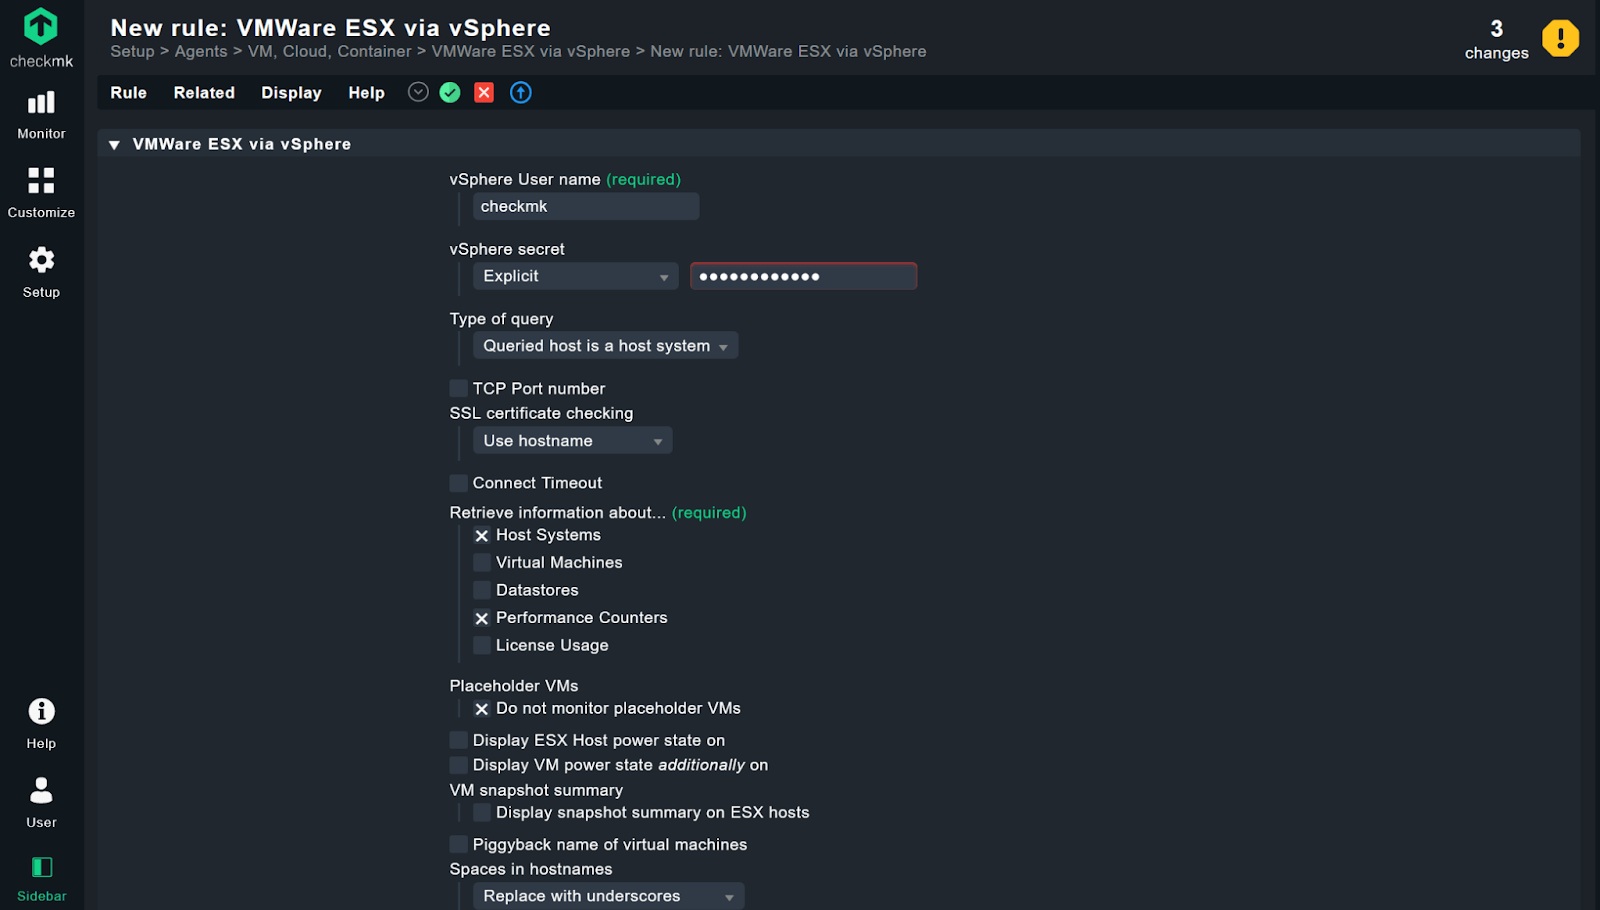
- As the vSphere User name, you use your read-only account. For my account, this is called ‘checkmk’ for all ESXi hosts. This is followed by the appropriate password under vSphere secret.
- For Type of query you retain the default settings ‘Queried host is a host system’.
- Connect Timeout can be left as is.
- Under Retrieve information about... there are important differences compared to the previous configuration for vCenter. You now leave ‘Host Systems’ and ‘Performance Counters’ enabled, but uncheck ‘Virtual Machines’ and ‘Datastores’. You already get this information from vCenter.
- Piggyback name of virtual machines and VM snapshot summary also remain disabled.
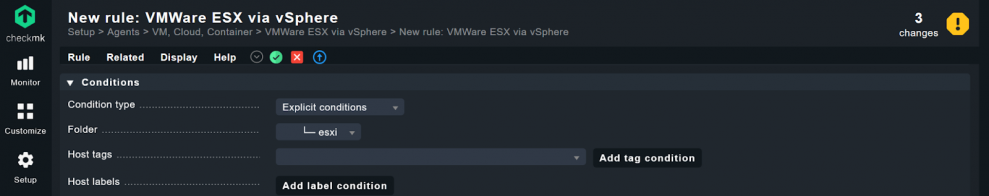
- This time select the folder you just created for the ESXI hosts under Conditions at Folder. In my example this is ‘esxi’. Since I use the same credentials for all ESXi hosts, I can apply the rule to the folder. If you use different credentials, you must define the rule with the respective credentials for each ESXi host.
- Click Save to store this rule.
You have now configured your VMware monitoring to retrieve data from all VMs via vCenter. However, you do not get the information for the ESXi hosts from there, but instead from the hypervisors directly. This is the only way to monitor hardware-specific data, such as the health of the network cards, on the cluster nodes. It also makes you independent of vCenter. If this fails as a data source, you will still have the information on the health of your VMware hardware.
If you are using an ESXi host as a stand-alone hypervisor without vCenter, then you need to retrieve the information from your VMs and datastores directly from it. To do this, you must leave the options in Retrieve information about... enabled.
If, on the other hand, you rely on a VMware cluster, only vCenter provides the overall view of the VMs and the provisioning of the datastores for all VMs. ESXi hosts, on the other hand, see only the provisioning of their own VMs. If you were to monitor provisioning across vCenter and ESXi hosts twice, provisioning value mismatches would occur. Similarly, moving VMs to another node with the individual ESXi host data will not map cleanly in monitoring.
Adding ESXi hosts to Checkmk
You can now add your hypervisors as hosts in Checkmk. In this tutorial, I manually add them as hosts to the monitoring. If you have more than five or ten ESXi hosts, you can import them via a CSV file. Follow these instructions in the Checkmk manual.
- Go to Setup -> Hosts and select the folder to which you applied the rule for the ESXi hosts, in my case ‘esxi’.
- Click on Add host.
- As the Hostname enter the display name for the first ESXi host, for my example ‘muc-sr1-esxi-001.lan.domain.net’.
- Click on Save & go to service configuration.
- Wait until Checkmk has completed the automatic service discovery.
- Click Accept All, but do not close this view yet.
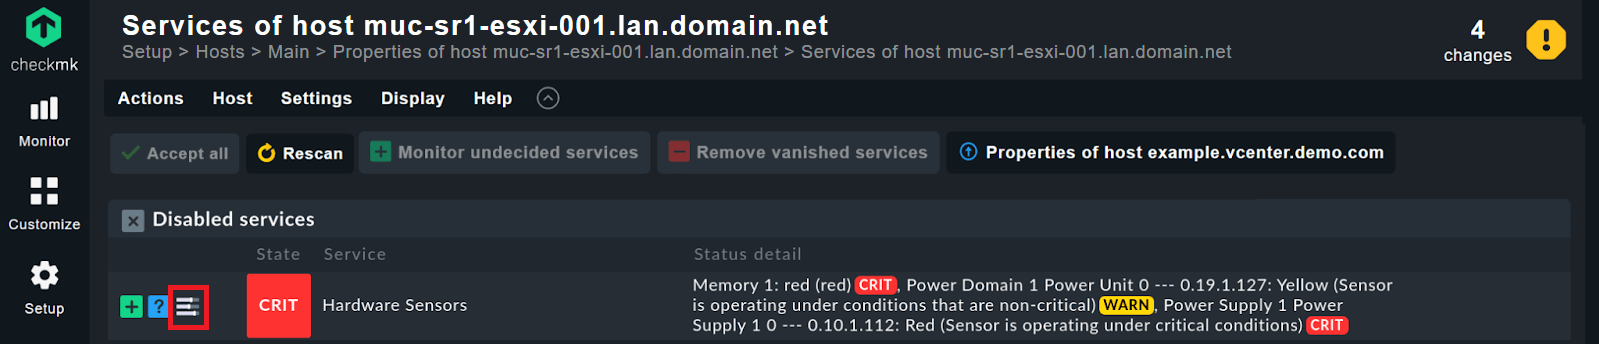
For ESXi hosts, you should disable the ‘Hardware Sensors’ monitoring services for all ESXi hosts at this point. Since you later monitor the server hardware via the server's management board, you do not need VMware's hardware monitoring. Moreover, this does not always work reliably and often generates false alarms.
- Remove the ‘Hardware Sensors’ monitoring service again. Simply click on the red X symbol in front of the ‘Hardware Sensors’ monitoring service. This will then be moved to the Disabled services area.
- There, click on the action menu, the third icon on the ‘Hardware Sensors’ service.
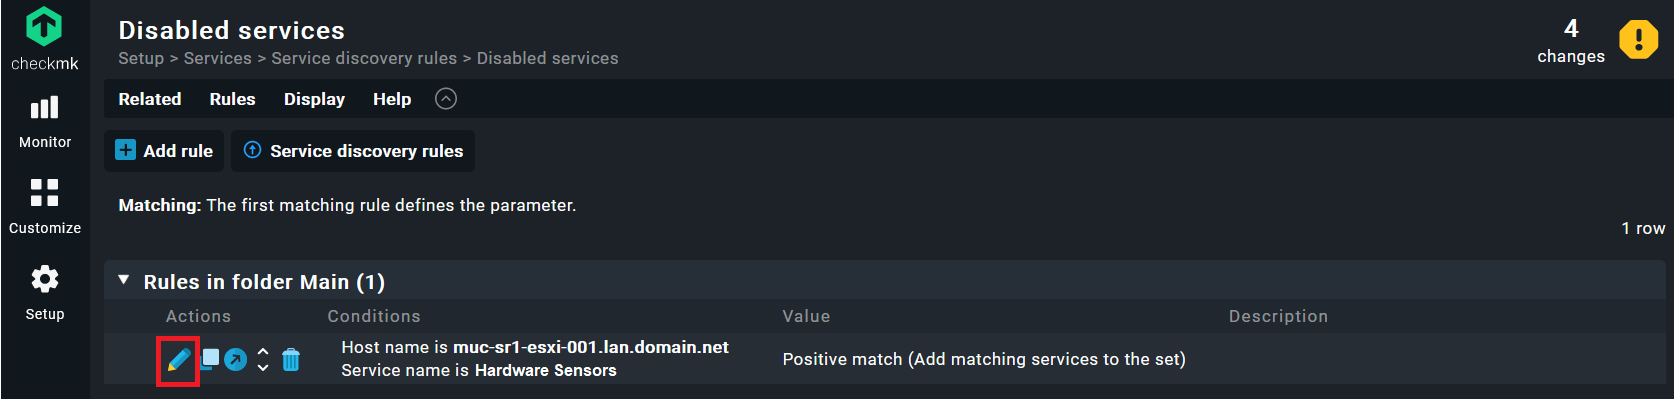
You will now see the disabled services for this host. These are controlled by the ‘Disabled services’ rule.
- Click on the first icon under Action for your monitoring rule for the hardware sensors. You can recognize the appropriate rule by the text under Conditions. In my case it says ‘Host name is muc-sr1-esxi-001.lan.domain.net Service name is Hardware Sensors’.
- Now customize the rule. Scroll down and under Conditions, specify that Checkmk applies this rule not only to this particular ESXi host, but to all hosts in your ESXi folder.
- At Folder, select your folder for the ESXi hosts, in my case ‘esxi’.
- Uncheck the box at Explicit hosts.
- Click on Save.
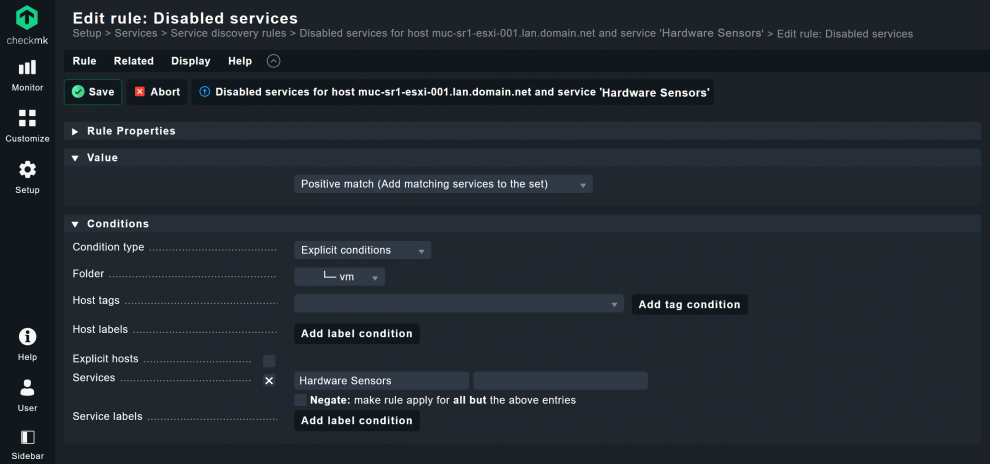
This option disables this service for all hosts in this folder. So, you only need to edit this rule once and you can add more ESXI hosts in the future without having to worry about the hardware sensors again.
Only in really large VMware environments with many hypervisors can it save time to have all ESXi hosts created with the DCD based on the vCenter piggyback data instead of adding them via CSV lists. For example, by using the recommended naming concept here, you can employ a regex to apply the rule only to ESXi hosts. If you then retrieve the monitoring data from the ESXi hosts directly, the hosts will persist even if the vCenter goes down. This does require some experience with monitoring rules, however. For this reason, I recommend that at the beginning you always add ESXi hosts manually to the monitoring.
Step 4: Customizing VMware monitoring via rules
You have now set up a monitoring for your VMs and ESXi hosts. There are more rules in Checkmk, however, that make VMware monitoring easier for you on a day-to-day basis. I would like to show you how to use two of these rules now.
Configuring default states for VMware assets in monitoring
In the previously mentioned blog on naming concepts, I use an underscore as a prefix with display names in VMware for VMs that are no longer in use and which will soon be deleted. For example, if you are planning to delete the test system ‘muc-vm-test-01.lan.domain.net’ soon, add an underscore and its new display name will be ‘ _muc-vm-test-01.lan.domain.net’.
This is then also an indication that this VM should be disabled. By default, Checkmk assumes that a VM should be online. You can use the ‘ESX host and virtual machine states’ rule to customize the defaults for warnings and critical states for selected services. Here, I show you how to use the ‘ESX host and virtual machine states’ rule to customize the configuration for all systems with an underscore prefix in their names.
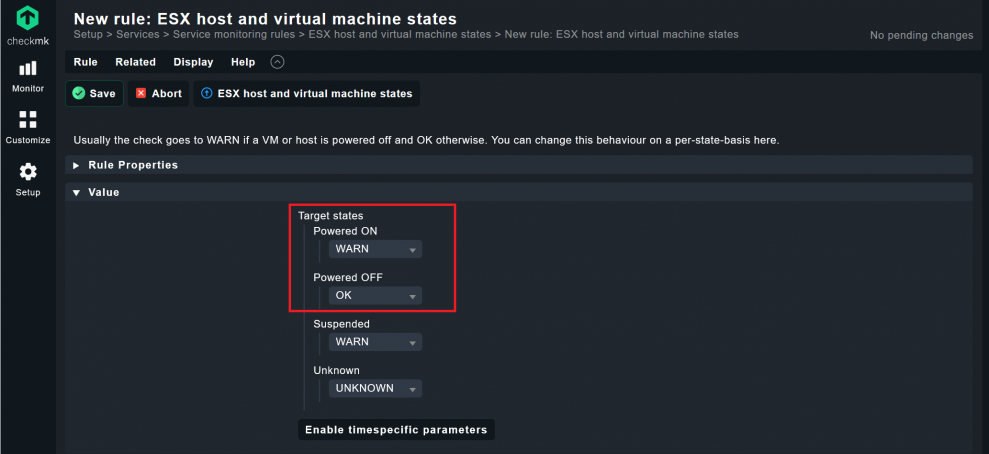
- Click Setup and search for ‘esx’. Click ‘ESX host and virtual machine states’.
- Then click Add rule.
- Under Target states, set the following items:
- For Powered ON, select the ‘WARN’ option.
- For Powered OFF, select the ‘OK’ option.
- Under Conditions, select the checkbox at Name of the VM/HostSystem.
- Enter ‘VM _’ as the condition in the input field.
- Click on Save.
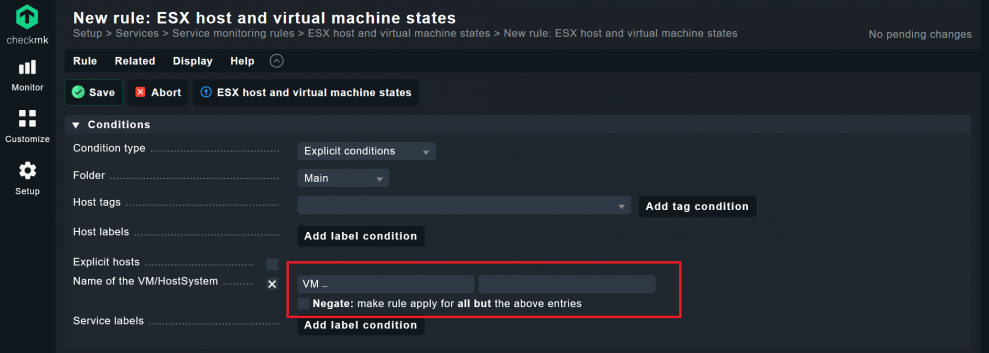
Checkmk automatically adds the abbreviation ’VM’ from the service name to the display name of each VM. By using the regex ‘VM _’, Checkmk modifies the configuration of the Status for all VM services with the prefix ‘_’. These services should now be offline, and you will not get false alerts in Checkmk.
In the future, if you want to take a VM offline permanently, all you need to do in the VMware client is to add an underscore prefix to its display name and run a new Service Discovery. Checkmk will then recognize that this VM's monitoring service should be offline.
Of course, this is just an example of how to apply this rule. In the same way, you could also configure the status of replica servers from VMware. The Enable timespecific parameters option also gives you the ability to set specific times for your VMs/hosts in Checkmk, such as when they are scheduled to be DOWN during maintenance windows.
Deactivating VMware monitoring services
You have already used the Disable Service rule to exclude the Hardware Sensors service. I would also like to show you how to use a single rule to permanently remove unwanted VMs from monitoring. The key is again a consistent naming concept. In my example, this is all VMs with the prefix ‘#’.
- Click on Setup. Search for ‘Disable’ and there click on ‘Disabled services’.
- Click on Add rule.
- Under Conditions, activate the checkbox at Services. I use the regex "VM #".
- Store this rule with Save.
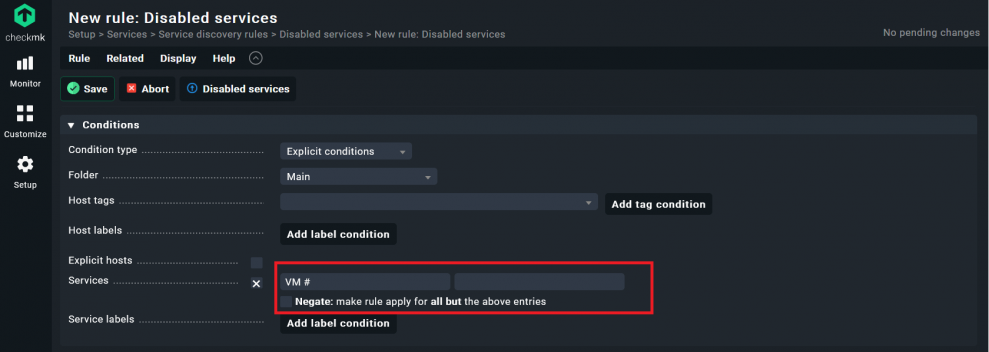
Checkmk will now apply this rule to the root directory and thus to the complete monitoring for this Checkmk site.
Step 5: Hardware monitoring via the management board
You have now created all VMs and ESXi hosts in two separate folders in your monitoring. A fully comprehensive VMware monitoring also includes the monitoring of the server hardware. I recommend querying the appropriate information via the server's management board and creating a single host for each hardware server. I query the data via SNMP. Checkmk also supports queries via IPMI.
- Again, create a new folder under Setup and name it as you wish. In my example, I use HPE servers, so I name the folder ‘ilo’. In Dell, for example, the management boards are called ‘iDRAC’.
- Under Monitoring agents, enable Checkmk agent / API integrations and select ‘No API integrations, no Checkmk agent’.
- In addition, activate the checkbox at SNMP and select your SNMP version. For my example, it is "SNMP v2 or v3".
- Store the folder with Save.
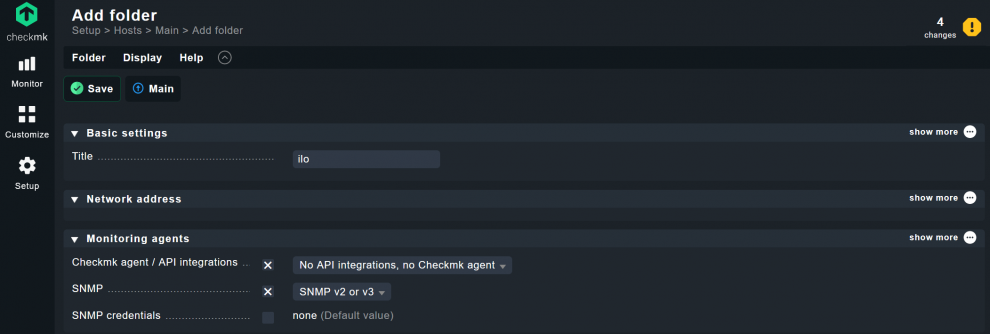
I don't use SNMPv3, instead I use v2c and the default SNMP community ‘public’ for all of my management boards. This is the default configuration in Checkmk. Hence, I don't need to enter any more data when creating the hosts. If you have a different SNMP community and/or use SNMPv3, then check the box at SNMP credentials and add the appropriate information.
- Under Setup, click again on Hosts and click on the folder you just created.
- Now, click Add Host to create the host for your first management board.
- Under Hostname, add the name of your management board, in my example ‘muc-sr1-esxi-001-ilo.lan.domain.net’.
- Click Save & go to service configuration, and then wait for the service discovery.
- Click on Accept all.
- Repeat this procedure for each hardware server with a management board.
Since you have already stored the appropriate configuration in the folder, all of the hosts inherit the correct settings, which saves time. If you use a number of different SNMP communities for your management boards, you would always have to configure them individually when adding the individual hosts. A configuration via the folder, on the other hand, saves configuration effort.
You can see that some changes have accumulated in the monitoring. You should accept the changes in Checkmk:
- Again, go to the yellow icon in the top right corner, and again activate the ‘pending changes’ by clicking Activate on selected sites.
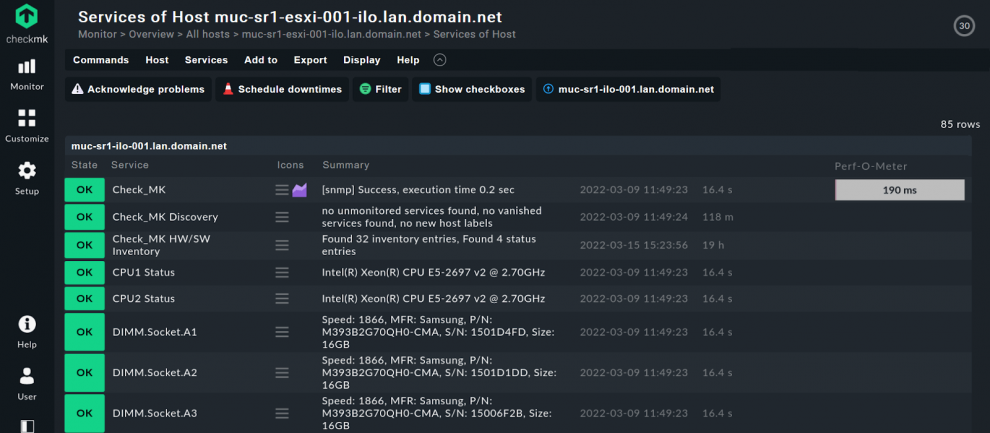
For example, the hardware server's host view looks like this in my monitoring:
Step 6: Veeam backup monitoring for VMware
At this point, I would also like to show you how to monitor all the backups for your VMs. I use Veeam as a backup tool and have set up a hardware backup server called ‘muc-sr2-veeam-001.lan.domain.net’. I use the Checkmk agent plug-in for Veeam:
- Add your backup server as a host to the monitoring. To do this, go to Setup and click Add host.
- Enter your backup server name as the Hostname. In my example ‘muc-sr2-veeam-001.lan.domain.net’.
- Click on Save & go to folder.
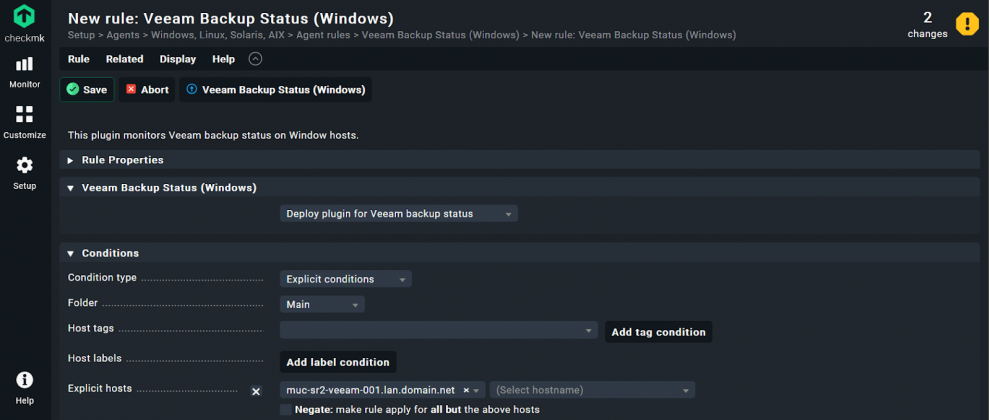
- Click on Setup again. Search for ‘veeam’. Click on ‘Veeam Backup Status (Windows)’.
- Under Conditions you should assign this rule to your backup server, so in this tutorial I choose ‘muc-sr2-veeam-001.lan.domain.net’ under Explicit hosts. Otherwise you can leave all other settings as they are.
- Store the rule with Save.
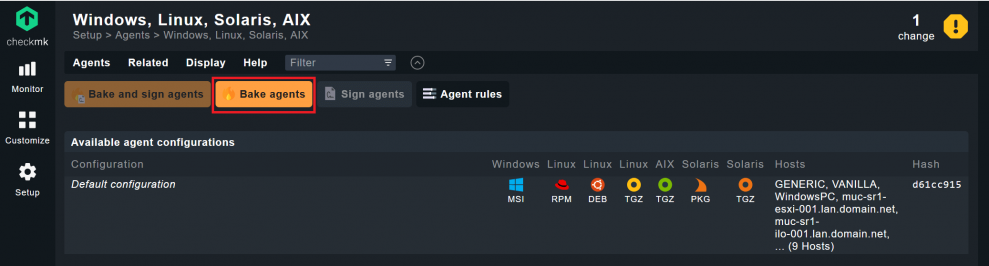
- Now go to Setup -> Agents -> Windows, Linux, Solaris, AIX.
- You can see from the orange button that Checkmk's Agent Bakery is ready to bake an agent for you.
- Click on ‘Bake agents’.
- Wait until the agent finishes baking and appears as an option for selection. Then download the Windows agent with the configured Veeam plug-in.
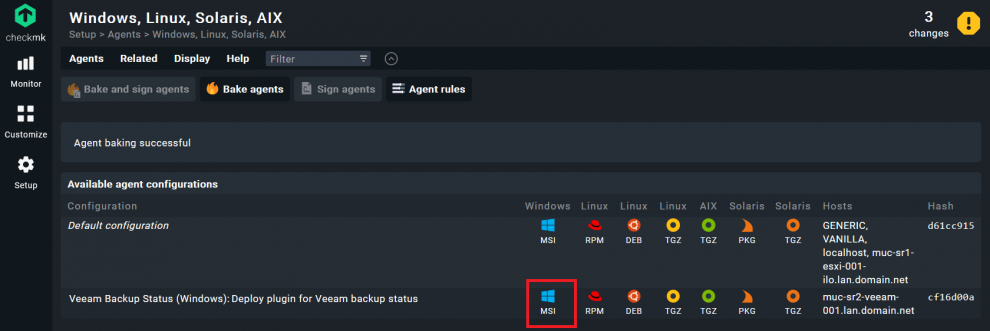
- Install the agent on your Veeam server.
- Once the agent has been installed, go to Setup -> Hosts and select your Veeam server's host. Start the automatic service discovery for your Veeam server.
- Click on Accept all.
The Veeam plug-in not only monitors the Veeam jobs on the Veeam server, but also transmits services as piggyback data for the VM hosts. In order for Checkmk to include the ‘Veeam Client’ service for each VM host in the monitoring, you must start a service discovery for all VM hosts. The easiest way to do this is with a ‘Bulk Discovery’ for your VM folder.
- Go to Setup -> Hosts and open your VM folder.
- Click Hosts in the top menu bar. Select ‘Discover services’.
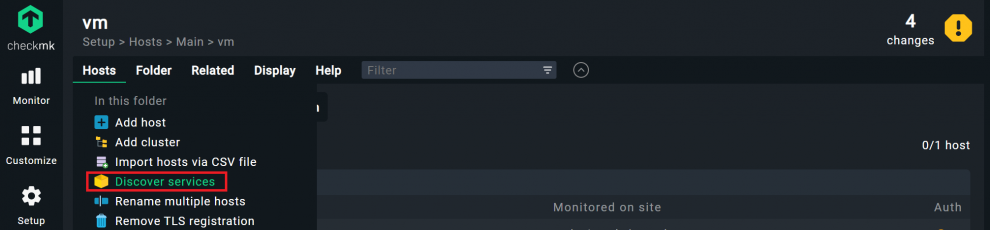
- In the Bulk discovery window, you can accept all default options and click on ‘Start’.
- Following a service discovery, you will see a summary in the Background job details window. Checkmk should have detected some new services.
- Confirm the 'pending changes' again.
- Checkmk will now monitor the operation of Veeam, but will also capture the appropriate piggyback data from the Veeam host and distribute it to the VM hosts in Checkmk.
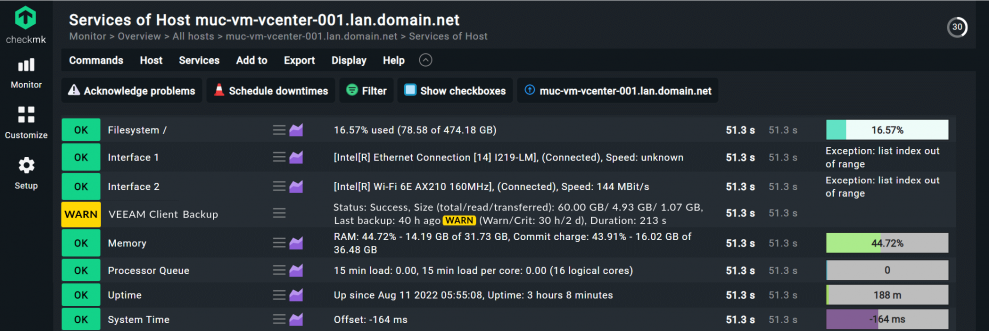
For example, the backup service now appears in my vCenter server's host view. Checkmk detects that Veeam has not made a backup for 40 hours. This is again where a consistent naming concept comes into play, because it allows Checkmk to distribute the data correctly without the need for further configuration.
Conclusion: Yes, you can monitor VMware
In this tutorial, I demonstrated how you can use Checkmk to set up a comprehensive VMware monitoring in all its facets. I also introduced you to some rules that can make your everyday life easier when monitoring your virtual environment.
However, the basis for any efficient VMware monitoring is a consistent naming concept. This is the only way to unleash the full power of Checkmk. The right naming concept not only helps you to automatically assign all relevant monitoring services, but also simplifies the configuration and management of your monitoring.
This makes implementing your VMware monitoring a breeze. This tutorial is designed to minimize the amount of long-term work you have to do with monitoring. Once you have set up the rules, Checkmk will automatically detect VMs. By using a regex in the rules, Checkmk also removes unwanted services and avoids false alerts, for example, when you shut a VM down and prepare it for deletion.
