The best for both worlds: With the all new Checkmk 2.1, we are laying the foundation for hybrid IT infrastructure monitoring at its best. It brings everything for the monitoring of traditional IT infrastructure but also of modern, cloud-native IT assets.
The new release not only takes Kubernetes monitoring to a new level, but also improves the performance of the software, especially when monitoring large infrastructures. At the same time, Checkmk becomes the powerful engine of open observability ecosystems.
Download the new version here.
In this blog you find information about:
TL;DR:
Checkmk 2.1 brings powerful hybrid IT monitoring for both traditional infrastructure and cloud-native environments.
- Kubernetes monitoring now provides deep insights into clusters, nodes, and pods, with pre-configured dashboards and smart alerts that reduce false positives.
- Performance improvements speed up configuration activation and workflow execution, even in very large environments.
- Integrations with Grafana, InfluxDB, and Datadog enable seamless visualization and data sharing across observability tools.
Finally, light in the dark
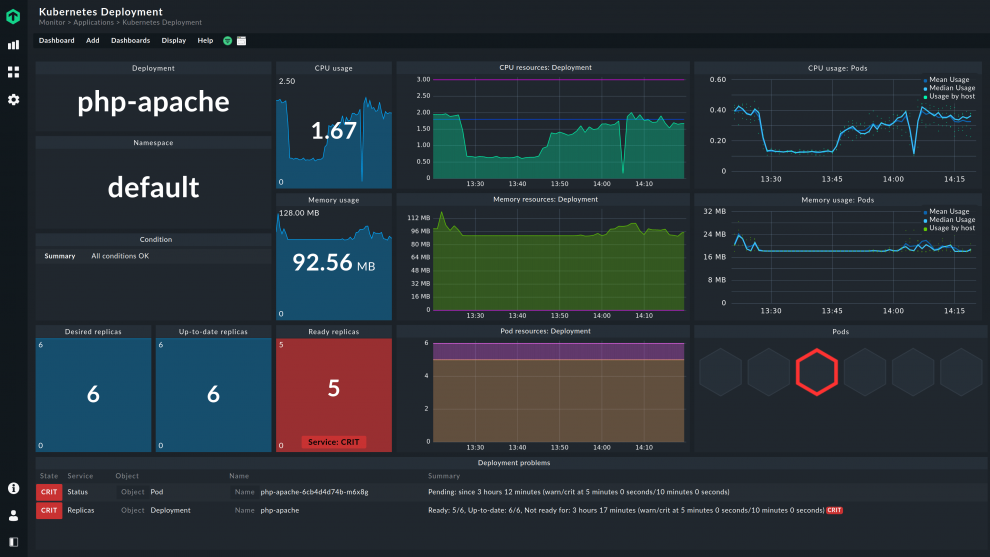
Finally, shed light on Kubernetes with our next-generation Kubernetes monitoring! With the release, we deliver deep insights into your Kubernetes clusters, including accurate alerts and easy configuration of alarms. Version 2.1 brings deep Kubernetes knowledge with it, automatically captures all Kubernetes metrics and autonomously informs users about problematic conditions. So you can take care of solving problems without having to set up a complicated monitoring. As usual, Checkmk offers a high degree of adaptability in monitoring your dynamic infrastructures.
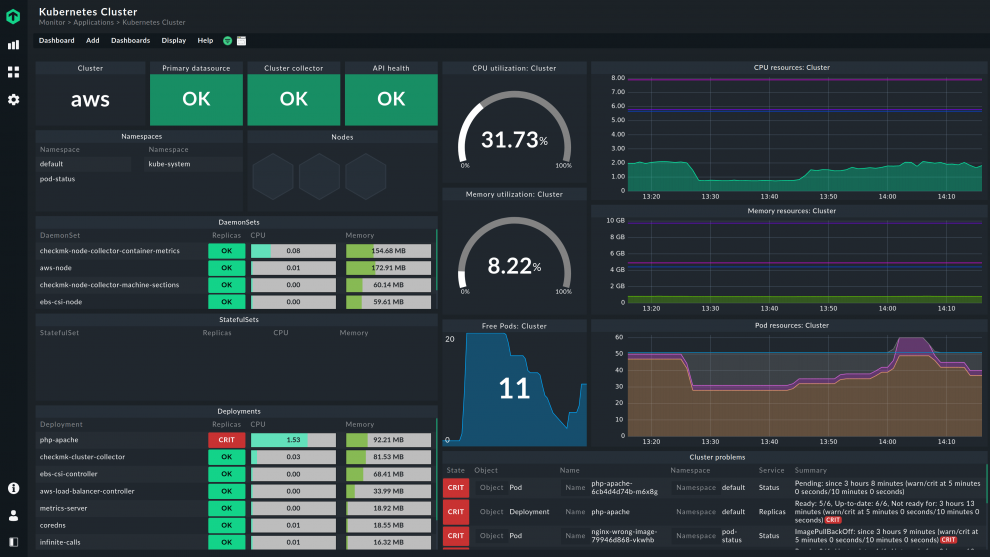
With 2.1, you get direct access to all important performance and health metrics after setup without having to write complicated queries. As a result, you'll be able to analyze the dynamic relationships in your container infrastructure after just a few minutes. Checkmk provides all important data of your Kubernetes clusters, nodes and pods via pre-configured off-the-shelf dashboards.
With just a few clicks, you can retrieve all relevant information. Seamlessly navigate through all the details – from cluster down to pod level – thanks to interconnected context-sensitive dashboards. Manage the complexity of Kubernetes thanks to Checkmk.
As a result, you can intuitively detect CPU and memory bottlenecks, identify instabilities and heavy consumers in your Kubernetes environment, even without years of Kubernetes experience. Version 2.1 allows you to monitor all objects such as Pods, Deployments, StatefulSets and DaemonSets. This gives you complete visibility into your dynamic infrastructure and immediately identifies when an application is not scaling or running properly.
Have non-critical namespaces for testing in your Kubernetes environment? No problem: Simply specify the namespaces you want to integrate into your Kubernetes monitoring with Checkmk.
Holistic Node Monitoring – The Devil is in the Details
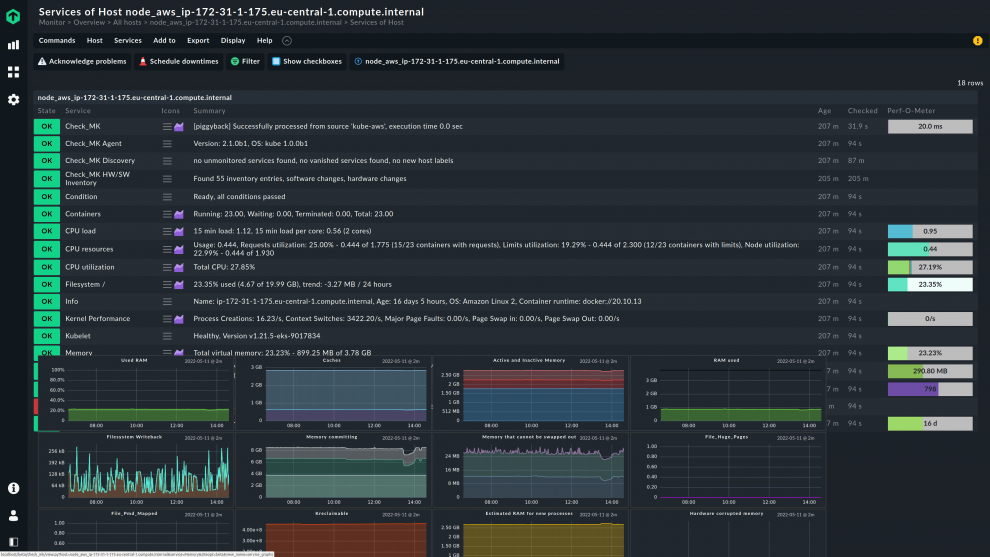
Benefit from in-depth information about your Kubernetes nodes. Checkmk obtains its monitoring data through its own agent, which is automatically rolled out to Kubernetes nodes, enabling a holistic monitoring of your nodes.
In this way, Version 2.1 enables you to not only detect Kubernetes-related issues, but also to detect issues outside of Kubernetes on your nodes, such as spawning of zombie processes or applications that inadvertently fill your file system. Without such in-depth node monitoring, such problems will remain hidden from you as Kubernetes itself will not detect them. Checkmk gives you a complete picture that includes monitoring of metrics such as CPU, memory, file systems, disk I/O, kernel performance and threads.
Reliable alerting for real problems
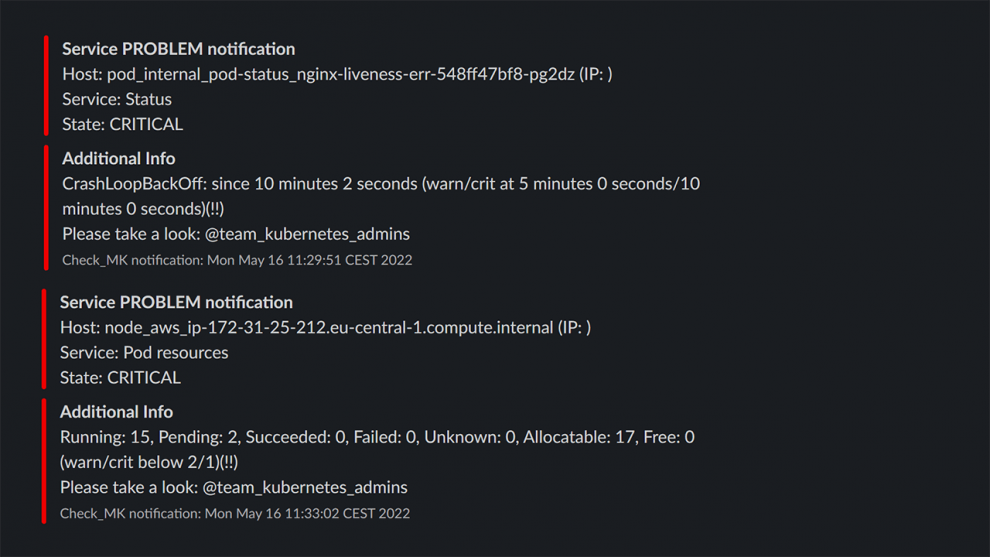
Checkmk not only provides you with all the information you need to monitor your Kubernetes clusters, but also alerts you to problems. In doing so, it provides pre-configured smart alerts that follow a specific logic.
Kubernetes can often repair itself. Version 2.1 takes this feature into account when monitoring by giving Kubernetes time to fix problems on its own. Only when it fails to do so does Checkmk sound the alarm. Thanks to this built-in Kubernetes expertise, the monitoring software avoids false alarms and only notifies you when a problem actually occurs.
Each Kubernetes object has a primary alerting mechanism, which you can also customize as you wish. For example, use labels assigned by Checkmk to customize additional notifications specifically to your needs. This gives you maximum flexibility in adding or customizing your alerts for almost any aspect of your Kubernetes cluster, such as CPU utilization alerts, threshold-related alerts, or requests.
Get to the root of causes
The new Kubernetes monitoring with Checkmk provides you with all the contextual information you need to keep your dynamic container infrastructures running smoothly. Not only does it provide deep insights into all aspects of your environment, it shows you precisely where the root cause of problems lie. For example, if a pod is not running, the monitoring shows you which container is causing the problem and with which error.
Support
Kubernetes monitoring with version 2.1 is automatically tested for the latest three Kubernetes versions, which are also officially being supported by Kubernetes itself. As of writing this are Versions 1.21 to 1.23 and Vanilla Kubernetes. It also has been successfully tested on AWS, Azure and Google Cloud Platform (GCP), Rancher, VMware Tanzu.
Increased performance for your IT monitoring
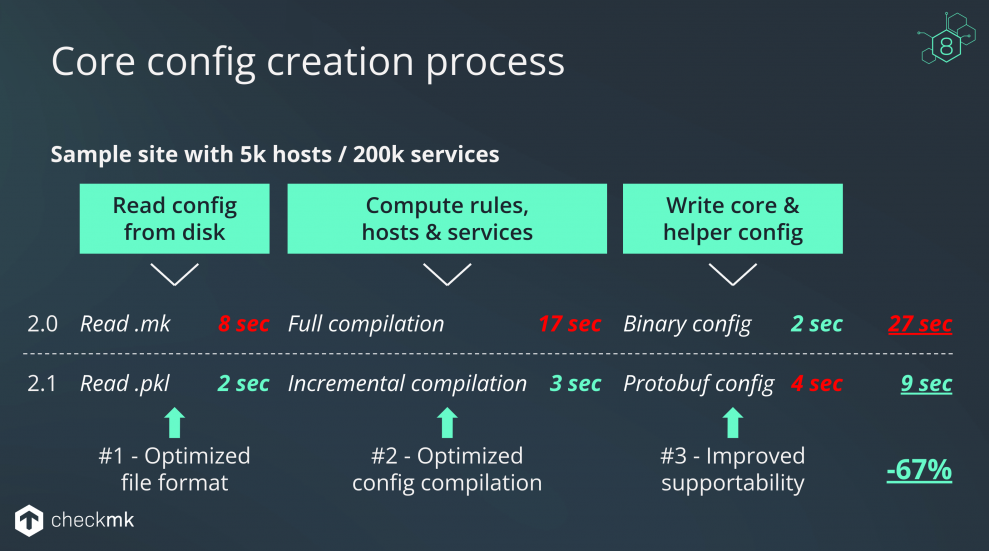
For this release, we have also made a number of adjustments to further increase the performance of Checkmk. Large IT infrastructures in particular benefit from an even faster and more powerful monitoring. Among other things, this is based on a fundamentally revised concept for activating configurations. In what are probably the most essential actions in monitoring, such as adding, changing or deleting hosts, as well as service discovery, the activation of the new configuration no longer loads the entire configuration into the monitoring core, but only the relevant changes.
This incremental activation of configuration changes speeds up the process threefold. With version 2.1, for example, in an environment with 5,000 hosts and 200,000 services, the activation of changes is reduced from 27 to 9 seconds.
Get your tasks done faster
With this release, we have also optimized other common workflows in Checkmk to reduce the workload, especially in large and very large IT infrastructure. These include improved folder navigation, which, for example, reduces the loading of folders in an environment with 9,000 folders from 3 to 4 seconds to 0.02 seconds. At the same time, we have significantly accelerated the setup and configuration of hosts.
Fire up the engine of your open observability ecosystem
Checkmk 2.1 is better than ever at enhancing the capabilities of monitoring stacks. By expanding its integration capabilities, the software can provide monitoring data to other monitoring tools while importing it from other solutions. With version 2.1, you get one machine with infinite connections. This enables you to accurately determine the health of any system in your IT infrastructure at any time – regardless of whether it is on-premises or in the cloud.
Grafana integration
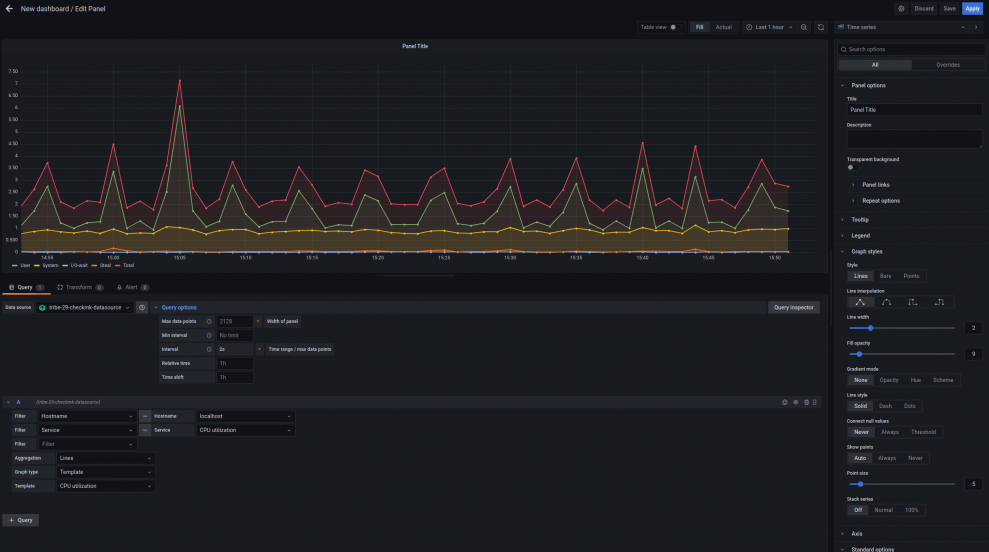
The reworked Grafana connector now allows you to display data and time series much quicker in the Grafana graphing system. Benefit from easy setup without complicated options and additional security features. The new architecture also provides a better user experience with intuitive filtering options familiar from Checkmk workflows. This allows you to focus on the data you really need. In addition, we have improved the query configuration.
InfluxDB Connector
The new InfluxDB connector in Checkmk 2.1 allows you to export metrics to InfluxDB 2.0 to make the data available to other users or tools. In this way, you reduce complexity by converting data from different data sources into a common, open data structure. Checkmk is thus not only able to efficiently collect information, but also to make it available to other solutions.
The new version also offers an improved configuration overview of InfluxDB connections, which enables the use of different databases. You can also add rules for services and send the status of services as metrics. At the same time, you retain full control over metrics thanks to proven concepts for managing them. At the same time, version 2.1 gives you the opportunity to enrich your metrics with additional information.
Datadog integration
Eliminate the need to pull monitoring data twice from your hosts by integrating data from other tools, such as Datadog, into Checkmk. If your DevOps team uses Datadog to monitor an application, the IT Ops team can now pull monitors and events from Datadog into Checkmk. This way, IT Ops can leverage its complex alerting to address issues in the underlying infrastructure that the DevOps team cannot resolve due to lack of monitoring depth. Events flow natively into the Event Console and can be processed according to the well-known Event Console functions. In addition, you can include alert definitions from Datadog as a service in Checkmk.
More powerful visualization for your data
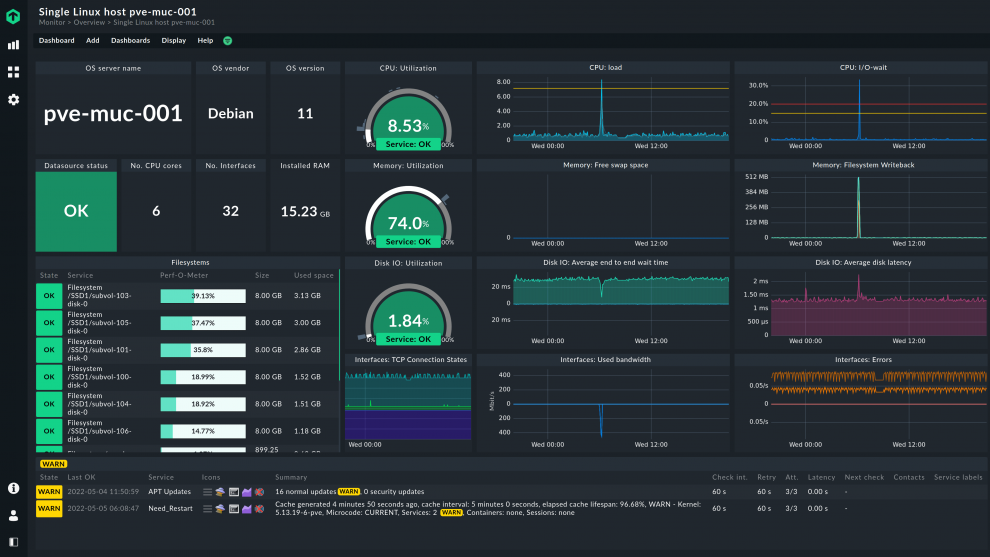
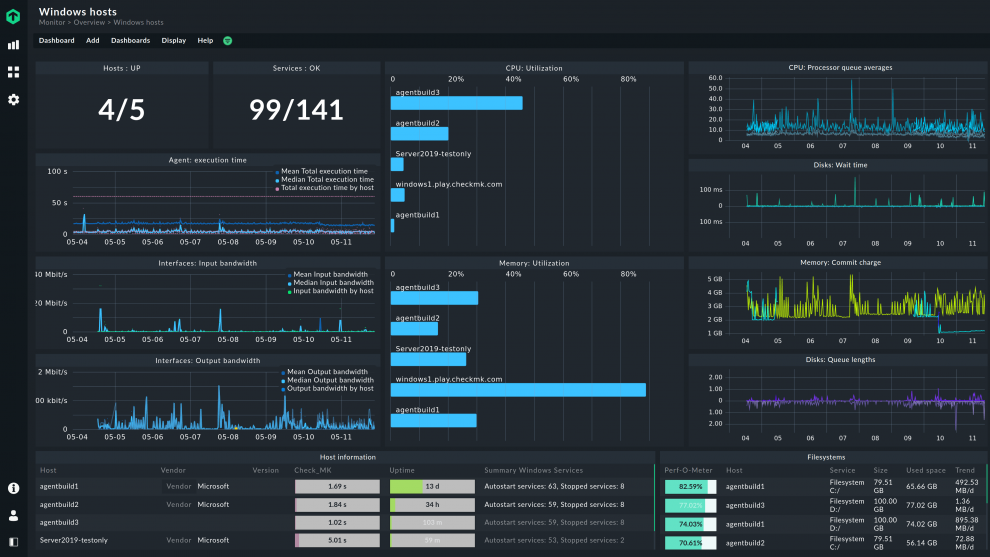
To enable you to put your monitoring data in the appropriate context, we have further expanded the visualization options for your data with this release. Version 2.1 features more dashlets and predefined dashboards. For example, with the intuitive dashboards for Linux and Windows monitoring, you get a dashboard out-of-the-box with all the important data and metrics of your Linux and Windows servers. Whether for a single host or multiple hosts: With the preconfigured dashboards, Checkmk puts relevant metrics in context. This gives you all the data you need in one overview to quickly get to the root cause of spikes.
In addition, with 2.1 there are new dashlets for the display of:
- Host State,
- Service State,
- Host State Summary,
- Service State Summary and
- Inventory data.
Safer than ever. Easy and clever.
With this release, we are not only providing a security upgrade to the Checkmk agent, but also strengthening the security of the software itself. Thanks to the new architecture of Checkmk, the agents for Linux and Windows from version 2.1 will use an TLS encryption by default, which is easy to set up and thus more convenient than home-made solutions for TLS encryption. Watch our video tutorial to learn more about the new agent architecture.
In addition, we are expanding the login options: The now available two-factor authentication via FIDO2/WebAuthn will provide more security. Furthermore, it is now possible to use authentications such as YubiKey, a USB token, a smartphone or Apple's Touch ID or Windows Hello. Version 2.1 also comes with improved login password hashing as well as enhanced logging of failed logins.
You can now also log in to Checkmk using SAML. Version 2.1 officially supports identity providers such as AD Federation Service, Azure AD and NetIQ Access Manager. At the same time, the new release gives you flexibility to integrate with most identity providers that support SAML.
We also made it easier to set up secure communications for the notification spooler (mknotifyd) by supporting Checkmk 2.1 native encryption out of the box. This means that all communication channels between monitoring sites will be encrypted in the future.
One more thing. Is not enough
The release also includes many smaller improvements. For example, we have extended the functionality of the REST API introduced with version 2.0. This will soon now cover all the functions of the old legacy web API, such as ruleset handling. With this, 2.1 closes this gap and thus improves the performance and usability of the REST API. While the old legacy web API will still work with all 2.1 releases, it will be removed starting with Checkmk 2.2. Therefore, we recommend that you use the transition period to migrate your scripts to the new REST API, and address any potential migration issues ahead of time.
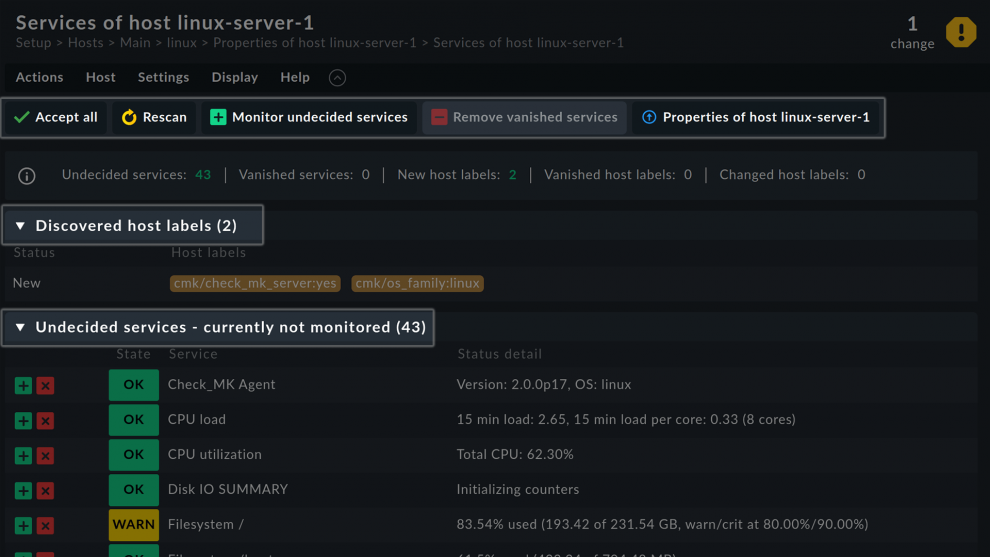
With the new release, we are also introducing other small changes to the UX in Checkmk. This includes refinements to discovery, rule configuration, setup search, among others.
More information about the release and its new functions can be found on our latest version page. If you need help to update your Checkmk to Version 2.1 check out this article in our manual.
