Note: The content on this page uses the former names of Checkmk editions. Checkmk Enterprise is now Checkmk Pro, Checkmk Raw is now Checkmk Community.
After having spoken about the current status of Checkmk 2.0 on the first day of Checkmk Conference #7, the second day of the event focused on the future development of Checkmk. During the conference presentations, attendees traditionally had the opportunity to influence the development of Checkmk by voting on potential changes, features, enhancements, etc.
The second day's presentation program was kicked off by Simon Meggle from Elabit and Jens Dunkelberg from Abraxas Informatik AG, who in their tech session explained end-to-end monitoring with Checkmk using the Robotmk plug-in. Simon developed Robotmk as a bridge between Robot Framework and Checkmk. This enables the integration of results from Robot Framework, an open source-based tool for automated testing of applications, into Checkmk. By this means, Robotmk extends Checkmk's IT monitoring with end-to-end monitoring, i.e. monitoring of the user experience when interacting with the IT infrastructure.
According to Simon, Checkmk is ideal for monitoring IT infrastructure and thus ensuring that applications running on it, such as a web store, also function smoothly. However, Checkmk cannot monitor how the user engages with the web store. This can be done by the open-source tool Robot Framework with its automated tests. Simon explained how the integration of Robot Framework into Checkmk now makes it possible to monitor the user's view in Checkmk as well.
Abraxas Informatik AG already uses the Robotmk plug-in for end-to-end monitoring of Swiss government applications. Jens told the participants how Robotmk works in practice and what capabilities it can provide.
In the tech session, Simon also gave a more detailed description of the plug-in's functionalities, such as extracting metrics so that Checkmk can show the performance of an application. Since the Robot Framework only outputs whether a test succeeded or failed, but not the status and performance of the application, this is a useful extension.
The UX will be further optimized
In the first presentation of the day on the Main Stage, tribe29 founder Mathias Kettner presented the upcoming changes planned for Checkmk's user interface. With the launch of version 2.0, Checkmk has received a completely-redesigned user interface and navigation. The development team is currently working on further improvements to the new UX.

The four new dashboard elements introduced with Checkmk 2.0 are to be complemented by four additional dashlets included in the upcoming feature pack. Among other things, these will display whether a host or service status is OK, WARN or CRIT, or how many hosts or services are OK, WARN or CRIT. Also planned are an event statistics hexagon and an inventory dashlet that displays information from the inventory, for example, the number of available CPU cores.
The participants could vote on a doughnut element as an alternative to the gauge dashlet, or a time range as a bar chart with a drill-down function. Mathias also presented possible extensions to the host hexagon, for example for clustering, or embedding a map in the dashboard.
Other plans for the further development of the UX include the implementation of application-specific dashboards, such as for Linux and Windows servers or vSphere environments, explained Mathias. The dashboards should contain the most important metrics out-of-the-box and thus provide a useful overview.
Other possible innovations presented by Mathias are optional mini-dashboards embedded in the host view. These are intended to provide useful additional information on the respective host. The idea that Checkmk users can share their own dashboards as MKP files via the Exchange was also well-received by the participants. The audience also responded positively to the concept of sharing dashboards via a URL, for example for display on a wallscreen.
Alongside the improvement of the dashboarding in Checkmk the use of individual pages in Checkmk is also to be improved. This includes first of all a clearer structuring of the most frequently-used pages as well as the simplification of the associated workflows. One option Mathias showed, for example, is pop-up windows with suggestions for actions.
Clicking the Activate Changes button then generates a pop-up, for example, that shows where which changes are being made. Furthermore, a pop-up has the advantage that the changes can be activated without having to leave the current page. Another consideration is that Checkmk then suggests any subsequent steps, such as switching to the host view. Another way to simplify workflows would be for Checkmk to check which protocols or agents are running on the system after entering the IP or DNS when adding a host, and then suggest a default configuration for the host.
Another topic Mathias addressed in his presentation was an overhaul of the folder structure. With a new folder management, especially the overview in large environments with many folders should become better. One consideration, for example, is the display of folders in a table view. By clicking on a folder, you could then see which subfolders and/or hosts it contains and which attributes and rules apply to the folder. The plans for the new folder management met great approval among the participants.
Monitoring from the cloud with Checkmk
Another major item on the agenda for the further development of Checkmk is the expansion of the existing hybrid cloud monitoring. In his presentation, Thomas Lippert, Product Manager at tribe29, outlined the four areas that are currently in focus. These are improving the cloud-native experience by making it easier to set up Checkmk in the cloud, and simplifying configuration so that on-premises assets can be monitored more easily from the cloud. It also includes better handling of dynamic workloads and expanding the number of cloud services that can be monitored by Checkmk, according to Thomas.
In the future, it will be possible to obtain Checkmk via the AWS Marketplace and later also directly in Microsoft Azure. The Checkmk image can be set up as an EC2 instance in the cloud in a matter of minutes. Licensing for AWS can be done via bring-your-own-license or via platform licensing. The monitoring instance is also already preconfigured for secure cloud use, Thomas emphasized.

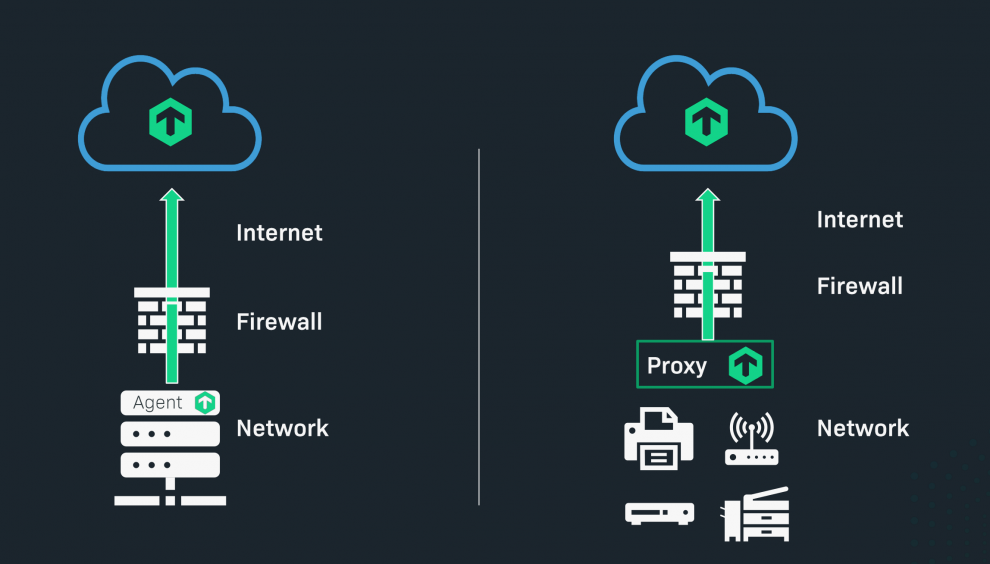
Once configured, Checkmk should make it possible to monitor both cloud and on-premises assets from the cloud. However, this requires us to change the direction in which the agent transmits the data, Thomas explained. The 'Push Agent' developed for this purpose will collect the monitoring data and then transmit it to the monitoring server to avoid firewall issues. The transfer of data to the cloud is encrypted via TLS. Checkmk also compresses the data to minimize the cost of data transfer in the cloud. For more data economy, the standard rate for the 'data push' is also to be reduced.
For on-premises devices – such as SNMP devices – on which no agent installation is possible, the introduction of a local SNMP proxy in the network environment is planned. This 'Checkmk Light' proxy takes over the active monitoring of the SNMP components, including the processing of SNMP traps. The SNMP proxy then transmits its aggregated results to the cloud.
To monitor dynamic workloads in the cloud, these should be able to register themselves with Checkmk, which then automatically adds them to the monitoring. Based on the configuration, labels and application rules, Checkmk assigns these hosts to a folder and applies the rules set on the folders. The services on the host will be detected automatically.
In addition, the monitoring of cloud services will also be further expanded. For AWS, this may include AuroraDB, DocumentDB, SQS and Lambda. Participants also voted for the option to be able to monitor AWS ECS, AWS Health or AWS Route 52 with Checkmk.
For Azure, monitoring is to be extended to the Database for PostgreSQL/MySQL, CosmosDB, Service Bus and Load Balancer services. The conference participants also requested monitoring for the Service Health and Traffic Manager services.
Integrations, automation and security for the hybrid IT world
Everyday life in organizations with large IT infrastructures is now predominantly determined by dynamic and extensive workloads. To cope with these demands, they are increasingly dependent on IT automation. This is often made more difficult, however, by the wide variety of tools used – whether for general monitoring, for example with Checkmk, or special tools for applications, clusters or Kubernetes. At the same time, the security incidents that have attracted media attention have raised awareness of IT security and product security in companies, as Lars Michelsen, Head of Development at tribe29, explained in his presentation 'Integrations, Automation and Security'.

Lars further explained that this is the reason why tribe29 will continue to focus on the integration of observability tools and enterprise IT, on the automation of monitoring and on product safety in the further development of Checkmk.
According to Lars, there are two options for integrating other tools: Exporting monitoring data to another tool, as Checkmk already does with Grafana, for example, or integrating data from other tools into Checkmk, as is planned with the new interface to DataDog. Checkmk already integrates data from tools such as ntop, Prometheus, Grafana or InfluxDB. For Checkmk 2.1, the roadmap includes the revision of existing integrations, such as for Grafana or InfluxDB, but also the creation of new interfaces.
Grafana: The Grafana integration is to be modernized and adapted to the new Grafana API. In addition, the data source plug-in will be available in the Grafana store in the future to simplify its installation. The new functions include authentication by the Grafana server, annotations and possibly the transmission of variables.
InfluxDB: It is planned that with the new Checkmk version it will be possible to extend the export of trusted metrics to InfluxDB. Checkmk currently still uses the old UDP-based Carbon connection for this purpose. However, the data export will be switched to InfluxDB's native API in the future in order to be able to use HTTP(S) for the transfer. According to Lars, this will also make it capable of transmitting additional metadata such as thresholds, statuses, labels or tags. It should also be possible to configure via rules the metrics one wants to export to InfluxDB. It would then also be feasible to extend this principle to similar systems such as Splunk or Elastic.
DataDog: The newly-created interface to DataDog is intended to enable organizations that also use DataDog in addition to Checkmk to integrate monitoring data from DataDog, such as statuses and events, and then manage these as usual in Checkmk, for example, to receive alarms and notifications. Here, too, it should be possible to specify which data Checkmk should integrate from DataDog in order to have only the relevant data available in Checkmk.
With regard to further automation of the monitoring with Checkmk, our developers are currently working on the goal of mapping a complete deployment and configuration cycle with Checkmk. It should be possible to set up Checkmk monitoring automatically to a certain extent, while fine-tuning will still be handled manually. According to Lars, the new REST API introduced with version 2.0 plays a major role in the processes after the instance has been set up. Currently, rule sets are not yet mapped in the API, but this should be possible from version 2.1. In addition, the automatic connection of remote sites is also planned. Lars added that the addition of an abstraction layer to the REST API is also on the roadmap. This should make it easier to add additional APIs to the REST API, for example to make API calls to perform certain actions, such as creating a host or executing certain functions.
For more security, encryption of the data transmitted by the agents is planned. Thus, the projected Push Agent will use TLS encryption by default. The currently optional symmetrical encryption of the Pull Agents will run over TLS as standard from 2.1. According to Lars, however, introducing security features is always a balancing act between security and usability. The goal, however, is to keep Checkmk's effort and complexity simple despite increased security, he explained. Users of Checkmk Enterprise, for example, should use the Agent Bakery for deployment and only need to configure an additional Bakery plug-in. The manual effort for users of Checkmk Raw will, however, increase slightly due to these new security features.
Since many organizations use central authentication solutions such as SSO or 2FA, we want to make these available for Checkmk as well. With 2.0, for example, Checkmk is already prepared for the use of SAML, a connection to Azure AD could be another example for the connection of such central solutions.
Kubernetes monitoring – seeing through the data jungle
One topic that has always played a role at the conferences over the past few years was one that we could not avoid at this year's conference: Kubernetes monitoring. As Martin Hirschvogel from tribe29 pointed out in his presentation, this is primarily due to the growing use of containers in production environments. These containers are mostly orchestrated via Kubernetes. This development means that the requirements for monitoring IT infrastructures are simultaneously increasing. After all, in addition to the classic IT components, the growing number of containers, clusters, pods, etc. must also be monitored.
Since 2018, Checkmk can monitor Kubernetes via the Kubernetes API. This has the advantage that monitoring is easy to set up and you can already get a good insight into the health of your clusters with the data available via the API and with the information provided via the agent with Checkmk. The Prometheus integration also added another option for monitoring pods and containers. Especially companies that already use Prometheus for their Kubernetes monitoring can reduce the workload on the monitored hosts by avoiding two monitoring tools pulling the same monitoring data. Both options will be further expanded and optimized by the Checkmk developers.
According to Martin, it is precisely the great complexity of Kubernetes that makes it difficult for administrators to know which information is relevant to them, given the abundance of data. As a result, there is a risk that the data overload will quickly overwhelm users. However, one of Checkmk's strengths has been to always provide the most relevant information from the abundance of data.
To simplify Kubernetes monitoring, the first step is to make it easier to configure and install Checkmk. For this purpose, tribe29 makes all Checkmk editions available in the Docker registry. In addition, predefined manifests and helm charts are to enable one-click deployment and updating. Checkmk Enterprise and Checkmk Trial are already available in the registry.
Preparing the Kubernetes cluster for monitoring should also become easier. This is to be made possible on the one hand with a new agent for Kubernetes as well as via a rollout with predefined manifests and helm charts. Among other things, guided workflows including a preconfigured, dynamic setup with folders are planned for easy configuration. Robust naming for all objects and consistent labels for filters, visualization and alarms are also on the agenda.
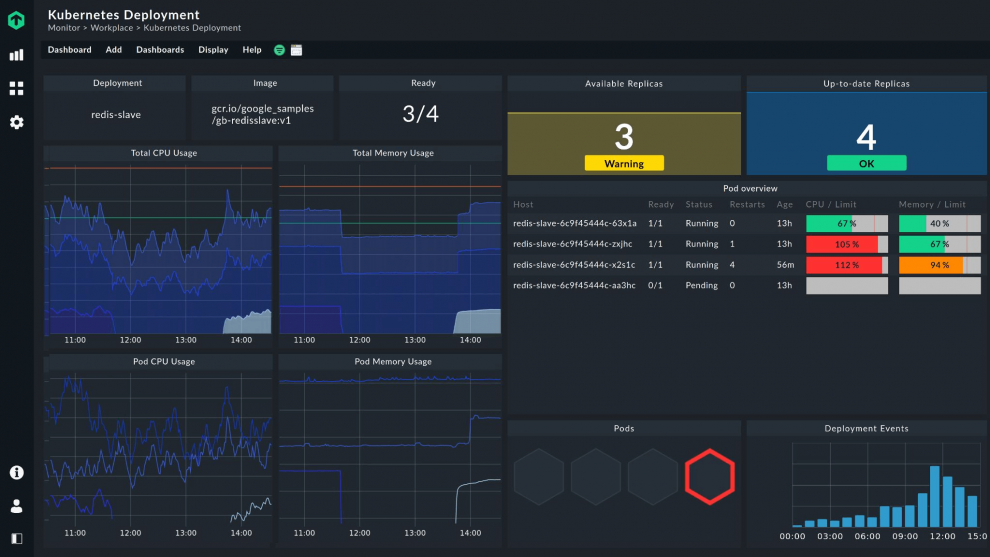
The monitoring itself should ultimately be straightforward even for non-Kubernetes professionals. The new Kubernetes agent should provide users with an immediate overview of the health and performance of their clusters and their components. Debugging of problems is then possible via drill-downs, for example. Predefined dashboards are intended to help users monitor different aspects and different requirements in the Kubernetes environment, such as the cluster, network or application infrastructure. Furthermore, each of these predefined dashboards should include all important data for the respective use case, so that even inexperienced users can immediately get a good overview of the state of their Kubernetes monitoring.
In the future there will be a pod with a K8s agent on each worker node that collects the data for Kubernetes monitoring with Checkmk. An additional agent on the cluster is responsible for structuring this data and then acting as a gateway to the Checkmk server.
The roadmap for 2.1 and 2.2
At the end of the second and final day of the conference, Thomas and Lars once again summarized all of the planned changes and explained which features are expected to be available in Checkmk 2.1 and 2.2. The new product version 2.1 is currently scheduled for release at the end of 2021. Before that, however, there will be a feature pack available for version 2.0.
Among other developments, Checkmk 2.1 is to be made available as an Amazon Machine Image and possibly also as a standardized image for Azure. In this way, we want to simplify the in-cloud monitoring of cloud assets, as Thomas explained. Part of the release should also be the new Push Agent for Linux and Windows platforms. Whether support for monitoring dynamically created workloads will already be possible with version 2.1 is not yet foreseeable. In addition, cloud monitoring will be extended to other Azure and AWS services with the next release. In doing so, we will also take into account the feedback from the participants at this year's conference, Thomas affirmed.
The extension of the Push Agent to other platforms is planned for Checkmk 2.2. The on-premises proxy, which collects SNMP data in an environment and transmits it to the cloud, for example, will then also be part of Checkmk.
Regarding Kubernetes monitoring, a dedicated Kubernetes agent is planned for version 2.1, which will collect the monitoring data in the Kubernetes environment and aggregate it in a meaningful way. A cluster dashboard is also planned to provide an overview of all important metrics. With version 2.1, Checkmk will initially support Vanilla Kubernetes, but other distributions such as EKS or OpenShift are to be added in the future.
More standard dashboards are planned for 2.2, such as ones dedicated to deployment or to a node. In addition, a revision of the Prometheus integration is planned so that Prometheus transmits the same data as the Kubernetes agent to Checkmk. This way, users should be free to choose their data source, but receive the same result in the end. Other topics on the roadmap also include event monitoring and automatic setup of a Kubernetes monitoring.
For dashboarding, new visualization options will be available with version 2.1, such as host and service status, inventory data, etc. In addition, application-specific dashboards for Linux, Windows and vSphere are planned, as well as improvements to the functionality of context-sensitive dashboards.
In principle, Checkmk 2.1 should also further improve the user interface. This means that the most frequently-used pages will become clearer and easier to understand. At the same time, we want to revise the workflows, for example, those for activating changes.
The previously-mentioned changes to the integrations have already been scheduled for version 2.1. This includes the new DataDog interface for importing data into Checkmk, the revision of the Grafana integration, which will be adapted to the new API, and the native InfluxDB integration.
We additionally want to offer Checkmk in more languages. The first language packages are already available in the Exchange. The initial translated version has been machine-assisted. For the final version, however, we are also inviting collaboration from within the community.
In the second part of the roadmap presentation, Lars went into ideas and possible directions for Checkmk development in the longer-term. Here as well conference participants had the opportunity to vote on their preferred direction. The four main topics here were the extension of application monitoring, log management, detection of dependencies and correlations, and E2E monitoring with Robotmk.
You can watch the presentations of the Checkmk Conference #7 on our YouTube channel. The slides can be found on our conference archive.

