Seven check plug-ins for Linux server monitoring
 on Jun 3, 2019
Note: The content on this page uses the former names of Checkmk editions. Checkmk Enterprise is now Checkmk Pro, Checkmk Raw is now Checkmk Community and Checkmk Cloud (self-hosted) is now Checkmk Ultimate.
Linux is really popular on servers – the Open Source operating system has a reputation for being stable and reliable. Still, if you're a sysadmin and looking after one or more Linux servers, you probably want to monitor your machines' health and performance (and receive alerts when necessary).
Checkmk supports various Linux distributions. The server component is available as installation package (.deb and .rpm), as virtual appliance, and as a Docker container. The Linux version of the Checkmk agent is also easy to install: It's a simple shell script (/usr/bin/check_mk_agent) that invokes various other commands (like df, mount, ps, etc.) to collect data about the file system, the CPU, network devices, etc.
It is also possible to extend the agent's functionality with plug-ins. In this blog post, we are going to introduce seven Checkmk plug-ins that come in handy when monitoring Linux servers.
TL;DR:
The article explains how to monitor Linux servers with Checkmk and which additional agent plugins are especially useful.
- Checkmk can be easily installed on Linux servers (as a package, appliance, or Docker; the agent is a simple shell script).
- The agent automatically collects system data such as CPU, memory, filesystems, and processes.
- In addition, the article presents seven particularly useful Checkmk plugins to further extend Linux server monitoring.
Plug-ins at your service
Checkmk plug-ins are small scripts or programs invoked by the agent to collect additional data about the monitored machine(s). There are two types of plug-ins:
- Check plug-ins
- Agent plug-ins
About 2,000 check plug-ins are shipped with Checkmk, i.e. they're on the server. In addition to the check plug-ins, approximately 100 agent plug-ins exist. They need to be installed on the monitored system. Most plug-ins mentioned in this blog post are agent plug-ins. Some of them require a configuration (in/etc/check_mk) to function correctly, others work out of the box. Please have a look at the documentation of the plug-ins or check the source code to find out more about their configuration options.
If you're using Checkmk Raw, you can install the plug-ins by copying them to the plug-ins directory of the Linux agent (/usr/lib/check_mk_agent/plugins); please remember to make the files executable (chmod +x). Since some of the plug-ins have a very long runtime and don't need to be refreshed every minute, you can store them in subdirectories named after a number of seconds to execute them asynchronously.
Customers of Checkmk Enterprise or Checkmk Cloud (self-hosted) can use the agent bakery to install the plug-ins and generate the configuration file(s) automatically.
To find and download the agent plug-ins in Checkmk Raw and how to automatically roll out plug-ins using one of the commercial Checkmk editions via Agent Bakery, please refer to our manual.
And here are our top 7 plug-ins for monitoring Linux servers with Checkmk.
1. Package Management
Your Linux distributor regularly publishes software updates and patches to fix bugs and security vulnerabilities. It's important to install the updated packages to keep your operating system(s) secure. Instead of manually checking every server for upgrades, you can use Checkmk to monitor the package management system of your distribution.
If you're running Debian-based servers, you can use the mk_apt plug-in to monitor the APT package manager. The plug-in mk_zypper checks for available updates via zypper on SUSE Linux Enterprise Server and openSUSE systems, and if you're a yum user on Red-Hat-based sytems, check out this plug-in.

All three plug-ins reach the warning state for regular package updates and critical for security updates.
Tip: It's a good idea to install the plug-ins with asynchronous execution; it's not really necessary to check for updates more than once every day.
2. Inventory
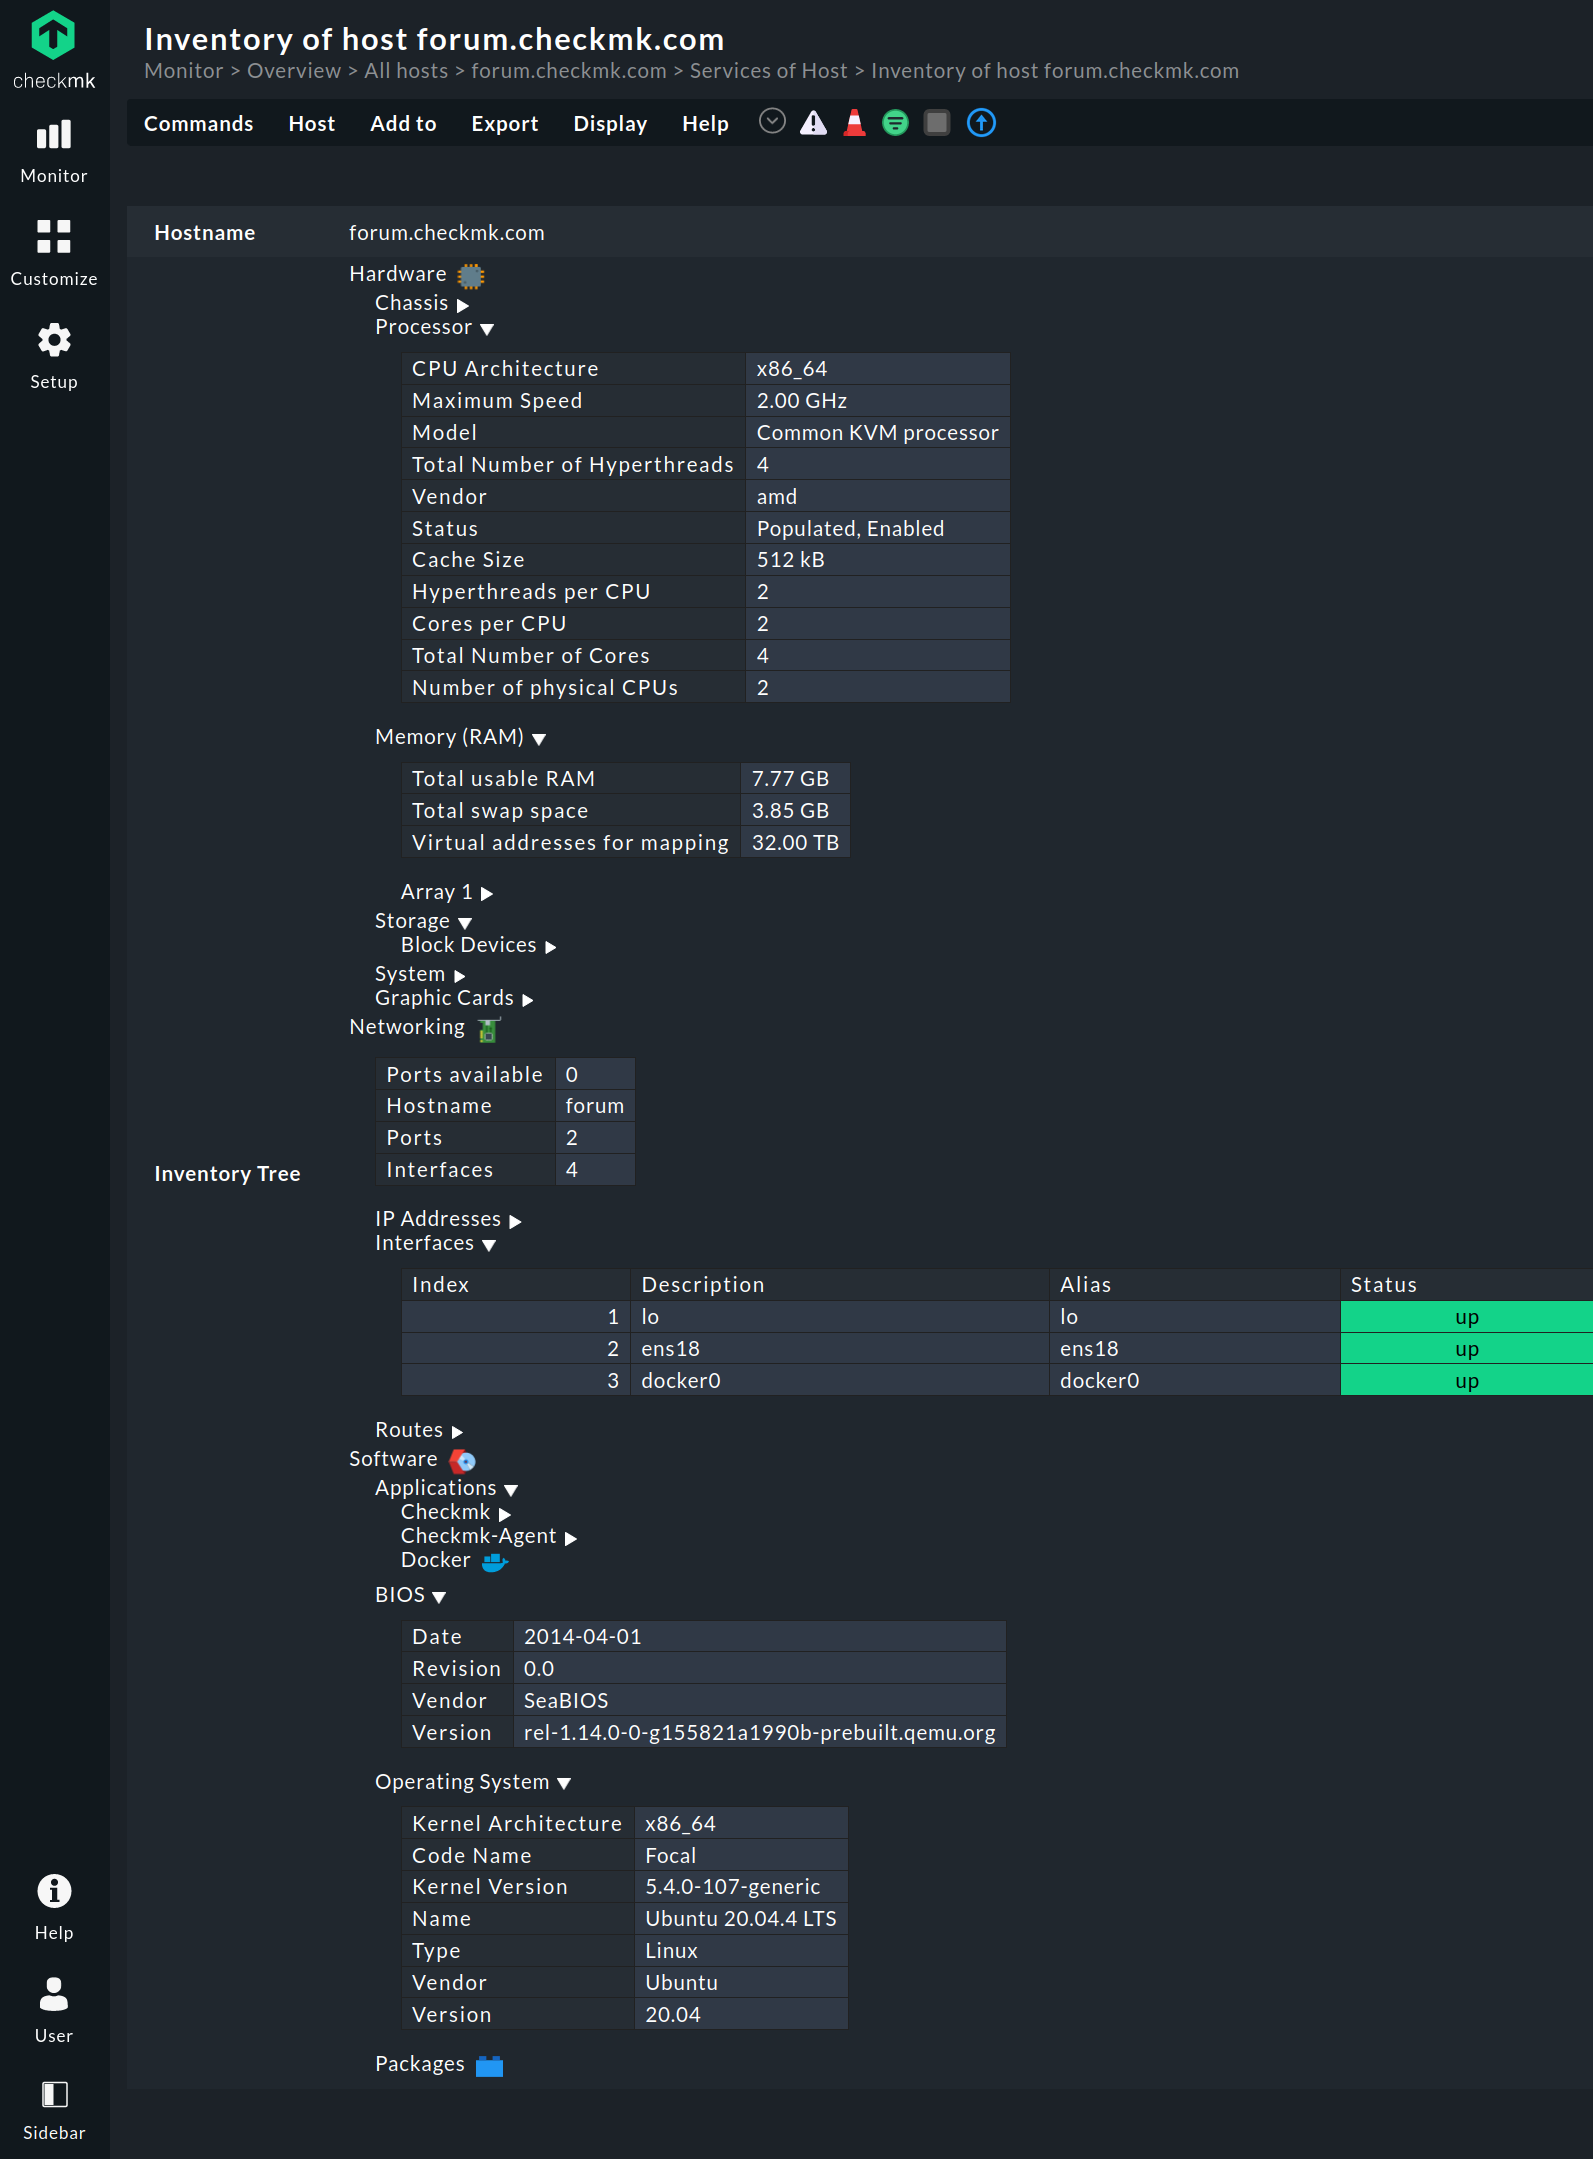
The Checkmk HW/SW inventory system collects information about hardware and installed software of your hosts. The plug-in mk_inventory can not only report about existing hardware/software in your Linux server ("How much RAM/swap space does the machine have?", "How many CPUs and cores?", "Which of my servers have a certain package installed", etc.), but also check for changes.
Simply install mk_inventory.linux on your Linux server(s). In Checkmk Enterprise or Checkmk Cloud (self-hosted) you can deploy the agent plug-in with the rule Hardware/Software-Inventory (Linux, Windows, Solaris, AIX) under Setup.
Afterwards, enable the inventory check with the rule set Do hardware/software inventory under Setup. For each selected host, you will see a new check called Checkmk HW/SW Inventory. You can view the results via Show Hardware/Software inventory of this host, browse the tree structure, add the inventory data as custom view or export it to other formats. On top of that, you can set the parameters for this check, so you get warned about changes.
3. Number of logged-in users
If you'd like to monitor the number of users who are currently logged in, you can install the plug-in mk_logins. It combines the two commands "who" and "wc -l" to receive information about logged-in users. In Checkmk Enterprise or Checkmk Cloud (self-hosted), you can deploy the agent plug-in with the rule Number of logged-in users (Linux) under Setup.
The default configuration gives out a warning if the number exceeds 20, and it reaches the critical level if the number is 30 or more. You can adjust the rule and redefine numbers as you see fit. For example, set the threshold to 1 for servers where normally nobody logs in. Also, it's possible to configure time periods and specify different warn/crit levels.
Tip: On one of my servers, I've modified the plug-in so that it excludes my own IP address of the dial-up connection by adding a simple grep command:
#!/bin/bash

[...]

if type who >/dev/null; then

    echo "<<<logins>>>"

    who | grep -v 203.0.113.0 | wc -l

fi
4. SSH Daemon
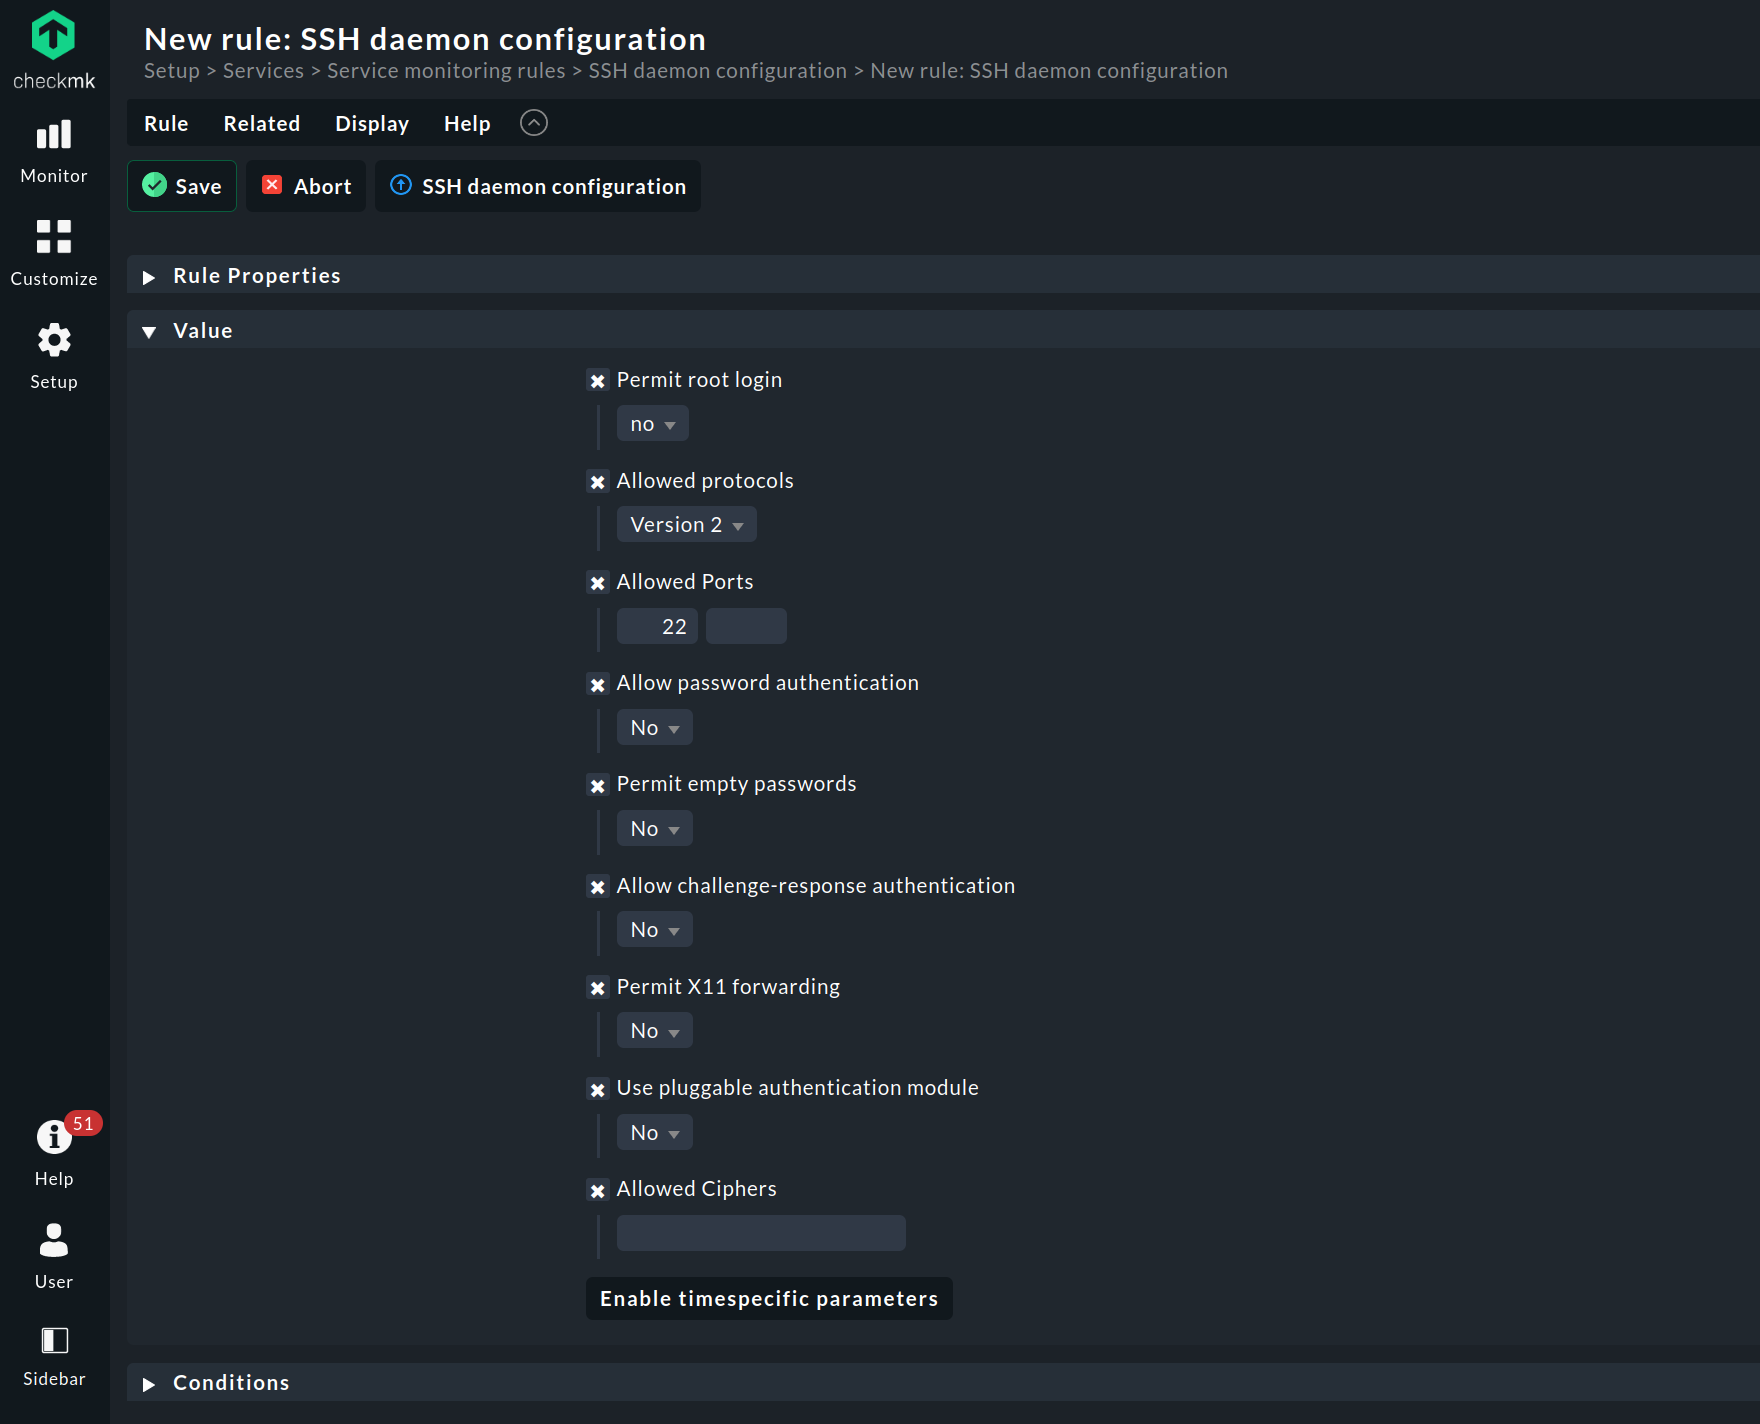
Maybe you have disabled root login, changed the default SSH port from 22 to something else, or switched on the public/private keys authentication for your SSH server. If that's the case, and you'd like to monitor your /etc/ssh/sshd_config, then you can install the mk_sshd_config plug-in. The agent rule to deploy the agent plug-in with Checkmk Enterprise or Checkmk Cloud can be found and configured under Setup -> SSH daemon configuration (Linux). The plug-in watches security relevant parameters of the SSH daemon configuration and alerts you in case one or more options have been changed. You can change most parameters by configuring the rule SSH daemon configuration.
If your SSH server doesn't use /etc/ssh/sshd_config but a different config file, simply modify the plug-in in your favourite text editor and change the SSHD_CONFIG variable.
Whatever your configuration is, do check if the firewall is open to allow connections to the SSH port (by default 22, but it is advisable to change it). Run on the host to be monitored:
iptables -nvL
and if you notice dropped packets in the INPUT chain on the SSH port, it needs to be opened with:
iptables -I INPUT 1 -p tcp --dport 22 -j ACCEPT
With ufw, it is just a matter of running
ufw allow 22/tcp
Or, if you are using firewalld:
firewall-cmd --permanent --add-port=22/tcp
Checkmk can check for a misconfigured firewall, iptables or one of its modern frontends like ufw and firewalld, with the mk_iptables agent plug-in.
5. MySQL Databases
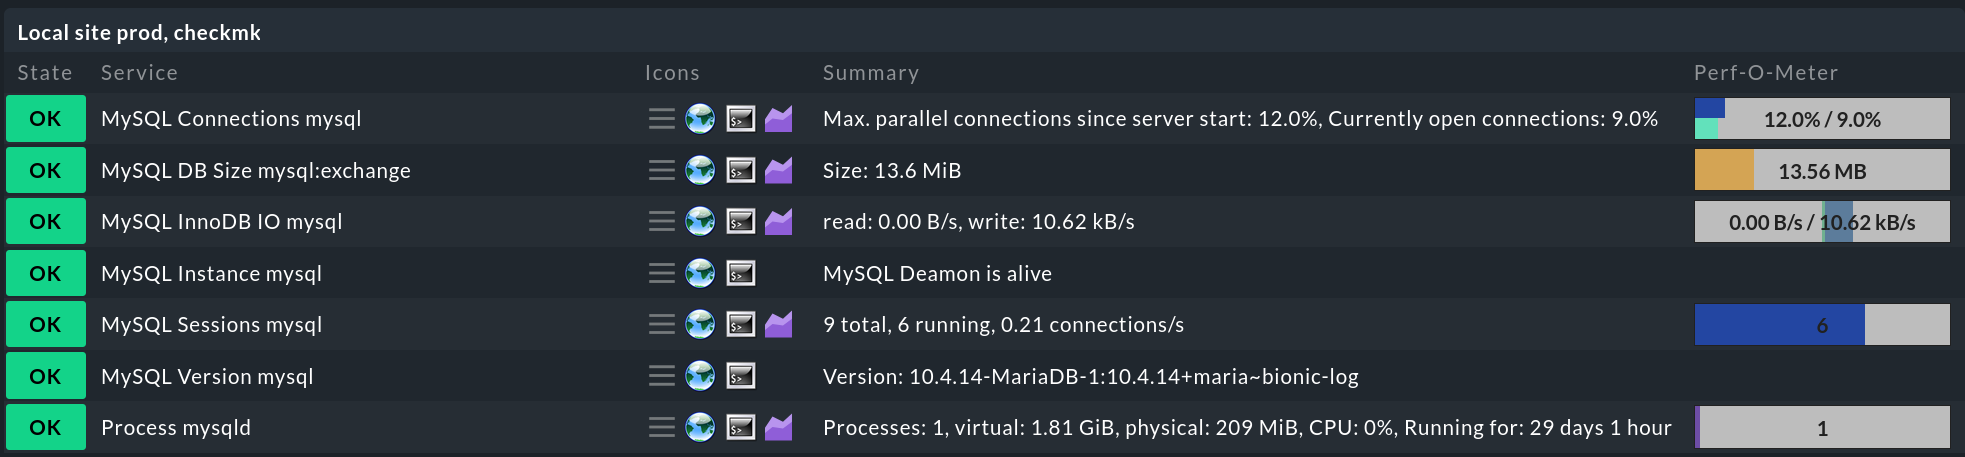
Databases are part of our modern IT lives and a vital component of many services. Whether there’s a dedicated database server or not, making sure that the database is up and running is one of the tasks of any system administrator, even if you are not a database administrator. To keep an eye on the database status, the number of current open sessions, or the IO statistics, Checkmk is here to help. The agent plug-in mk_mysql is all you need to get the basic info about your databases. If more specific data is desired, further plug-ins work on the data given by mk_mysql:
mysql_sessionsto check MySQL sessions (both active and inactive).mysql_connectionsto keep track of the database connections.mysql_slaveto monitor the sync state of MySQL primary databases.mysql_pingto simply check if the MySQL daemon is alive and accepting connections.mysql_innodb_ioto check the IO rate of the InnoDB engine.mysql_versionto figure out the MySQL version.mysql_capacityto know how much space is used by the database.
Do not forget the agent plug-in itself, that needs to be installed for the check plug-ins to work: mk_mysql. As usual, put the agent in /usr/lib/check_mk_agent/plugins, make sure it is executable, and you are ready to keep an eye on your MySQL databases. Or, with Checkmk Enterprise or Checkmk Cloud, bake the plug-in directly into the agent package for easy installation. To do so you need to search and configure the agent rule MySQL Databases under Setup.
6. LVM
Whether it is for performance or for organizational reasons, splitting disk partitions in logical volumes is common practice on servers. LVM has been the standard under Linux for many years and, as you can imagine at this point, can be monitored with Checkmk. The plug-in you need to start monitoring is named lvm. The agent rule in Checkmk Enterprise or Checkmk Cloud can be found under Setup -> LVM, Logical Volume Groups (Linux). More plug-ins are available to allow you to specifically monitor logical volumes (lvm_lvs) and volume groups (lvm_vgs).

7. SMART monitoring
Constantly keeping an eye on the health of your physical drives is vital. Nobody is happy about a drive suddenly dying. Even if you can fully recover its data, knowing beforehand that something is not in order can save the wise administrator lots of time and stress.
SMART monitoring can’t precisely predict when you should substitute a failing drive, but can tell you if you should prepare for the worst case scenario. Under Linux, the standard package for accessing S.M.A.R.T. info is smartmontools. Configuring it goes beyond the scope of this article, but suffice to say that once installed, Checkmk will poll the command-line tool that comes with it, smartctl, for the drives’ health status data.
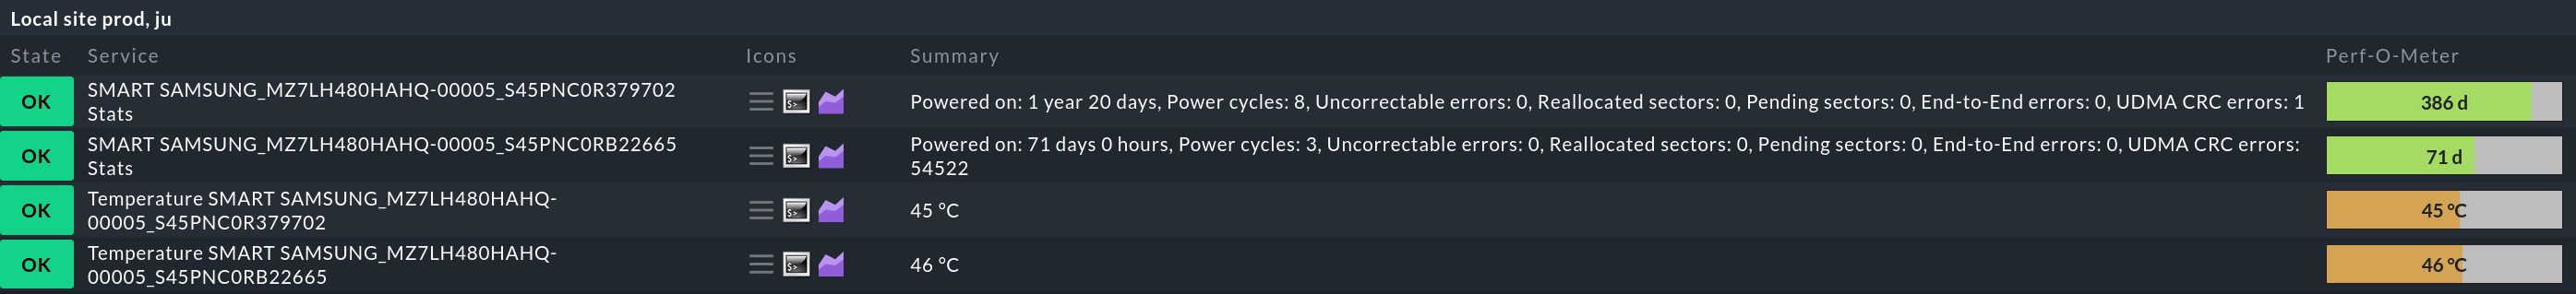
To do so, Checkmk uses the plug-in smart, which interacts with smartctl itself. In one of the commercial Checkmk editions, you can find and configure the agent rule under Setup -> SMART harddisk monitoring (Linux). Further plug-ins are smart_stats, which monitors health statistics, and smart_temp, which reports the temperature.
