Feature Pack 2 is out and comes with Prometheus-integration
 on May 22, 2020
Note: The content on this page uses the former names of Checkmk editions. Checkmk Enterprise is now Checkmk Pro, Checkmk Raw is now Checkmk Community.
On the way to the finalization of Checkmk 2.0 we are proud to be able to present the next intermediate step: the Feature Pack 2. With the Feature Packs we want to enable you to use new functions for Checkmk in a stable 1.6 version. We provide these functions as optional MKPs. Since all new functions when provided are deactivated by default, users can decide which functions they want to activate. In Checkmk Enterprise, this is easily possible via WATO. Checkmk Raw users can activate the features included in the Feature Pack using the CLI. In this post we will show you exactly how you can install the Feature Pack in your environment.
We deliver the new Feature Pack 2 as part of Patch 1.6.0p12. We'll go a little deeper into what functions we can provide you with. Don’t forget to read Faye’s post in our forum, where, at any time you can also exchange info about, and discuss the feature pack. Also check out the video of our Community Call for Feature Pack 2 with a demo of Prometheus integration.
Feature Pack 2 – what's in it?
Feature Pack 2 offers you the following new functions:
- Prometheus Integration
- Redis Monitoring
- Couchbase Monitoring
- RabbitMQ Monitoring
- FortiGate VPN Monitoring
- Pulse Secure Monitoring
- Cisco ASA Monitoring
- Cisco Webex Team Integration
In the following we want to go into more detail on the individual points.
Prometheus
Prometheus is an open source software for the monitoring of fast-moving container environments, and it is effectively the standard for monitoring Kubernetes. Checkmk users who use Prometheus can now try the new integration with Checkmk. We provide integrations of the most important exporters for Prometheus through a special agent. The exporters supported are:
- cAdvisor (Container Advisor)
- node_exporter
- kube-state-metrics
It is also possible to integrate any metric from Prometheus using PromQL queries.
To set up the integration of Prometheus, the user must first set up a new host for collecting the metrics. The setup of the special agent using that host can then be defined using the Prometheus rule set in WATO under Host & Service Parameters ➳ Datasource Programs ➳ Prometheus. You can find detailed instructions in the manual.
This is a first step into our integration with Prometheus. Please share your feedback with us in the forum, so that we can improve it on our path to Checkmk 2.0.

Redis Databases
Several check plug-ins now allow the monitoring of Redis databases and instances. For monitoring, you need the mk_redis agent plug-in, which can be configured with the Agent Bakery using the Redis databases rule. The plug-in, for example, provides information about the persistence status of Redis instances and the currently connected clients.
Couchbase Monitoring
With Feature Pack 2 we also enable the monitoring of Couchbase servers using a special agent. This allows the monitoring of Couchbase buckets and Couchbase nodes. The special agent is configured using the Check State of Couchbase Servers datasource rule. Checkmk can then monitor, among other things, the frequency of node and bucket operations, the number of items for nodes and buckets, the CPU utilization of the nodes, the memory utilization of nodes and buckets, and the uptime of nodes.

RabbitMQ Monitoring
It is now also possible for you to monitor RabbitMQ-Cluster with Checkmk. All you have to do is to configure the special agent using the Check state of RabbitMQ datasource rule to monitor queue and vhost statistics, either cluster-wide or specifically on a node.

FortiGate VPN-Monitoring
With the expansion of the check plug-in for Fortigate VPN monitoring, we offer the option of configuring the monitoring for each of the active VPN tunnels.
Pulse Secure Monitoring
Feature Pack 2 also includes new check plug-ins for Checkmk for monitoring the number of users, CPU, memory and disk utilization, as well as temperature and log file utilization on the appliances from Pulse Secure.
Cisco ASA Monitoring
There are also two new checks for monitoring the number of active WebVPN and IPsec sessions for Cisco ASA devices.
Cisco Webex Team Integration
With Feature Pack 2, we are introducing another channel for notifications using Cisco Webex Team. The extension allows Checkmk to inform operations teams about changes in the status of hosts and services via Cisco Webex Team.
For this, however, it is first necessary to set up a webhook for team or space that allows Checkmk to send messages. In the next step, the administrator must create a new notification rule under WATO ➳ Notifications, and select Cisco Webex Teams as the method. They then have to copy the webhook's URL into the webhook URL field. If the user wants to send messages with hyperlinks to Checkmk, they must activate the optional URL prefix for links to Checkmk field.
Checkmk Community Call about Feature Pack 2
In our Checkmk Community Call we talked with you about the Feature Pack 2. During the call Wontek showed you how to configure Prometheus in Checkmk. He also answered your questions about the Prometheus integration. Check it out:
How to use the Feature Packs in Checkmk
By default, the new features are not active in Checkmk right away. Activating them requires only three steps
- Download the latest version of any of the Checkmk Enterprise editions or of Checkmk Raw, and install it as usual. You can find all required steps in the handbook. For users of any of the Enterprise editions: If you open Checkmk for the first time after the update, you will be able to activate the features you would like to use. You can achieve that with just one click under WATO-Configuration➳ Extension Packages. You should see something like this — all packages are marked as optional and are not installed:
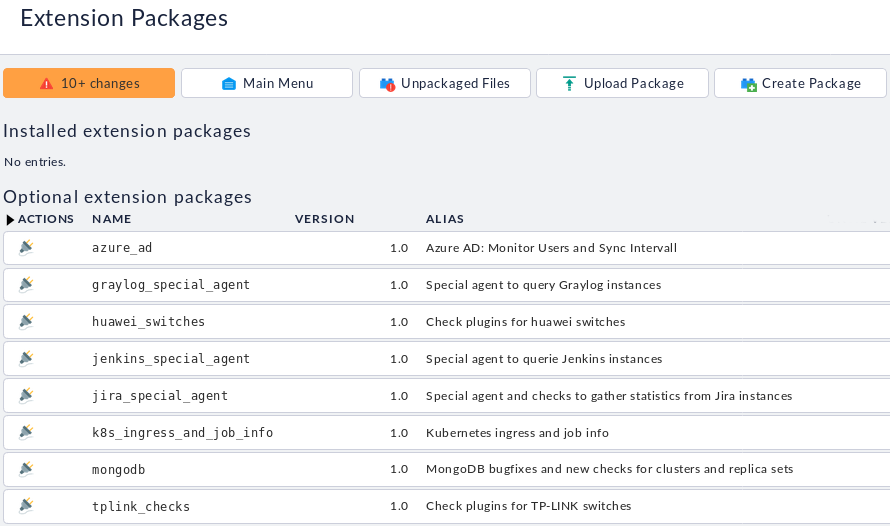
- Activate one or more plugins by clicking on the

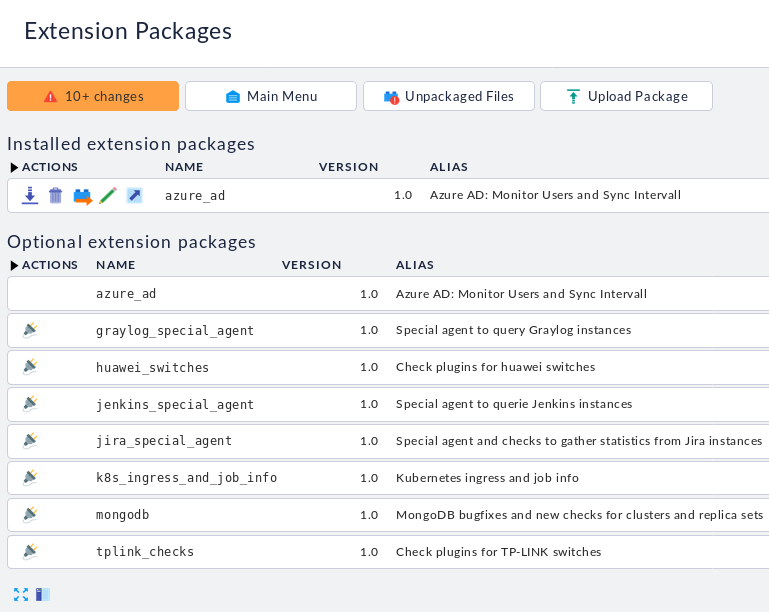
- To remove the plugin again, click on the

If you are a user of Checkmk Raw, you can use the command line interface to install and manage the individual features. For both editions, you will find the installation details in the chapter on extensions (MKPs) in our handbook.
Checkmk Raw users cannot activate the desired functions via WATO, but must do so via the CLI. To do this, they must install the desired package via the CLI. The MKPs are located in the ~ share / check_mk / optional_packages / folder. For example, to install the azure_ad package, the user must execute the following command:
OMD[mysite]:~$ mkp install ~/share/check_mk/optional_packages/azure_ad-1.0.mkp
The road ahead
We usually plan to release up to three feature packs between two major releases. However, it is not yet clear whether we will release a third feature pack before the next major release Checkmk 2.0.
However, we want to launch a first Innovation Release in the next few months. This means that we have already implemented most of the functions for Checkmk 2.0, but have not yet carried out a feature freeze. The innovation releases enable us to make large features testable for users even during the development phase. These are a good tool for us to receive feedback from our users before the beta phase. Since we have not yet carried out a feature freeze during the innovation releases, it is also possible for us to add functions.
The feature freeze is planned for this summer. Due to the numerous changes we want to make testing in the beta phase for Checkmk 2.0 much more pronounced than in previous versions. We will inform you about the various test options at this point, and hope that you will then make extensive use of them. In autumn we then want to publish the next major version: Checkmk 2.0.
Happy Monitoring!
