Cloud monitoring and Kubernetes: tribe29 introduces Checkmk 2.0
Share this press release over social media
Checkmk 2.0 is now available
Munich (Germany) – March 09, 2021 – tribe29 is releasing version 2.0 of Checkmk today. With the most significant update in the company's history, tribe29 lays the foundation for the future development of their monitoring solution. The corresponding packages for the open-source edition (Checkmk Raw) and the commercial Checkmk Enterprise Edition are now available for download.
The most noticeable change is the completely redesigned user interface. In combination with enhanced dashboarding functionality and new visualisation options for metrics, Checkmk provides a wide range of new options to tailor the monitoring towards user needs.
With two new programming interfaces, Checkmk 2.0 also offers extensive possibilities for increasing efficiency: The new REST API allows better automation of monitoring and the new Check API now makes it easier to add extensions to Checkmk. It also simplifies the development and maintenance of self-written check plug-ins. A further new feature is the integration of Prometheus into Checkmk.
Despite the many new features, the developers have also been able to improve performance and scalability. For example, tribe29 has optimized the Checkmk Micro Core (CMC) in the Enterprise Edition. Analyses have shown that with the same hardware resources, thanks to its new architecture, Checkmk 2.0 can monitor four times as many systems as than before while maintaining the same level of performance.
Also new are numerous official integrations with now over 1,900 official monitoring plug-ins available for Checkmk. These include improved monitoring of public cloud providers such as AWS and Microsoft Azure and improvements in monitoring Kubernetes. In addition, tribe29 extends monitoring with new or improved plug-ins for systems and applications such as Proxmox, Nutanix, Jenkins, Jira, Graylog, Elasticsearch, Couchbase, RabbitMQ, Redis and MongoDB.
Checkmk 2.0 addresses the key challenges in IT monitoring by providing relevant information from an increasingly complex IT to IT Ops and DevOps teams in a way that makes it easy for them to ensure high availability and performance. The new version delivers a wide range of new features, can be used intuitively even without monitoring experience and is still suitable for use in very large and hybrid environments: In addition to the many small improvements, I am pleased that we have reached important milestones, especially in core trends such as automation, cloud and Kubernetes. At the same time, monitoring with Checkmk is now more efficient than ever before.
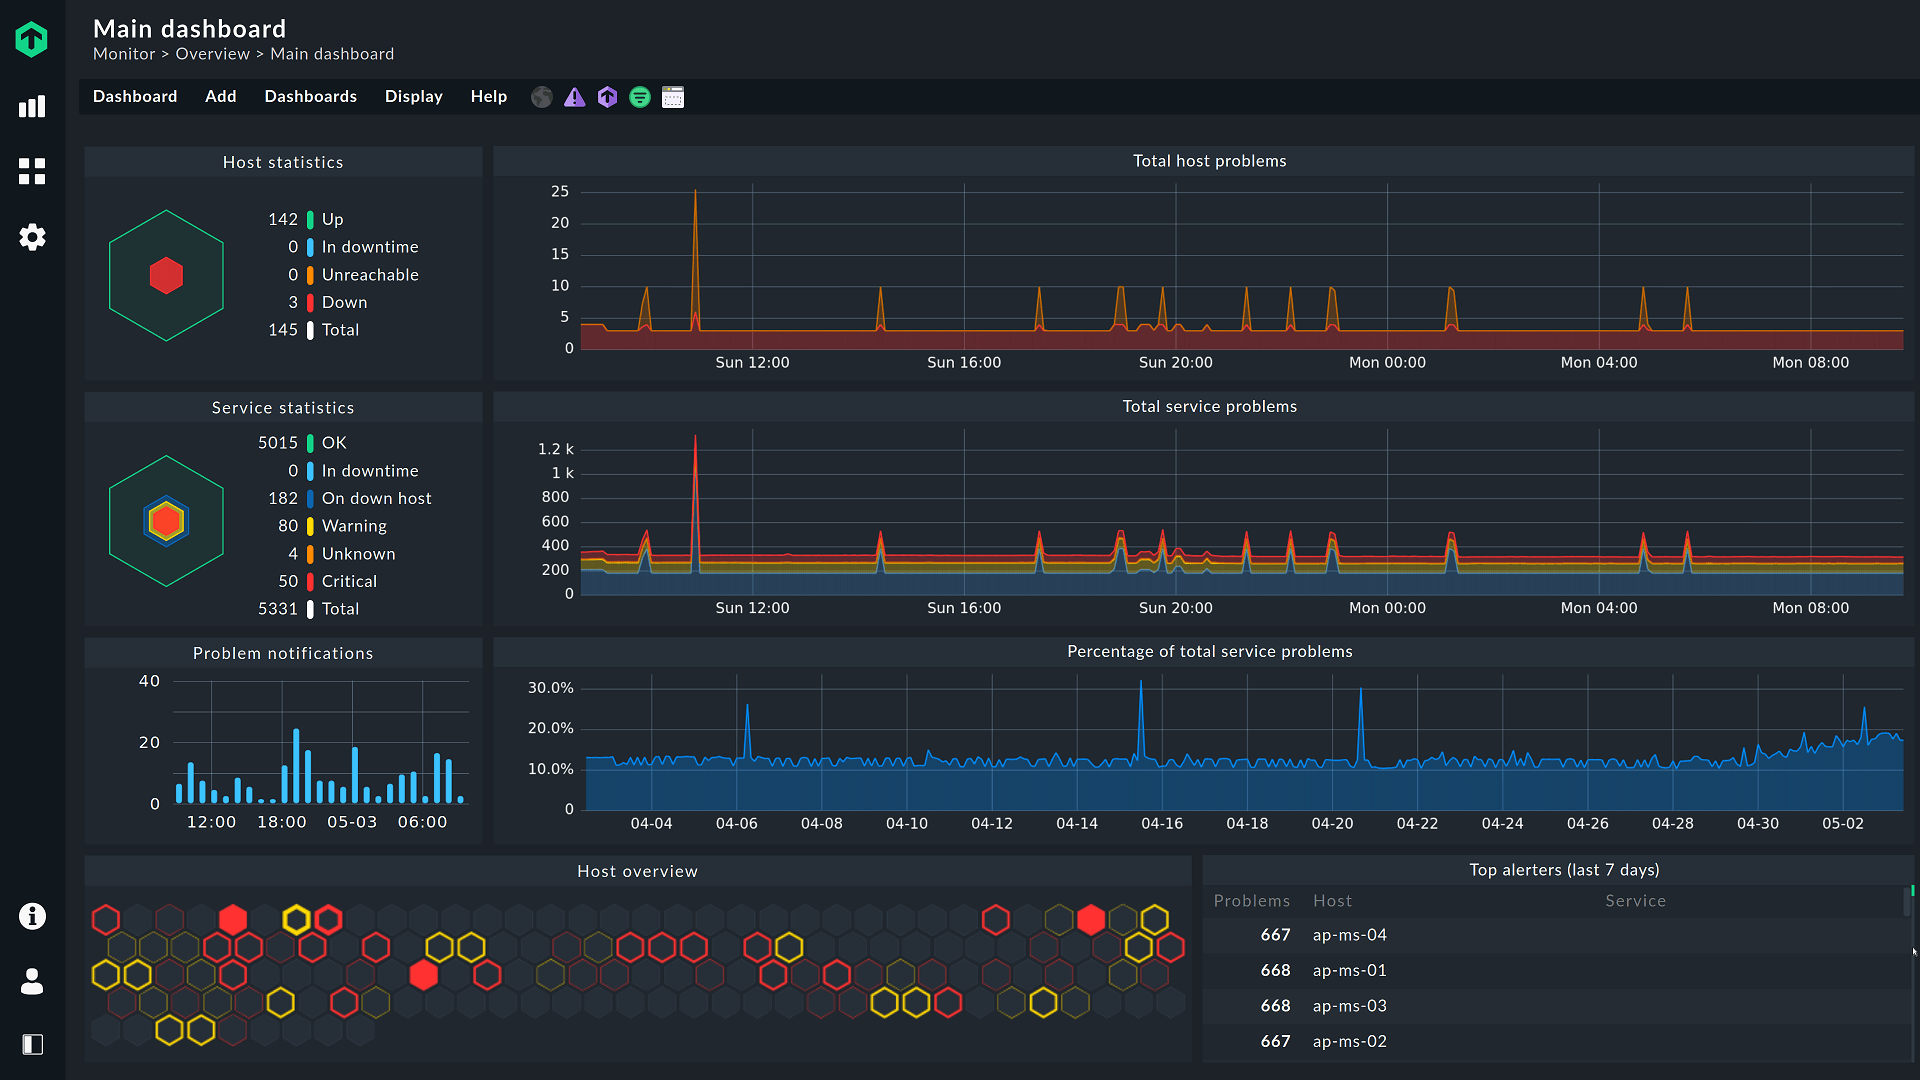
The new user interface and dashboarding in Checkmk
The entire navigation concept of Checkmk has been fundamentally redesigned to make it easier and faster for normal users to learn Checkmk. At the same time, it now even more efficient for experienced users to navigate through Checkmk.
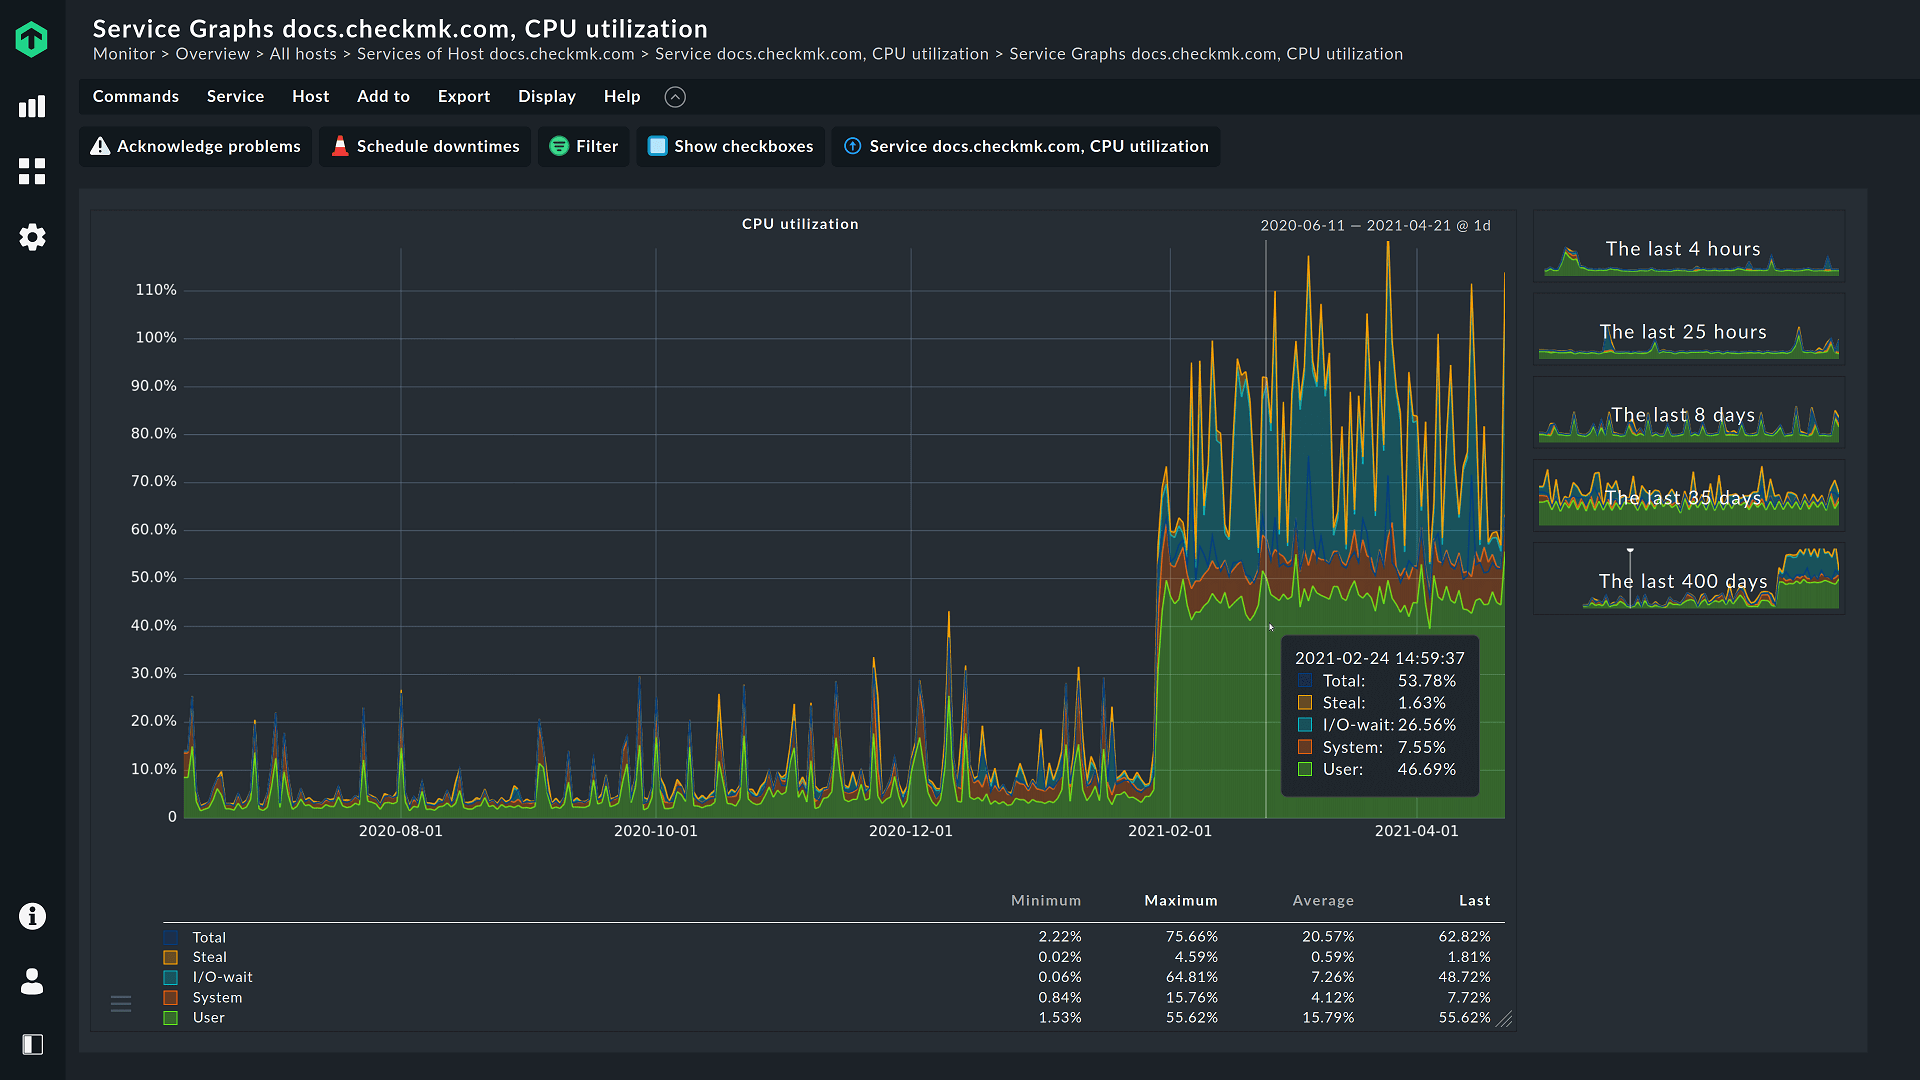
The dashboarding has been fundamentally revised and many new options for data visualization have been added. Configuring dashboard elements is now easier and users can also now customize dashboards precisely to their needs with just a few clicks. To reduce complexity, Checkmk now only shows the most important features in the menus, while still allowing familiar users to toggle to an ‘Expert mode’. In addition, context-sensitive in-page menus and breadcrumbs make working with Checkmk more efficient and lead users to their goal more quickly.
Expansion of container and cloud monitoring
The new version of Checkmk expands Kubernetes monitoring to include Ingresses, Jobs, Endpoints, and Pod States. It is additionally now possible to use Kubernetes namespaces as a host prefix.
With Checkmk 2.0, tribe29 is also introducing its Prometheus Integration. The combination of Prometheus and Checkmk is ideal for collaboration between DevOps teams and IT Operations. With this, Checkmk provides an integrated view of the entire stack. To achieve this Checkmk has integrated the most important Prometheus exporters with cAdvisor, node_exporter and kube-state-metrics. The metrics in Checkmk are not simply returned, but are also supplemented with context information that allows immediate monitoring, including alerting. It is also possible to create custom PromQL queries that generate Checkmk services and metrics to monitor applications and more via Prometheus.
Since a growing number of users are monitoring their AWS services with Checkmk, the new version comes with enhancements for monitoring ELB, EC2 and RDS. Users can additionally monitor AWS services such as Glacier, DynamoDB and the Web Application Firewalls with Checkmk. For Microsoft Azure Cloud, monitoring of the important ‘Active Directory Connect’ service is now possible.
The new Check API and REST API
To simplify the creation, testing and operation of check plug-ins, a new Check API is now available. This new design makes the development of custom plug-ins more consistent, easier to document, and simplifies their maintenance. Moreover, the new API brings many other minor improvements, including cluster compatibility, for example. However, due to an auto-conversion most older check plug-ins are still supported, so in most cases no migration is necessary. More details are available in the user guide.
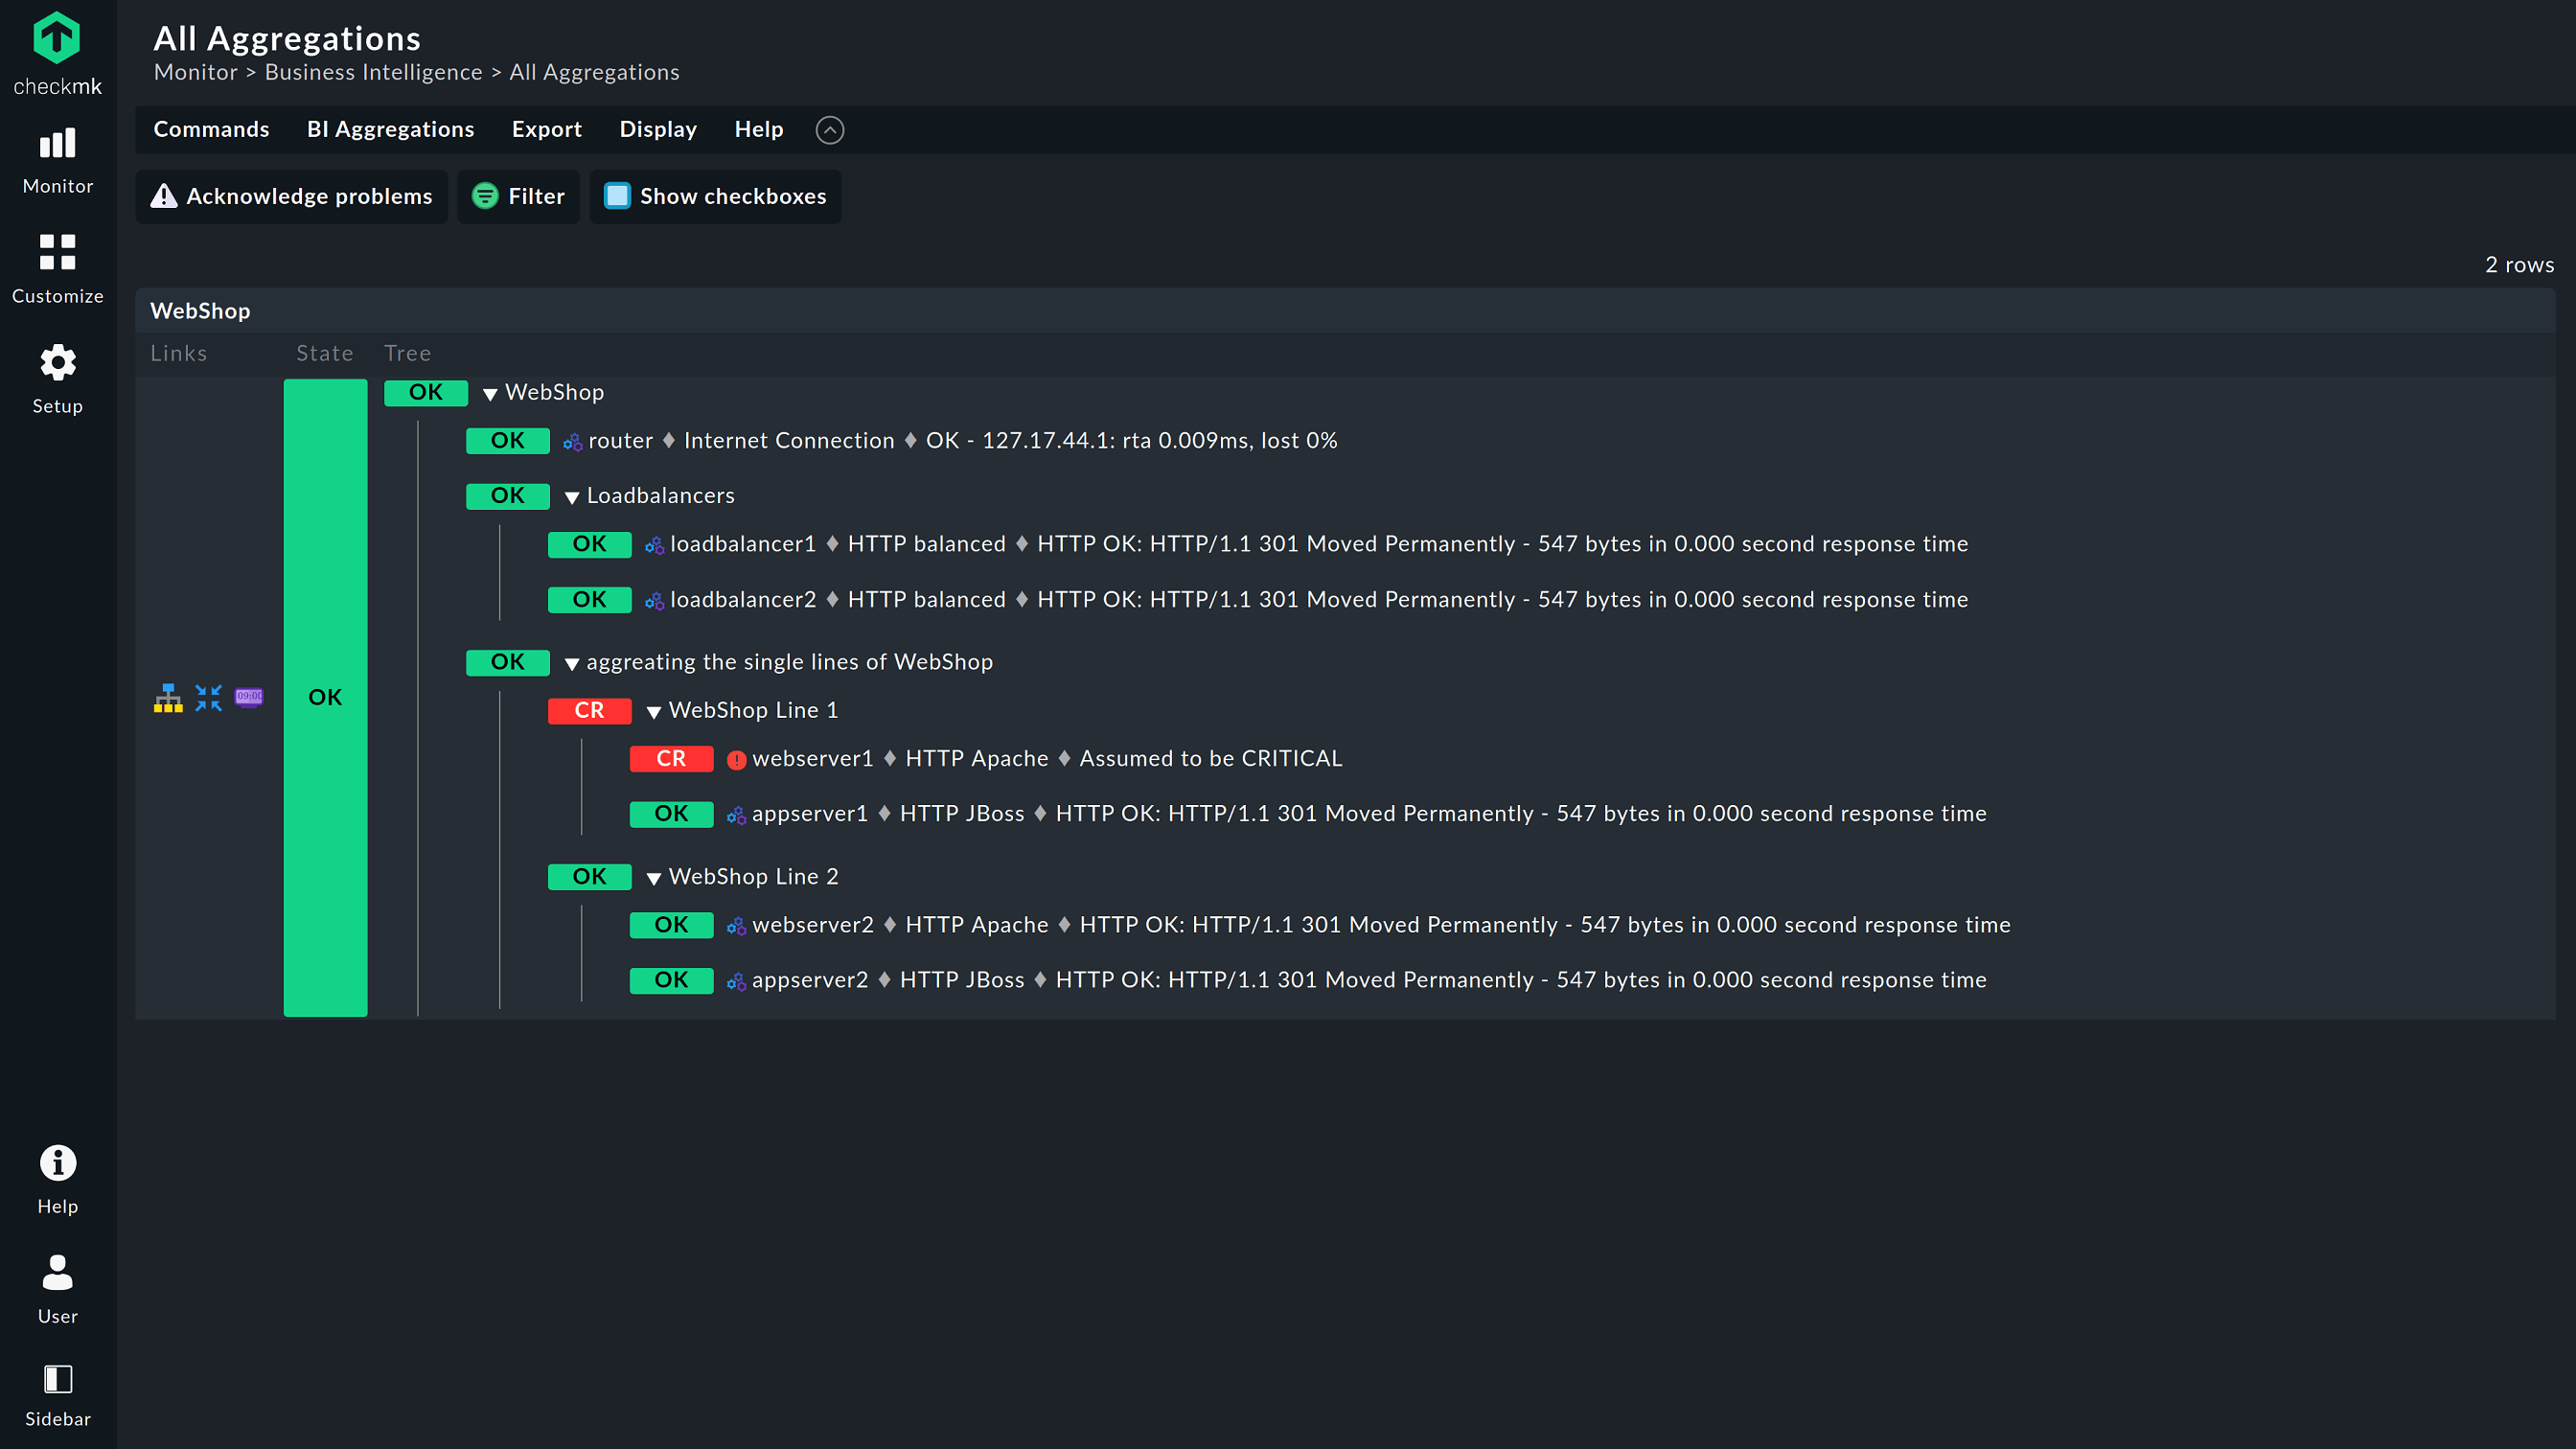
A newly-developed REST API is also included in version 2.0. This improves Checkmk’s automation capabilities and enables the use of numerous Checkmk functions via the interface. For example, the new API can query the status of hosts and services or create scheduled maintenance times. It also allows the complete configuration and querying of Checkmk’s business intelligence.
Improvements to the Raw and Managed Services Editions
With version 2.0, the HTML5 graphing from the Enterprise Edition replaces the PNP4Nagios graphs in the Raw Edition. The Grafana integration in the Enterprise Edition is now additionally available in the Raw Edition. The Enterprise Edition, however, still offers many additional features and visualization options for graphing and dashboarding. New reporting functions are now available for the Managed Services Edition. Among other features, this enables the creation of standard reports for customers or the adaptation of reports to customer-specific layouts.
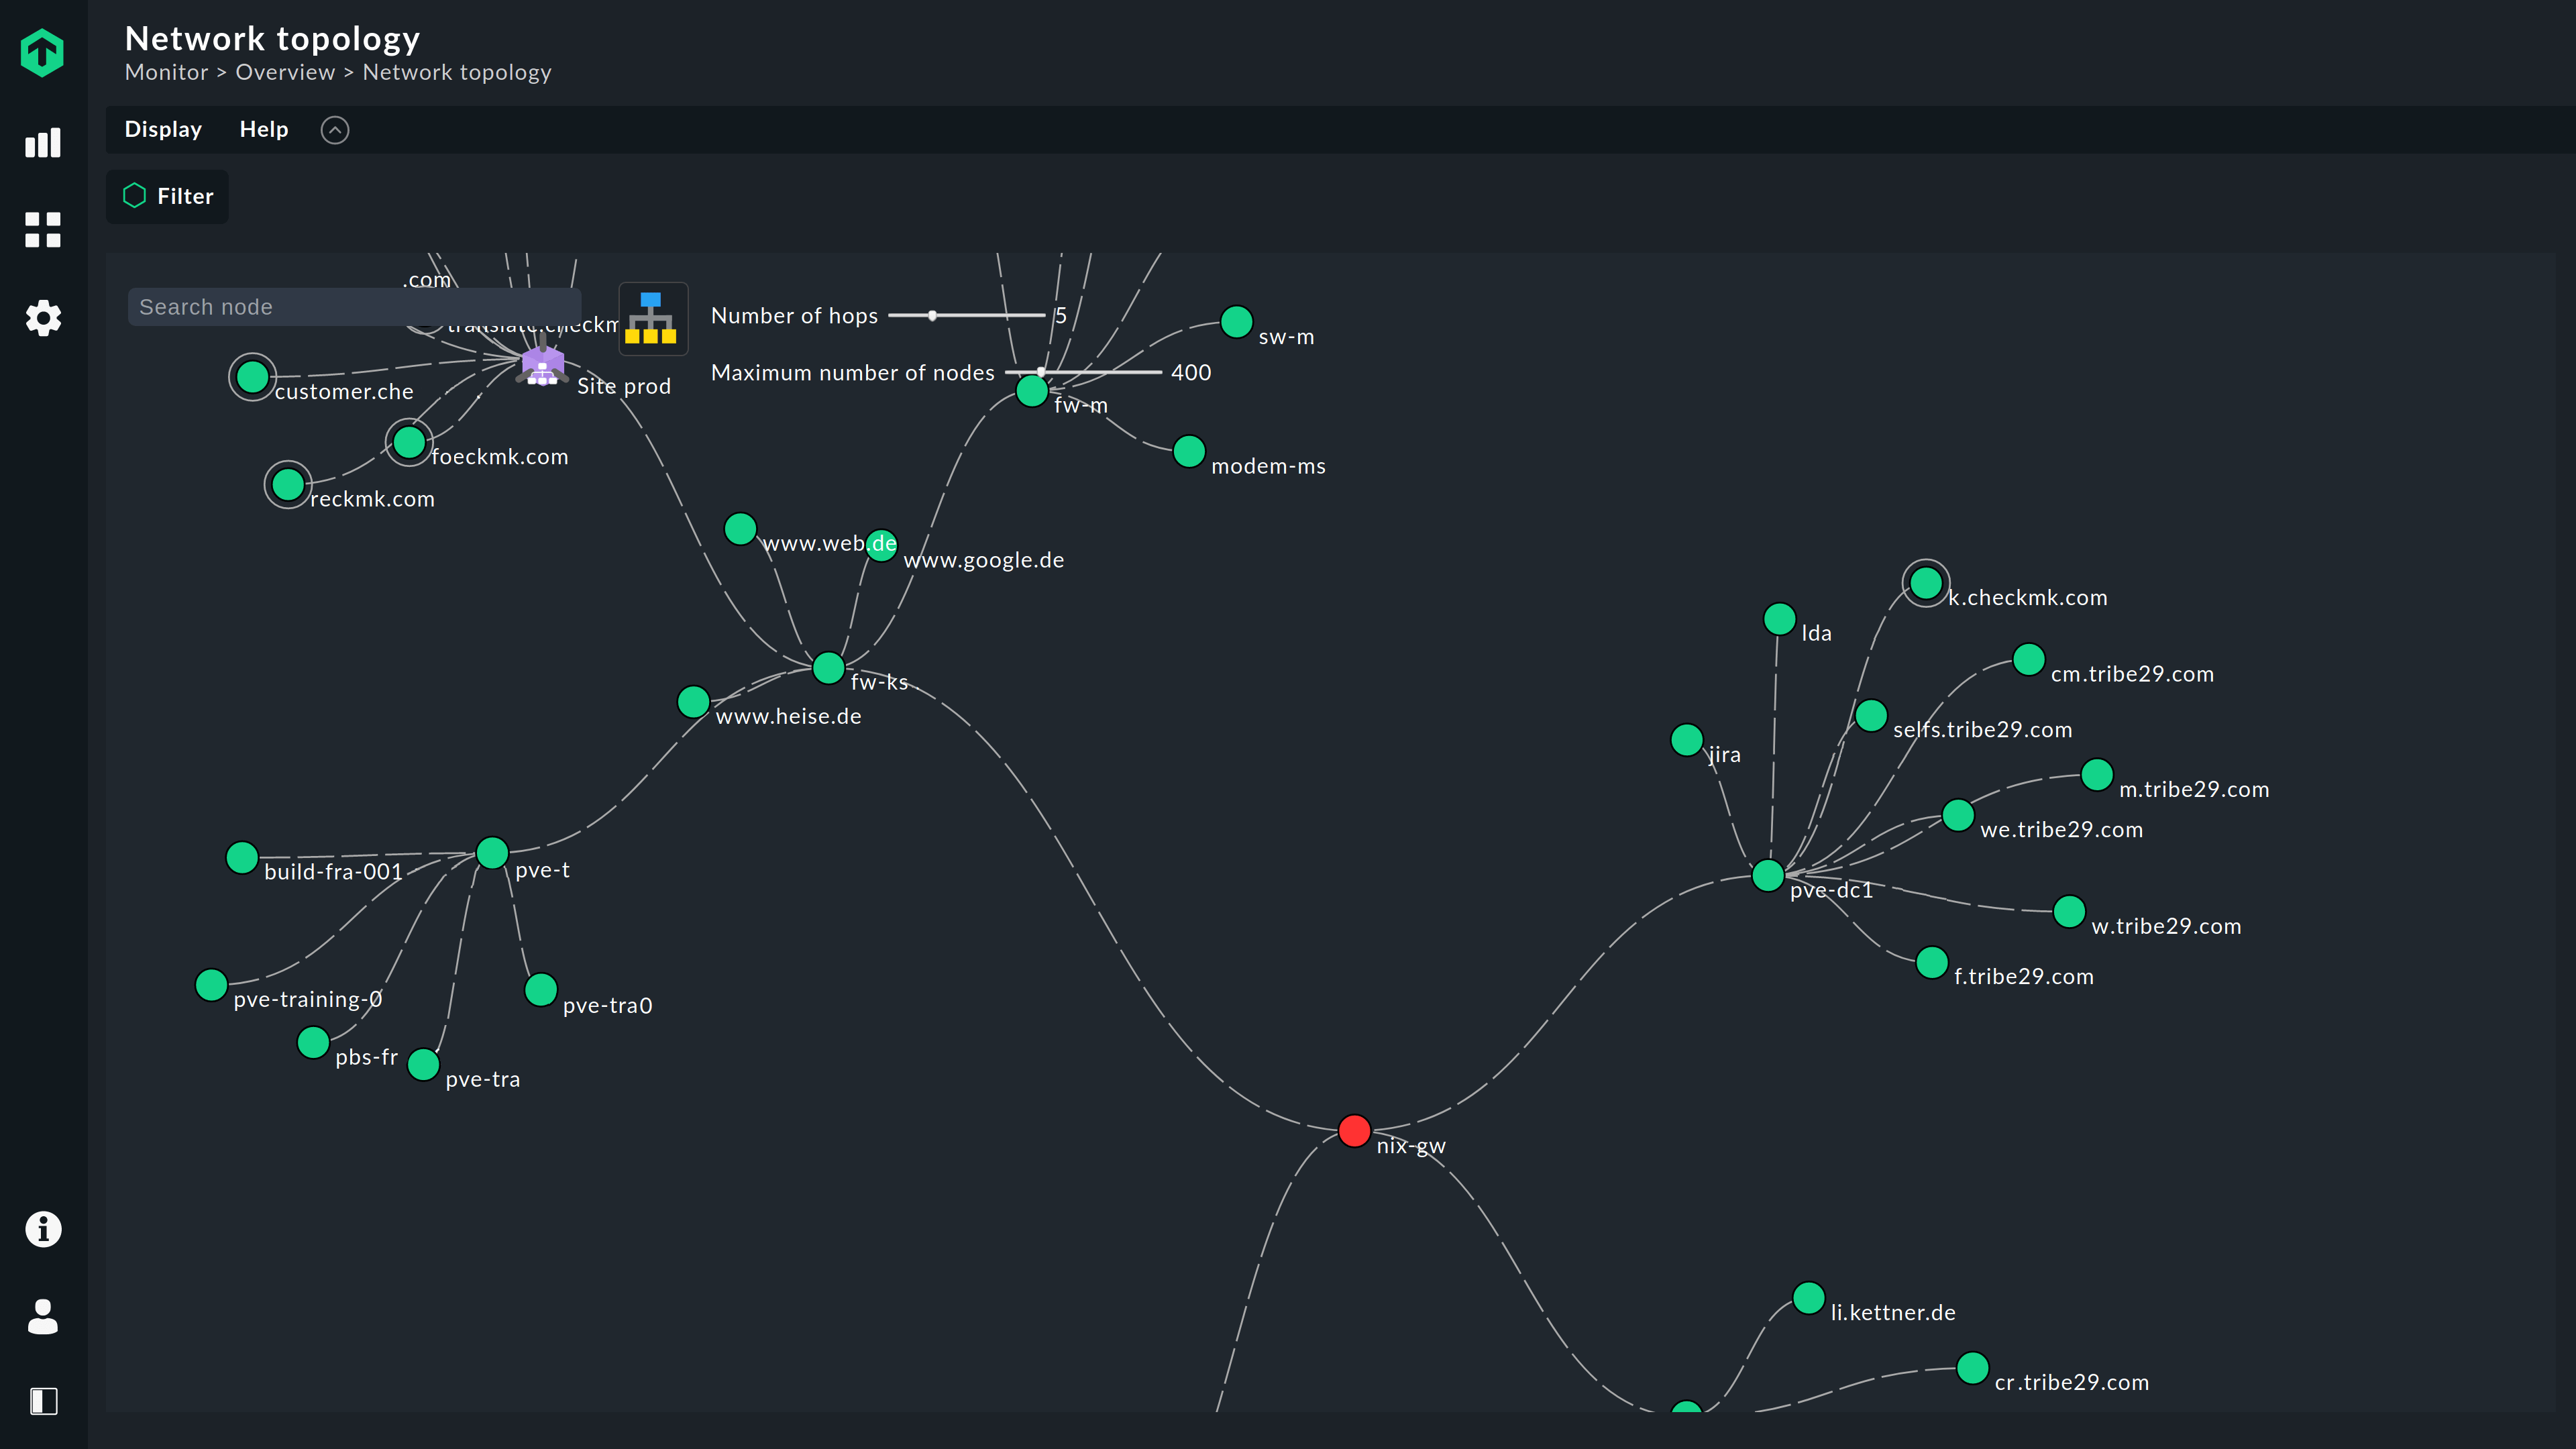
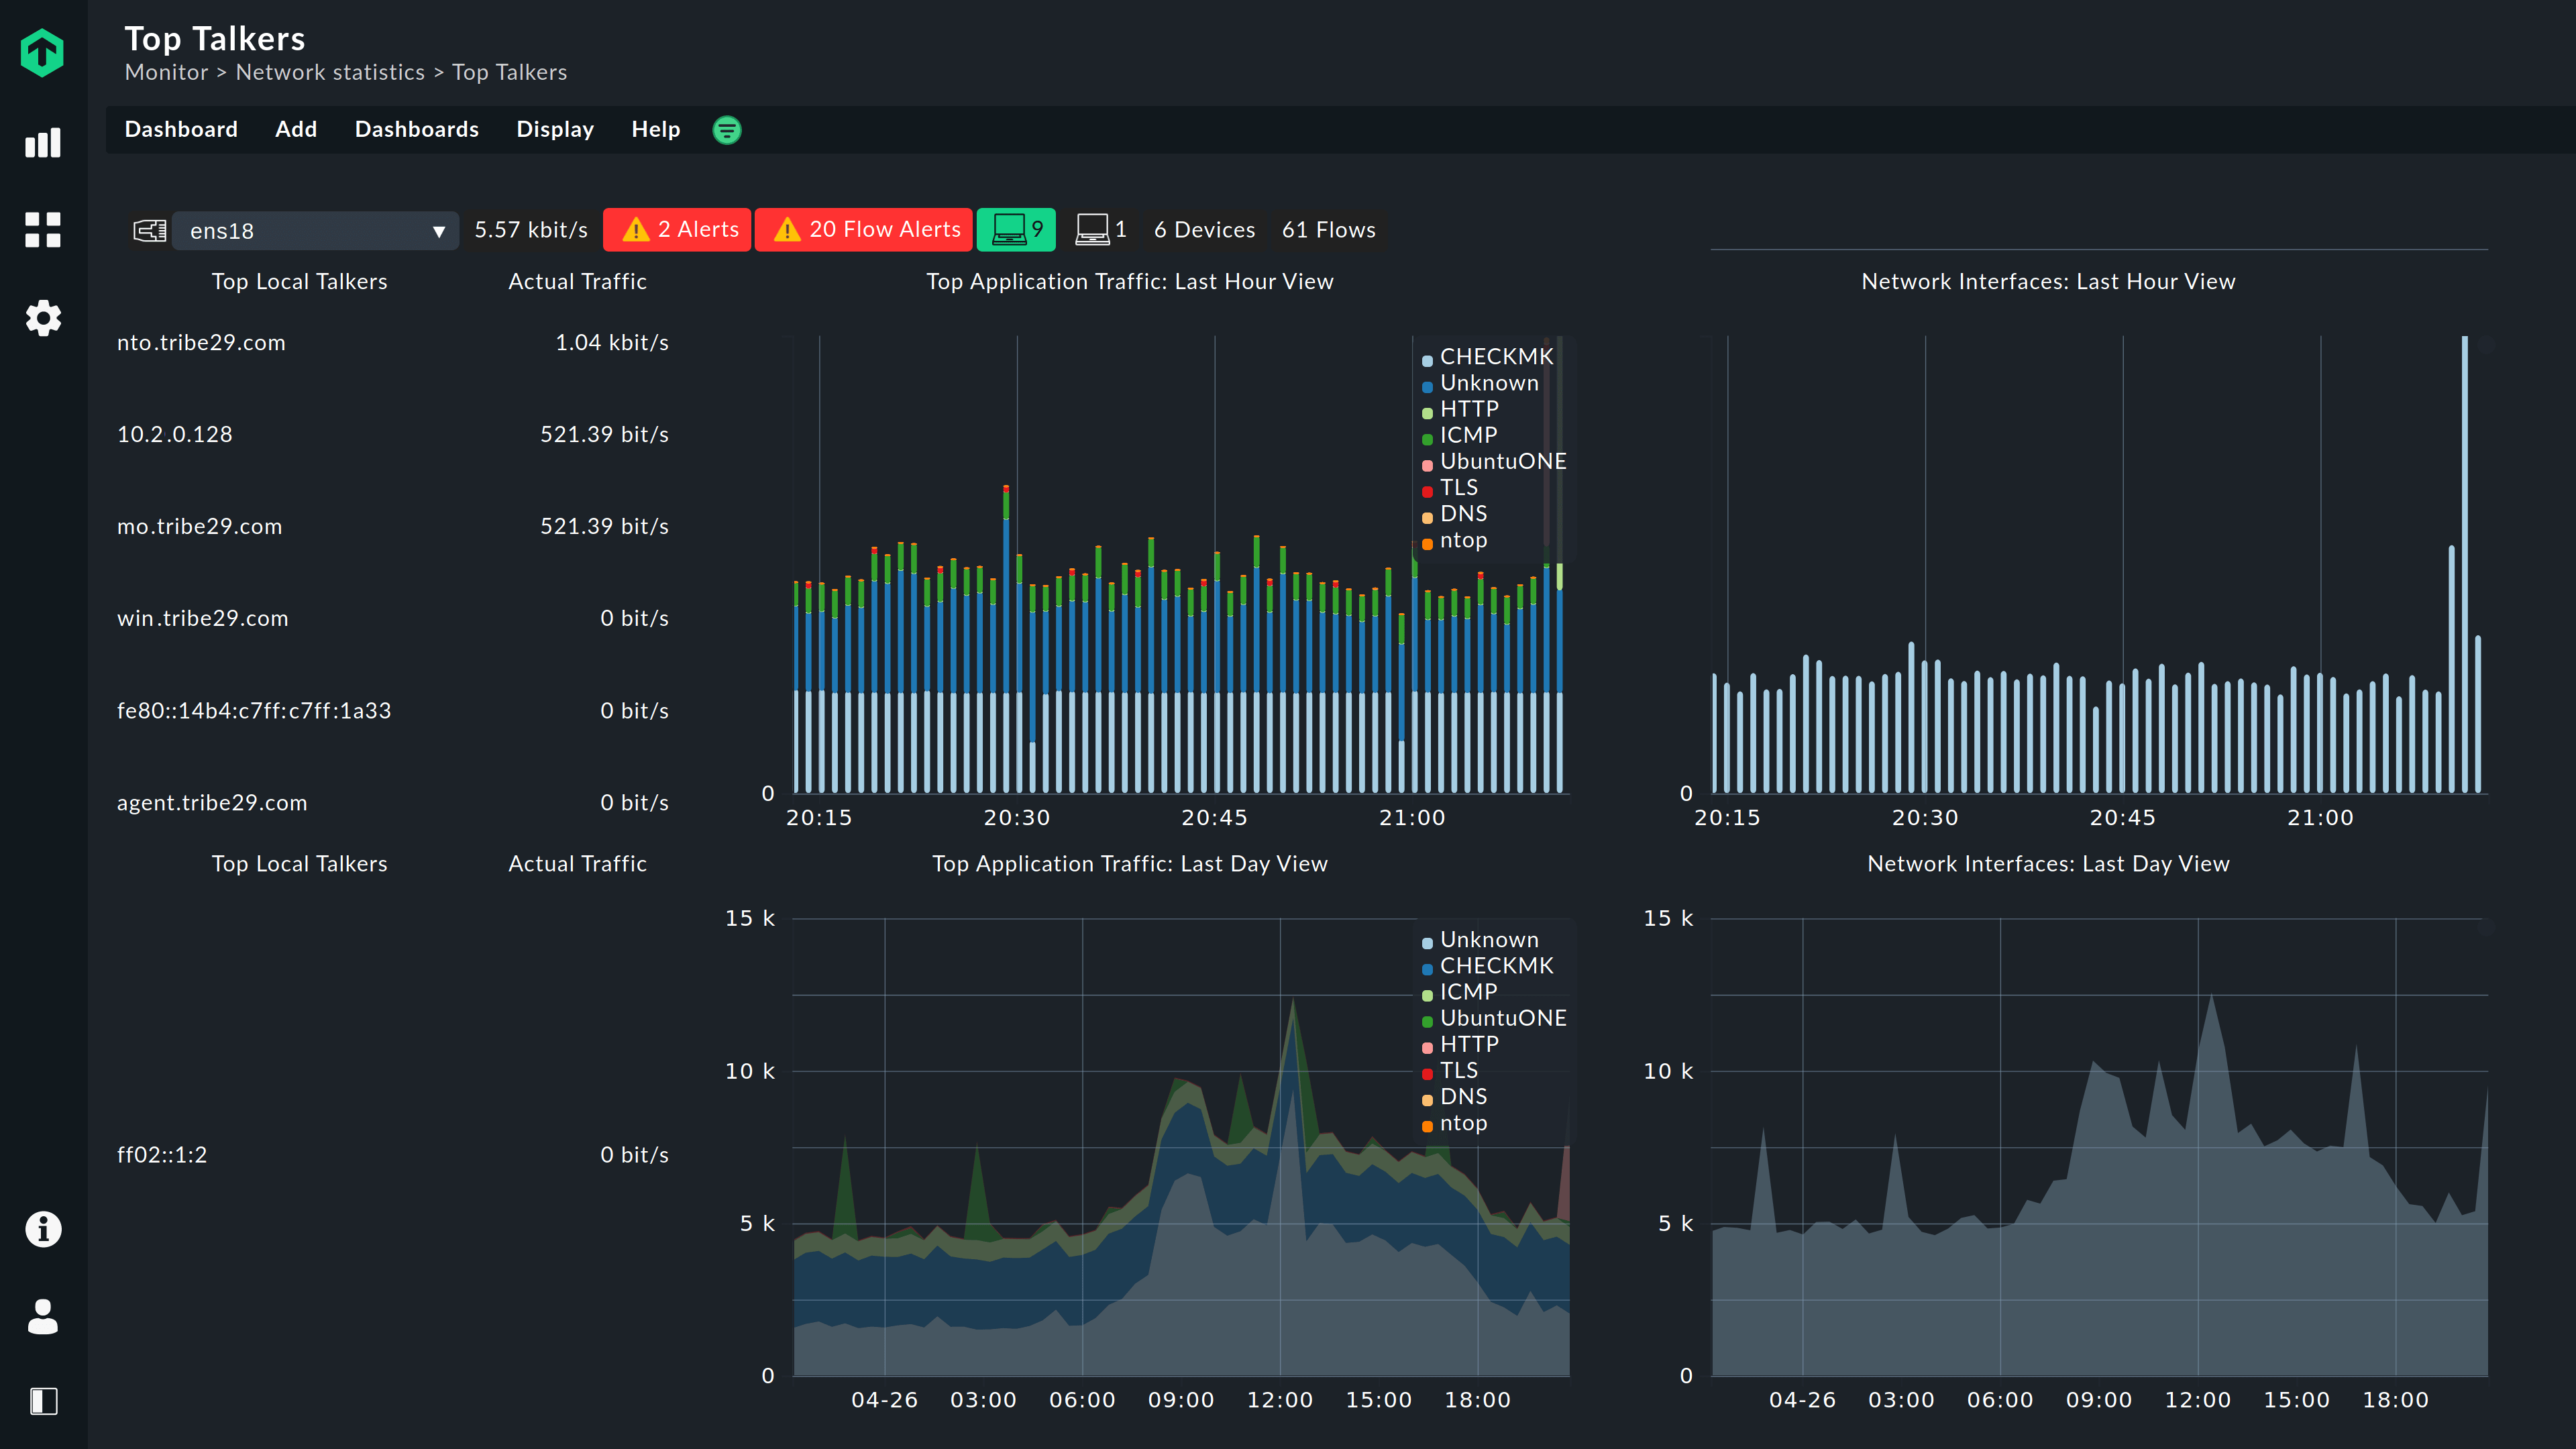
Network flow monitoring with the ntop integration
Checkmk 2.0 adds the ability to incorporate flow data from ntop, a popular network performance monitoring tool, into Checkmk, eliminating the need to jump back and forth between the user interfaces of both tools. By analyzing network flows, users can understand who is doing what, when and where on the network and thus identify potential bottlenecks or anomalies in their network environment.
Making Checkmk even more automated and flexible
The two new interfaces are merely two examples of how Checkmk 2.0 can automate processes so that users can minimize their efforts when it comes to monitoring. Other innovations, such as auto-discovery for labels, were designed with this in mind. These allow Checkmk to assign appropriate labels based on the monitoring data collected from the systems in the monitoring process. For example, Checkmk can automatically assign labels according to operating system or device type.
Impressions of Checkmk 2.0
You find more screenshots of the latest Checkmk version on the latest version page.
Media contact
Heike Link
heike.link@checkmk.com
Phone: +49 159 06546526


About Checkmk
Checkmk's mission is to enable IT infrastructures and applications to run in any organization at peak performance. That’s why we built Checkmk, the monitoring platform for every aspect of modern IT environments.
Checkmk is the platform of your open observability ecosystem. It combines enterprise-grade scalability and security with the extensibility of open source software. It integrates seamlessly with other enterprise applications and provides powerful features to automate monitoring workflows.
Tens of thousands of users in more than 50 countries rely on Checkmk to ensure high availability and best performance of their systems. With Checkmk, organizations prevent issues before they happen or trigger fast remediation actions when failures occur.