Note: The content on this page uses the former names of Checkmk editions. Checkmk Enterprise is now Checkmk Pro, Checkmk Raw is now Checkmk Community.
The wait is over – Checkmk 2.0 is the latest full version of our IT monitoring solution. For this release we have not only added numerous functions, but we have also improved many of its fundamental structures. As a result, now our monitoring software is easier to use, faster, more extensible, and will make our monitoring even more effective for its users.
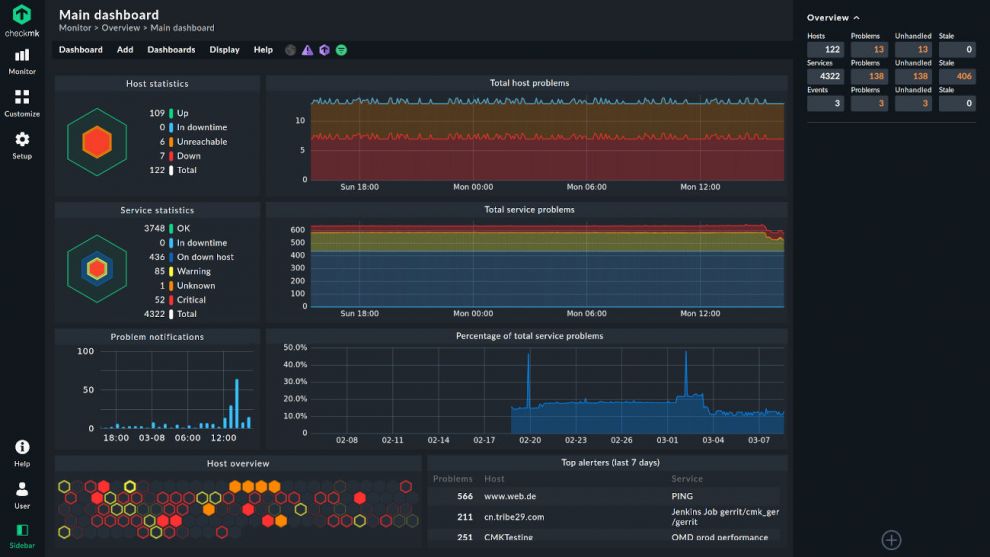
The biggest change that a user will immediately notice is the completely-redesigned user interface. The new GUI was also our biggest project in 2020 and includes, among other things, a new navigation, and redesigned dashboards that offer many new features and which are easier to customize.
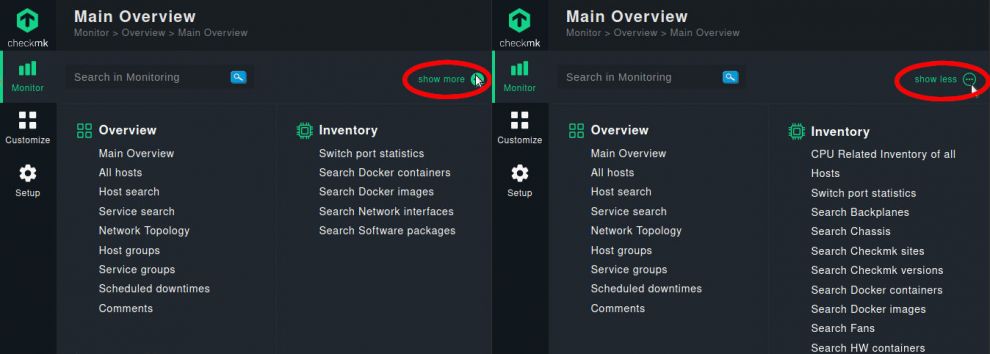
We are also introducing a Beginner and Expert Mode with the new product version. Checkmk comes with a large number of features 'out of the box', which power users in particular need for their daily work with Checkmk. Casual users, however, do not usually need many of these functions – but displaying all of the available options makes the learning curve and navigation more complex for such users.
With the new mode, each menu now gets a 'show more' or 'show less' button in the upper right corner. In this way, new users should see the – from our point of view – most important functions on their respective page and only see all of the other available functions when they click on 'show more'. We want to make Checkmk clearer for beginners and thus simplify the familiarization phase..
Similarly, we have divided the rules in Checkmk into categories that are more intuitive for new users and also moved them up one level in the menu structure to make them more accessible. There are now many more entries in the Setup menu (formerly WATO), which should direct the user more quickly to the rule they are looking for.
To make this transition easier for experienced users, we have also integrated a new search function for the complete Setup Module. In this way, we have consolidated the search functions that were previously distributed over various locations – such as Rule Search, Global Settings Search, and Host Search – into a single tool.
In addition, Checkmk 2.0 now automatically detects labels and sets them for operating systems (Linux, Windows, etc.) and device types (firewall, switch, etc.) - based on the information it collects from the hosts via agent or SNMP. By expanding the discovery rules, it is now also possible to set specific service labels for discovered network interfaces, for example, for all interfaces of a switch or specific ones for the uplink ports.
The process discovery is similar: if the discovery detects a process called "apache" on a host, for example, it could then "label" it as a "web server". Based on these host labels, it is then possible to create views or rules.
Extended cloud and container monitoring
With version 2.0, we are further expanding the monitoring capabilities for cloud and container infrastructures. The most important innovation in this field is the addition of the Prometheus integration. In the realm of network monitoring, we are also closing a white spot. Through the deep integration of ntop in Checkmk Enterprise, we have now made it possible to monitor network flows. We have also simplified the configuration of network monitoring by standardizing the set of rules for the discovery of network interfaces.
Furthermore, with the completely new REST API and the revised Check Plug-in API, we are simplifying the future automation and creation of extensions with Checkmk.
A typical scenario in software development is that as more and more new functions are added, the resource consumption by the solution also increases. We also wanted to break away from this analogy with Checkmk 2.0. For this reason, we have re-engineered the architecture of the CMC (Checkmk Micro Core) of the Enterprise edition, so that it consumes significantly fewer resources while delivering the same performance as before.
Checkmk Raw users can also look forward to a modern new graphing. With the new product version, we have replaced the previous PNP4nagios-based graphing with HTML5 graphing, which we already use in Checkmk Enterprise. We are now also extending the support of the Grafana integration to Checkmk Raw.
And of course, with the new full version, we have also expanded the number of supported systems, so that Checkmk can monitor even more solutions from a wider range of providers.
Enhanced security functions
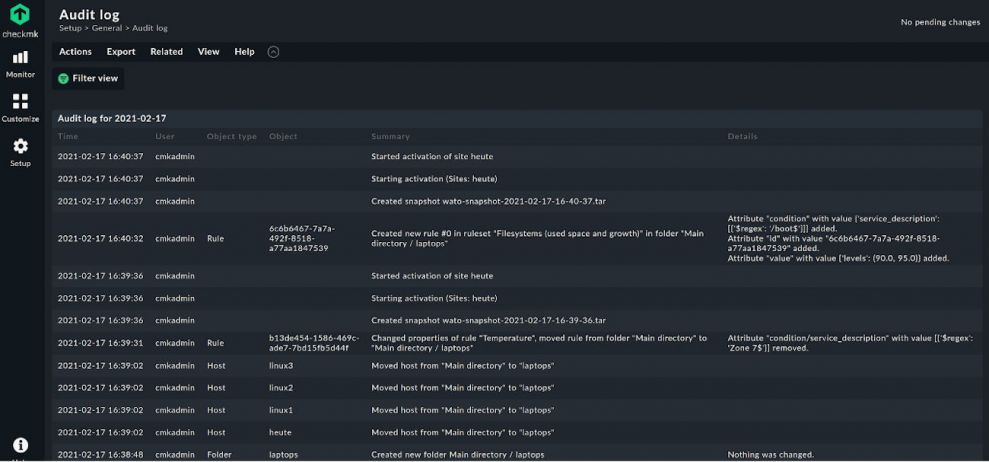
In terms of security, Checkmk 2.0 will offer detailed audit trails, thus providing insights into any services a user has modified, removed or added to a host, for example, or which attribute they have changed and to which value. It is also possible to view the audit logs from each host individually. With the new product version we are also introducing support for SAML authentication.
Along the way, we have also moved our entire Python codebase of more than 500k LOC from Python 2 to Python 3.
More information about Checkmk 2.0
For deeper insights into the many changes and features Checkmk 2.0 has in store, read one of our blog posts on a specific topic:
- More modern, intuitive and individual – the new UX
- Clouds and containers – monitoring of modern IT assets
- Network monitoring – deeper insights and improved configuration
- New APIs provide automation and more stability
- More power under the hood - improvements to the Checkmk core
- A broad foundation for your IT monitoring
You can also find more information about Checkmk 2.0 in the Checkmk forum in our documentation or on our YouTube channel.


