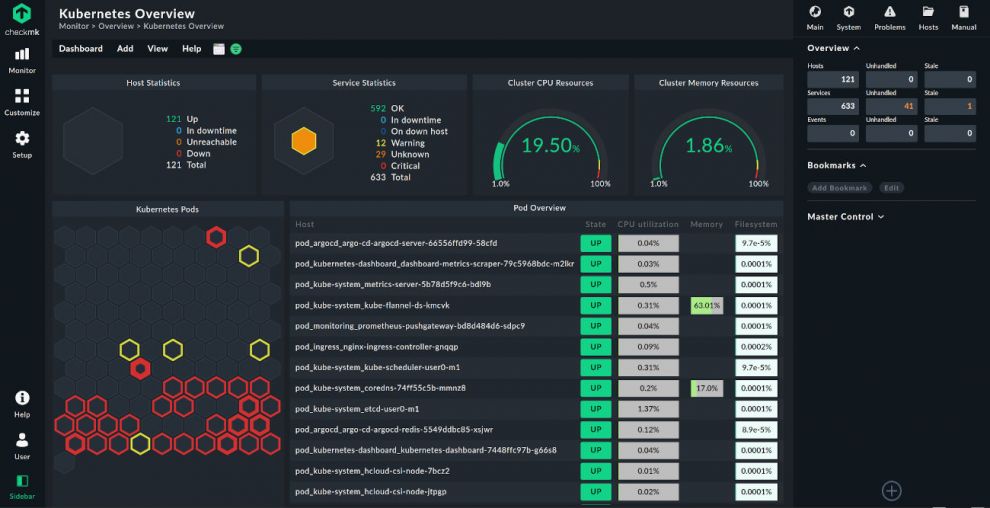
Last year we released the first version of the Prometheus integration in Checkmk as a part of Feature Pack 2 for Checkmk 1.6 (1.6.0p12). Prometheus is a popular tool for DevOps teams to monitor Kubernetes clusters. Our goal was to extract relevant standard and custom metrics from Prometheus and to integrate them into Checkmk, thus providing an integrated view of the entire stack. For this purpose we have included the most important Prometheus exporters into Checkmk with cAdvisor, Node_exporter as well as kube-state-metrics. It is also possible to create custom PromQL queries that lead to Checkmk services and metrics.
Since the launch of the Prometheus integration in May 2020, we have made further improvements to the Prometheus integration - based on feedback from our users – such as better handling of Kubernetes namespaces, HTTPS support and new checks. In Kubernetes monitoring, with Checkmk 2.0 we have enhanced the monitoring of ingresses, jobs, endpoints, and pod conditions, as well as fixing several bugs with the new version. In addition, it is now possible to use Kubernetes namespaces as a host prefix. You are also able now to monitor specific namespaces, e.g. if your cluster has multiple namespaces, it is now possible to specify a list of regex patterns.
In addition to container monitoring with Prometheus, our goal is also to continuously expand our existing container and cloud monitoring. For Checkmk 2.0 in particular, we improved the monitoring of ELB, EC2, and RDS, and also extended the monitoring to include AWS services such as Glacier, DynamoDB, and the Web Application Firewalls (v2). For Microsoft Azure Cloud, monitoring the important Active Directory Connect service is now possible.
More information about Checkmk 2.0
For deeper insights into the many changes and features Checkmk 2.0 has in store, read one of our blog posts on a specific topic:
- More modern, intuitive and individual – the new UX
- Network monitoring – deeper insights and improved configuration
- New APIs provide automation and more stability
- More power under the hood - improvements to the Checkmk core
- A broad foundation for your IT monitoring
You can also find more information about Checkmk 2.0 in the Checkmk forum in our documentation or on our YouTube channel.

