One of our main goals with Checkmk 2.0 is to improve usability both for new users and experts. To achieve this, we have not only completely redesigned the GUI, but also simplified the navigation and dashboarding and added new features. In this blog article, you will learn about all of the new features Checkmk 2.0 impacting the user experience has to offer:
- Improved navigation with the new Checkmk user interface
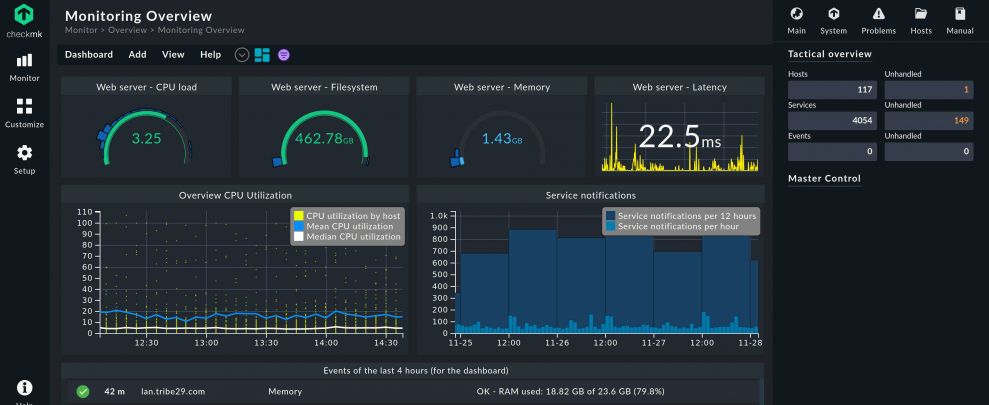
- Everything in one view: New standard dashboards
- Customize your monitoring: Building great dashboards with new powerful visualization options
- One dashboard to rule them all: Be clever using dynamic filters
- Eye Candy for metrics – Modern graphing for the Raw Edition
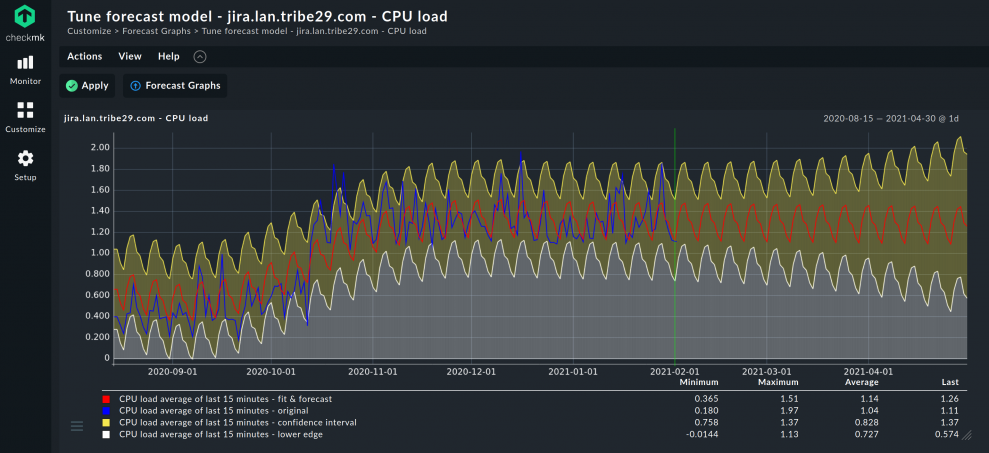
- Predict the future – Advanced forecastings for metrics
- Labels everywhere: More context and flexibility when using labels
- Improved reporting for managed service providers
Improved usability with the new Checkmk user interface
One of the goals of our completely new GUI is to make it easier for users to intuitively find their way around Checkmk. For this, we have simplified the navigation, which will now be primarily performed via the navigation bar on the left side. The sidebar on the right side will be used mainly as a status indicator in the future - this sidebar can also be shown or hidden with the click of a button, or arranged to the left side.
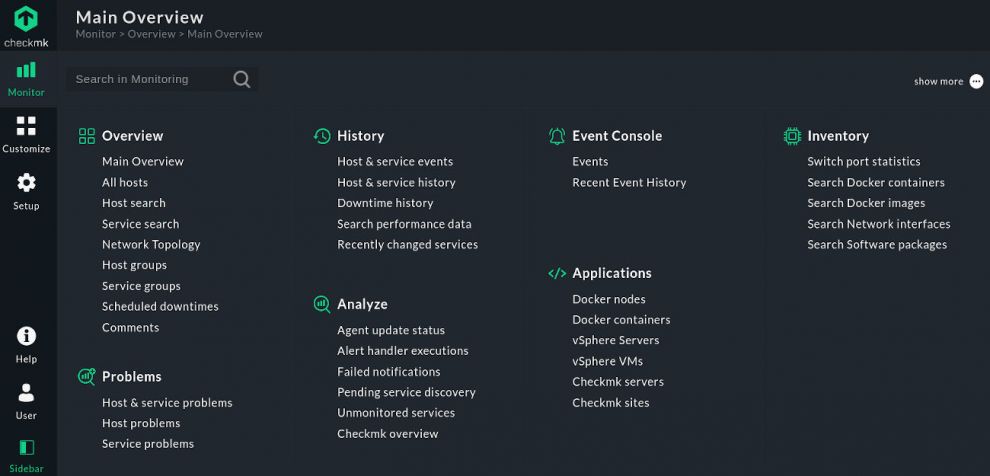
For example, the Monitor menu function in the navigation bar lists the content that was located under the snap-in Views in the previous version of Checkmk. The integrated search performs the same functionality as the previous Quicksearch - you can search for services, hosts and labels.
In the Customize menu, users can easily customize their Checkmk instance to suit their needs - there, for example, they can create individual dashboards. This is where you can also access the normal reporting and SLA reporting (Enterprise Edition only).
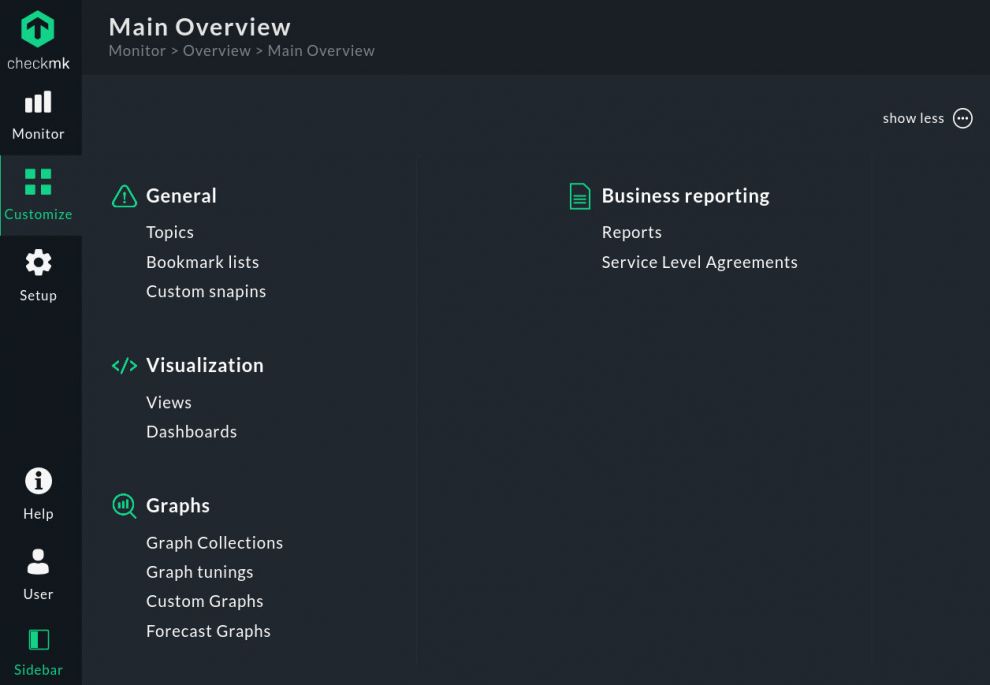
The WATO has also been renamed as of Checkmk 2.0. In the future, all WATO modules will be found under the menu item Setup. A new, powerful search function has also been designed to speed up working with Checkmk. New features allow you to search for all kinds of rules and global settings, but also hosts to quickly get things done.
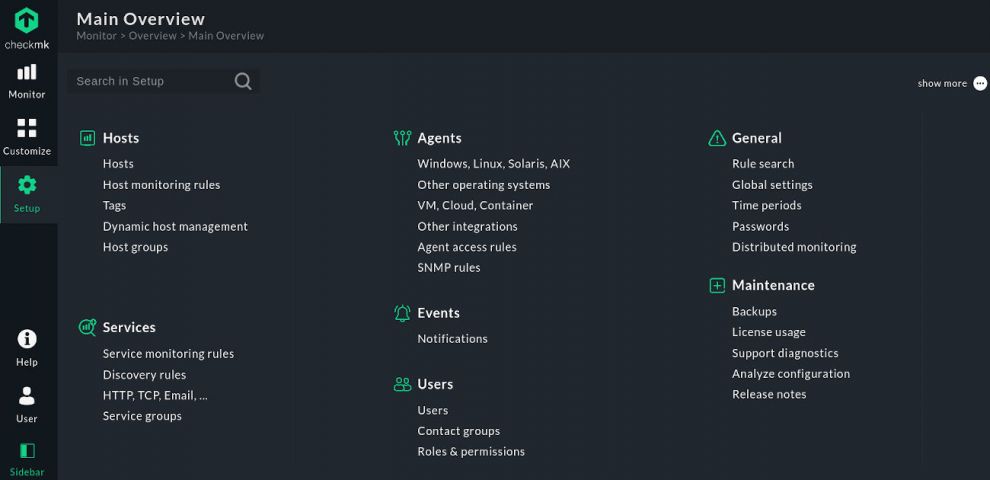
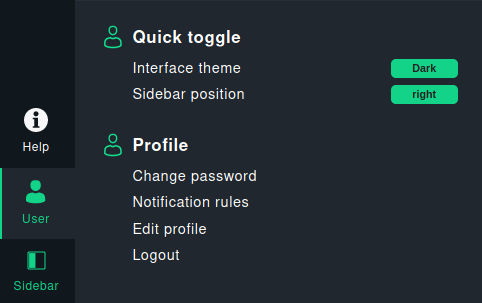
Under User the user can easily switch between the Dark or Bright themes, or the Beginner or Expert Mode modes (Edit profile). If a user is migrating from an older version of Checkmk, the expert mode which displays all functions is active by default. In a new installation, on the other hand, Beginner Mode will be active, so that some functions - those more important for advanced users - will only be displayed after clicking on 'show more'. This should make it easier for beginners to find their way around Checkmk more quickly.
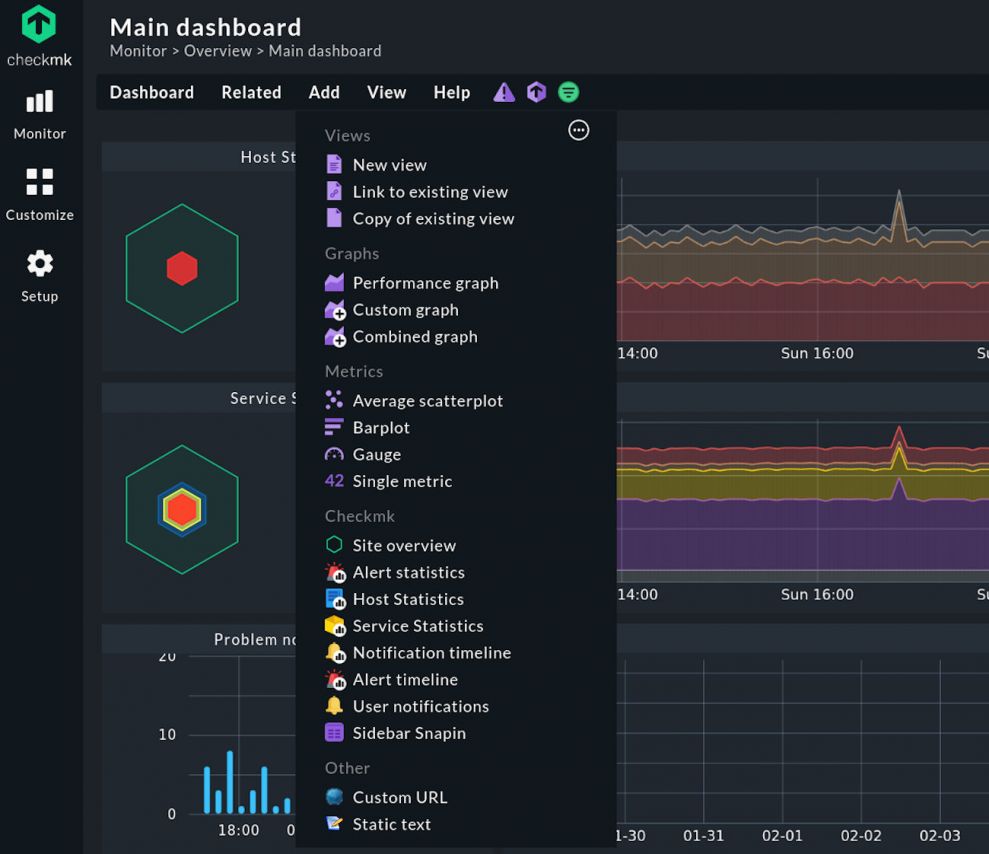
We have also improved and expanded the context-sensitive in-page menus in the new version. These menus contain all of the actions that the user can perform on a view or page, such as scheduling downtimes or calling up the host configuration. Breadcrumbs are also designed to help users know at all times where they are in their monitoring environment.
Everything in one view: new standard dashboards
The new overview dashboard in the Checkmk Enterprise Edition is there to provide a good overview of the entire monitoring environment – especially in distributed instances. With the new version we are now also introducing a new Checkmk server-oriented dashboard. This will now incorporate all sites, together with all of their important performance metrics. In this way you get the most relevant information about your Checkmk servers (e.g. OS, load etc.) and sites (e.g. number of hosts/services, version, usage metrics, state of site processes).
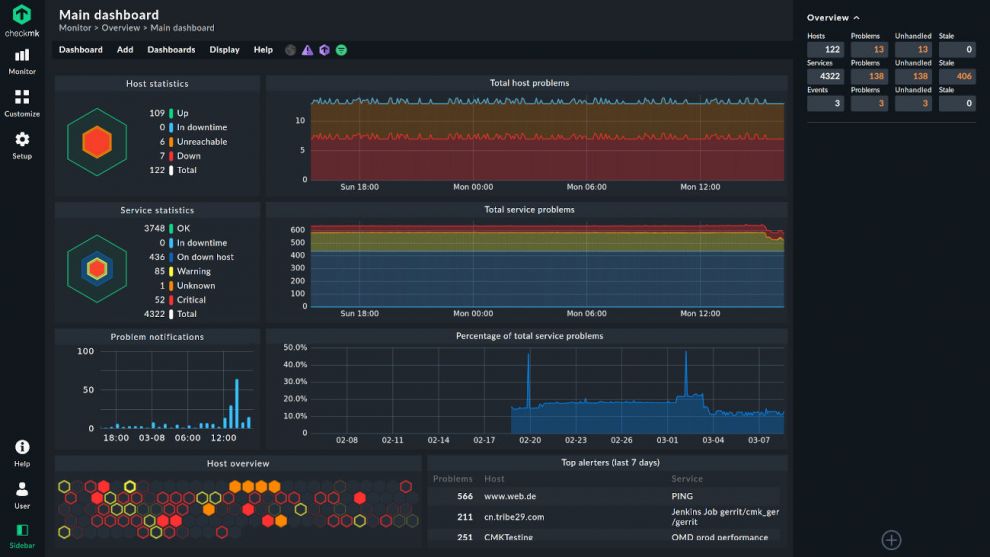
Customize your monitoring: Building great dashboards with new powerful visualization options
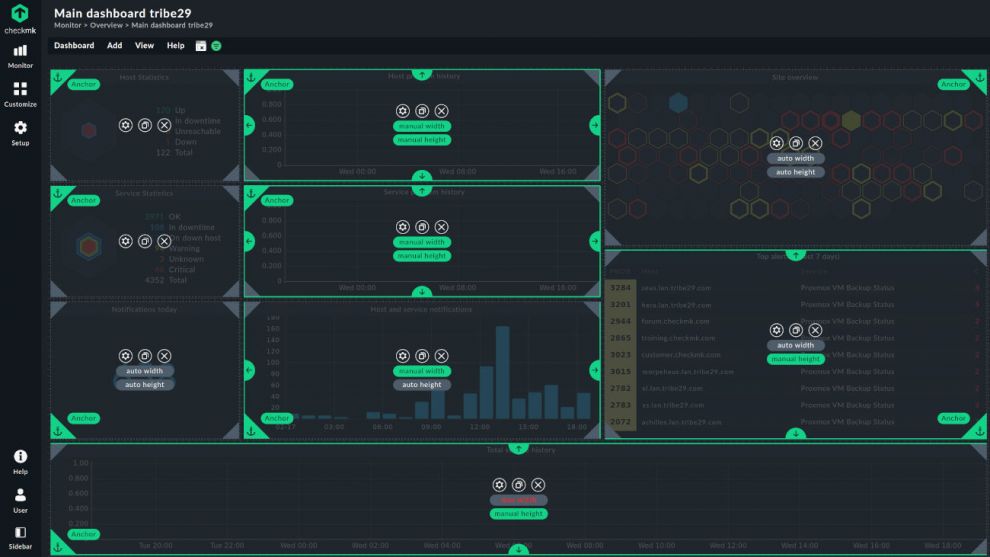
As already mentioned above, we have improved the look and feel of our dashboards on the one hand - but also revised their ease of use of the dashboard creation for the user. Our dashboards have a sophisticated algorithm that renders them to the user's individual screen size. The algorithm has two modes – either the user can manually control the dimensions of a dashlet, or the algorithm will automatically handle the resizing.
However, it is also possible to use both modes by having the user manually size one side and have the algorithm automatically adjust the other side. We haven't completely changed the mechanism with Checkmk 2.0, but we have tried to make it more intuitive for the user. For example, it should now be obvious at first glance which side of a dashlet can be sized manually or automatically. Furthermore, the mode can now be easily changed with a click on the respective page.
The new features also include new dashboard elements for the Enterprise Edition that allow you to create custom dashboards with various graphs and values. Among other things, there is a gauge view that displays a specific metric and which has further additional features such as a histogram. In general, we have revised and simplified the way dashlets are configured.
With the exception of time series charts, Checkmk has lacked the ability to visualize data in other ways. With the new version 2.0 we have broadened the possibilities for visualization with several options:
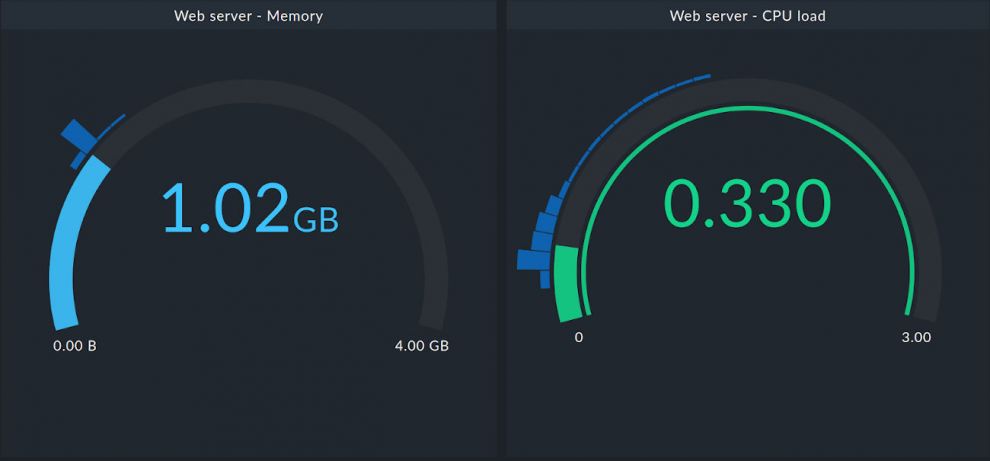
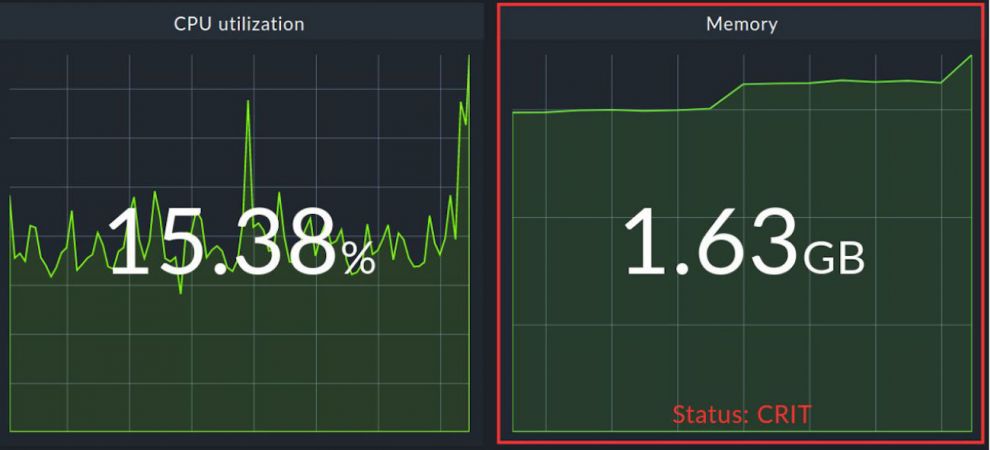
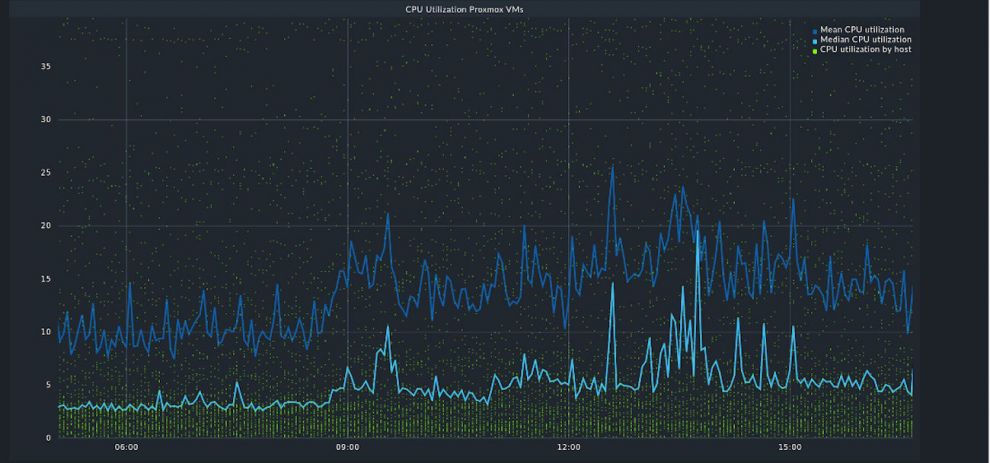
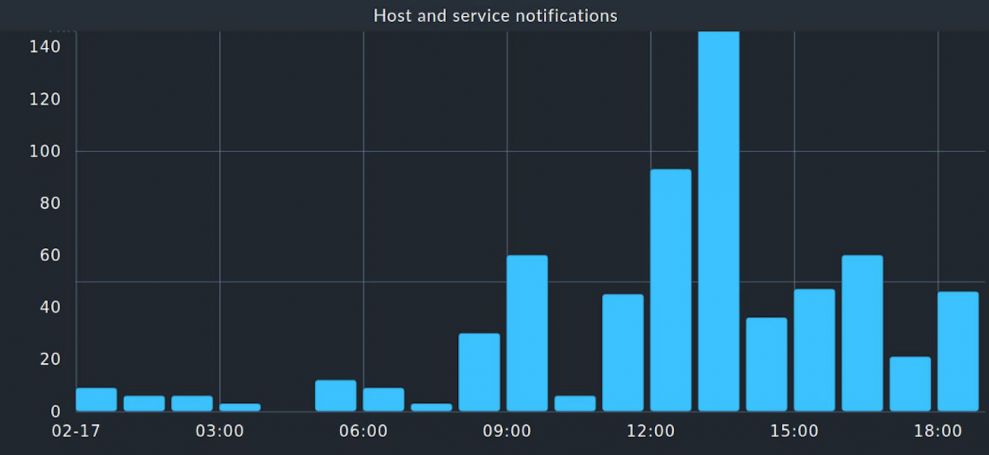
Before Checkmk 2.0, the user had to create and clone a view to be able to see a dashlet in their dashboard. All subsequent changes to the view had to be done twice – in the view and also in the dashboard. With the new version, the user now has the ability to reference existing views with a new dashlet - without having to clone them first. This means that a change made to the view is now automatically propagated to the dashboard.
One dashboard to rule them all: Be clever using dynamic filters
Many Checkmk users run multiple instances of the same system type. For example, if a user hosts ten Oracle databases and wants to have a separate dashboard for each one, it can be very annoying for them to have to create each of these dashboards from scratch or to have to copy them each time.
For this scenario, as of Checkmk 2.0, we have introduced a new filtering mechanism that allows the user to create a single dashboard template, such as an 'Oracle Overview Template'. Now, if they want to look at their "Oracle Database5", they can simply add the filter criterion to the desired filter type when invoking the dashboard. Checkmk will then render the dashboard for that specific instance. If the user is an administrator for that instance and thus may only be interested in that instance, they can also bookmark the filtered dashboard for faster access.
Eye Candy for metrics – Modern graphing for the Raw Edition
In addition, we have modernized the graphs in the Checkmk Raw Edition. That is, we have replaced the previous PNP4Nagios graphs with the HTML5 graphing from the Enterprise Edition. However, the graphing system of the Raw Edition will not contain the complete functionality of the Enterprise Edition, but it will offer the features that the previous PNP4Nagios graphs contained. Combining graphs or the forecast graphs, for example, will still be limited to the Enterprise Edition.
In the future it will be possible to connect the Raw Edition with Grafana. This was previously restricted to the Enterprise Edition only. The Grafana connector will have the same features as in the Checkmk Enterprise Edition. Furthermore, we have modernized the Grafana connector to improve its security and stability.
The forecasting function – Advanced forecasts for metrics
Last year, with Checkmk 1.6 we introduced the ability to make predictions about the evolution of certain monitored metrics. Since the forecasting feature was based on third-party math libraries, the installation was a bit cumbersome. We have changed this again for version 2.0, by reducing the third-party libraries to the bare minimum. We can now deliver this feature natively in Checkmk without Checkmk installing many unneeded dependencies. In addition, we have once again simplified the use of this function.
The forecasting feature offers the capability of taking into account many of the influences that monitoring data show on a daily basis, such as periodicity. This means that different loads occur during the day and at night, as well as at peak times. Our model can handle all of these factors extremely well.
The forecasting function in particular is intended to help make predictions about the capacities required in an IT infrastructure. In this way, Checkmk should be able to identify possible bottlenecks in advance. To try out the forecasting function, users must navigate to a metric of their choice and then click on the metric's forecast icon. Various settings can also be made there.
More flexibility in the use of labels
With Checkmk 1.6, we introduced labels as an additional tag class. Checkmk already contained a similar concept before with the so-called tags. These could be added as an attribute to a host - with the special property that the administrator predefined the tag groups and tags.
A label, on the other hand, is much more flexible and a common concept in the cloud world. It is for example possible for Checkmk plug-ins to automatically assign a label to a host or service upon discovery. Since labels are becoming increasingly popular, we have now extended their use with Checkmk 2.0.
Checkmk 2.0 automatically detects labels and sets them for operating systems (Linux, Windows, etc.) and device types (firewall, switch, etc.) – based on the information it collects from hosts via agent or SNMP. By extending the discovery rules, it is now possible to set specific service labels for discovered network interfaces, for example, for all interfaces of a switch or specific ones for the uplink ports.
The process discovery works similar: for example, if a process named 'apache' on a host is detected, it could then label this host as a 'web server'. Based on these host labels, it is then possible to create views or rules. Checkmk 2.0 can additionally use these labels for notifications.
On the command line it will also be possible to perform exclusive label discoveries. This is important for bulk discoveries, for example.
Since many setups use our tags, we wanted to support the maintenance of tag configurations. For this, we have added a page that analyzes the usage of all tags in a Checkmk instance's configuration. This also includes an overview of all tags used, so it is easier to revise or clean them up.
Improved reporting for managed service providers
It is usual for managed service providers to provide their customers with reports on the quality of the services provided. At the request of our Managed Services customers, we have therefore improved the reporting functions of Checkmk. Moreover, these may also be relevant for users of the Enterprise Edition.
To make the reports more visually appealing, it is now possible to create title pages to preface longer reports, for example. The table of contents is also intended to help make more comprehensive reports clearer. Users of the Managed Service Edition will also be able to create a standard report for all of their customers. They will also be able to use customer-specific layouts for this report. However, this feature is limited to the Managed Service Edition only.
More information about Checkmk 2.0
For deeper insights into the many changes and features Checkmk 2.0 has in store, read one of our blog posts on a specific topic:
- Clouds and containers – monitoring of modern IT assets
- Network monitoring – deeper insights and improved configuration
- New APIs provide automation and more stability
- More power under the hood - improvements to the Checkmk core
- A broad foundation for your IT monitoring
You can also find more information about Checkmk 2.0 in the Checkmk forum in our documentation or on our YouTube channel.
