Note: The content on this page uses the former names of Checkmk editions. Checkmk Enterprise is now Checkmk Pro.
In this blog post, we present the various innovations in Checkmk 2.0, which above all significantly improve the performance of the monitoring. For example, the new architecture of the CMC (Checkmk Micro Core) reduces the memory and CPU footprint of Checkmk.
Up to 4x less memory consumption
In addition to all of the new functions already mentioned, we have also looked under the hood for Checkmk 2.0 and made some improvements, including to the Checkmk Micro Core, which is used in Checkmk Enterprise. The result of the core modification is that Checkmk 2.0 now needs up to four times less RAM than before at the same performance. For this we have completely revised the Helper processes.
The Helper architecture in Checkmk 1.6 used to look like this: The core submits a task to one of the Checkmk Helpers, for example, to perform a host query. After the Helper has received the task from the Micro Core, it starts to process it. To do this, it first collects the data from the desired host, for example via an agent or SNMP. The Helper then processes the result of the check from this collected data. This is then forwarded to the CMC, where it now flows in as a new service status. This entire procedure is a single process.
The problem with this is that these processes are very memory-heavy – especially in large environments. They also may need to wait for network I/O. As a result, these memory-hungry processes are idle while waiting for network I/O and are therefore inefficient.
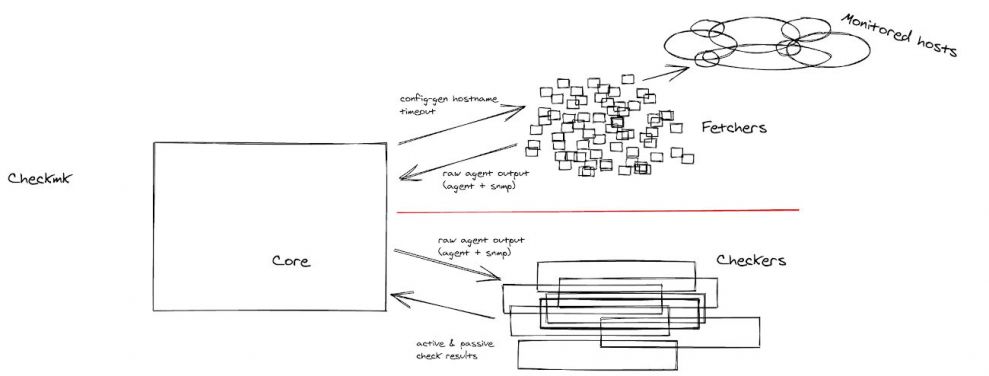
Thus, we have revised the architecture and split the whole process. In Checkmk 2.0 we obviously still have the monitoring core, but now we have two separate helper processes – the Fetchers and the Checkers.
The Fetchers are responsible for collecting the raw monitoring data, e.g. via agents or SNMP. Since these are very small processes, a monitoring environment can have a lot of them. They also require little memory, so waiting for network I/O is no longer a problem. When a Fetcher has received its data or a timeout, it forwards this to the Core.
The CMC then sends this data to the Checker processes, which are still very memory-heavy, very similar to the Helpers in Checkmk 1.6 as they, in addition to the raw monitoring data, also need to know about all check configurations. However, since the core provides the monitoring data, the Checkers can process it directly and provide the services status. Since the Checkers are no longer idle, Checkmk does not need as many of them and thus reduces its footprint on memory and CPU.
In the environments in which we have already tested the new architecture, we were able to reduce memory consumption by a factor of four. Conversely, this means that with the new architecture, up to four times as many systems can be monitored in Checkmk with the same CMC performance.
By default, Checkmk 2.0 has 13 Fetcher and four Checker processes. However, it is possible to make granular adjustments if the check latency is too high or if the Checker and Fetcher usage is too high. For example, by manually increasing the number of a pool to get the best possible performance for your monitoring environment.
Higher performance in distributed environments
In addition, we are also introducing further performance improvements as part of Checkmk 2.0. In distributed monitoring environments, the synchronization mechanism will work incrementally in the future. This means that the central and remote sites will communicate with each other before synchronization and then only exchange any modified configuration data.
In this way, making changes to a configuration in distributed monitoring environments should be much more efficient. Previously, Checkmk always synchronized the entire configuration package. The new approach thus requires less bandwidth and CPU power.
Resolving performance bottlenecks across the board
In addition, we have looked at many individual scenarios and examined how we can improve the performance for each particular use case as well as for monitoring in general. Our motivation is to sustainably improve the performance of Checkmk from the user's point of view by specifically analyzing different use scenarios of Checkmk in practice.
The result of this approach has been, for example, changes to almost all components, especially to the check engine and configuration processing, thus allowing faster rule evaluation for explicit host attributes, improved handling of a larger number of piggyback hosts, up to a hundred times faster updating of DNS entries of hosts, and six times faster loading time of the configuration. In addition, we have accelerated the rendering of high-resolution graphs in the GUI.
In the setup, we have improved the sorting of thousands of host tag groups as well as the host and service auto-completion. In addition, host-relevant pages now load faster and the rendering of long tables is now also faster. With Checkmk, we have also improved the search for rule sets with many time span references as well as contact, host and service groups.
More information about Checkmk 2.0
For deeper insights into the many changes and features Checkmk 2.0 has in store, read one of our blog posts on a specific topic:
- More modern, intuitive and individual – the new UX
- Clouds and containers – monitoring of modern IT assets
- Network monitoring – deeper insights and improved configuration
- New APIs provide automation and more stability
- A broad foundation for your IT monitoring
You can also find more information about Checkmk 2.0 in the Checkmk forum in our documentation or on our YouTube channel.


