Web Server Monitoring: A Complete Guide
Web-based applications and services are essential tools for modern businesses. Whether you use Asana for project management, Salesforce for customer relationship management (CRM), SAP for enterprise resource planning (ERP), or Slack for messaging, the importance of these applications and services for businesses can not be overstated.
The shift to remote work and the exponential growth of cloud-based services has led to a multifold increase in the criticality of web-based applications and services. Where do all these essential web-based applications and services reside? On web servers.
TL;DR:
Web server monitoring ensures that the servers hosting web applications and services remain reliable and performant.
- Monitoring tracks health metrics like CPU, memory, disk space, and SSL/TLS certificates, as well as performance metrics such as response times, request rates, and active connections.
- Proactive monitoring helps prevent service downtime, optimize hardware usage, and scale resources based on user demand.
- Alerts and dashboards provide timely visibility into issues, allowing IT teams to resolve problems quickly and maintain a smooth user experience.
What are web servers?
Web servers are dedicated platforms that host web services such as websites, web-based applications, files, and data. Just as email servers are optimized for email delivery and file servers are optimized for delivering stored files, web servers are optimized for delivering web pages, web-based applications and data to customers.
In addition to the physical hardware, a typical web server contains four components: the operating system, a web server software, a database and a scripting language. One popular combination of these systems is abbreviated as LAMP, which stands for Linux, Apache, MySQL, and PHP. Another popular combination is abbreviated as WAMP, which stands for Windows, Apache, MySQL and PHP.
What are the most popular web servers?
Several web servers are used throughout the world. Some of the most popular web servers are Apache, Nginx and Microsoft IIS.

What is Apache web server?
The Apache web server, officially known as Apache HTTP Server, is a free and open-source web server. It was released in 1995. Apache is developed and maintained by the Apache Software Foundation (ASF).
Apache is highly flexible and customizable; functionalities can be easily turned on and off. It offers modules for security, authentication, caching, URL rewriting, and several others. It also allows custom server configurations using the .htaccess file. Apache supports many applications including CMS, ERP, web frameworks and programming languages.
What percentage of web servers run Apache?
According to W3Techs, 23.3% (July 2026) of web servers run Apache.
What is Nginx web server?
Nginx (pronounced “engine-x”) is an open-source web server. It was released in 2004 and has become one of the most used web servers. Nginx is a complete solution for managing high-traffic websites. Many high-visibility websites and applications, such as WordPress and Quora, use the Nginx web server.
Its great success lies significantly in its ability to tackle the c10k problem — which stops some web servers from managing more than 10,000 simultaneous connections. It has two different versions: OSS Nginx and Nginx Plus.
What percentage of web servers run Nginx?
According to W3Techs, 31.8% (July 2026) of web servers run Nginx.
What is Microsoft IIS web server?
Microsoft Internet Information Services is a web server released by Microsoft in 1995. It was developed for Windows NT. Its modular architecture allows easy addition and removal of extensions and modules. It also includes multiple built-in security features and authentication mechanisms. Microsoft IIS is often used to host ASP.NET web applications and static sites.
What percentage of web servers run Microsoft IIS?
According to W3Techs, 3.2% (July 2026) of web servers run Microsoft IIS.
What are cloud platform web servers?
Web servers are increasingly being hosted on the cloud. Service providers such as Amazon Web Services (AWS) and Microsoft Azure offer cloud-based hosting for applications and websites. Benefits of cloud-based hosting include:
- No capital expenditure: the service provider bears all the cost of hardware.
- Pay-as-you-go: customers only pay for resources used on an hourly/monthly basis.
- Scalability: additional resources can be instantly allocated in response to a change in customer needs.
What is web server monitoring?
Same as monitoring any other server, Web server monitoring is the tracking of health- and performance-related metrics of web servers.
Some examples of health-related web server metrics are CPU usage, hard disk space, web server application status, and SSL/TLS certificates.
Some examples of performance-related web server metrics are active connections, incoming requests, load time and response time.
Why is web server monitoring important?
Your web servers deliver essential services to potentially millions of worldwide customers. You and your customers rely on the web servers for the delivery of those essential services. Web server monitoring allows instant visibility and enables you to keep a check on the health and performance of your web servers. This in turn allows you to
- take remedial action in case of hardware or software failure, and
- to take proactive action in case the hardware or software is overloaded and needs upgrades or replacements.
With web server monitoring, you get timely notifications that enable you to take timely action, which keeps the web servers up and running for delivering optimal performance for end users.
Services delivered over the Internet are usually not run from a single web server. For best performance, load balancing and to reduce load time, service providers deploy web servers at multiple locations so that you get service from the server nearest to you. Web server monitoring allows you to monitor essential performance metrics – such as load time and latency – for your regional and global web server deployments.
Web server monitoring also helps you determine which of your websites and web-based services are growing in popularity, i.e., user requests. You can then plan for scaling your websites and making other changes that will help you cope with the increased demand.
The same is also true for websites whose popularity is decreasing. With web server monitoring, you can identify and eliminate problems – such as increased load times – that cause your users to switch to other services.
What happens if web servers are not monitored?
If your web servers are not monitored, then you lack visibility into their health and performance. You don't know if the web servers are performing as required, or if users are suffering due to the poor performance of the servers. This can lead to degraded performance or service unavailability. Possible short-term consequences could be bad customer experience, leading to loss of customers and revenue. Possible long-term consequences could be loss of reputation, leading to lack of business viability.
What are the challenges of web server monitoring?
The biggest challenge of web server monitoring is to provide a good customer experience. The right monitoring tool, used in the right way, can help you overcome this challenge.
You can use web server monitoring to look at the big picture and at the details. The big picture looks at whether the service is up and running, and what the overall loads are on the different hardware and software components. When you go into details, you can look into specific metrics that provide an accurate snapshot of the user experience.
For example, if the monitoring tool tells you that the service is down, then you know that all users are affected. You can then look into the possible root causes and work to resolve the issue.
If, however, the service is available, and you notice an alarm that indicates that a certain number of users are suffering from high load times, then your approach would be different. The problem could be caused by a database issue, multiple web applications hosted on the same web server, or excessive load on one application. You can use monitoring tools to dig deeper to ascertain the root cause so that you can resolve the issue.
Therefore, the most important aspect of overcoming this challenge is to select the right server monitoring tool that provides visibility into every aspect of performance.
Checkmk is a tool that you can use to monitor infrastructure and applications. You can use it to monitor any kind of server. It is easy to use and supports auto-discovery and network mapping. Checkmk supports native agents for multiple operating systems including Windows and Linux, and agentless monitoring with SNMP, WMI, IPMI, or API-based checks. Checkmk also supports multiple vendors and the following Linux distributions: Red Hat Enterprise Linux (RHEL)/CentOS, SUSE Linux Enterprise Server (SLES), Debian and Ubuntu.
What are three things that you would want to monitor about a web server?
There are numerous server metrics that are important because of their effect on performance. We have picked the following three to focus on because they can have a significant impact on the customer experience.
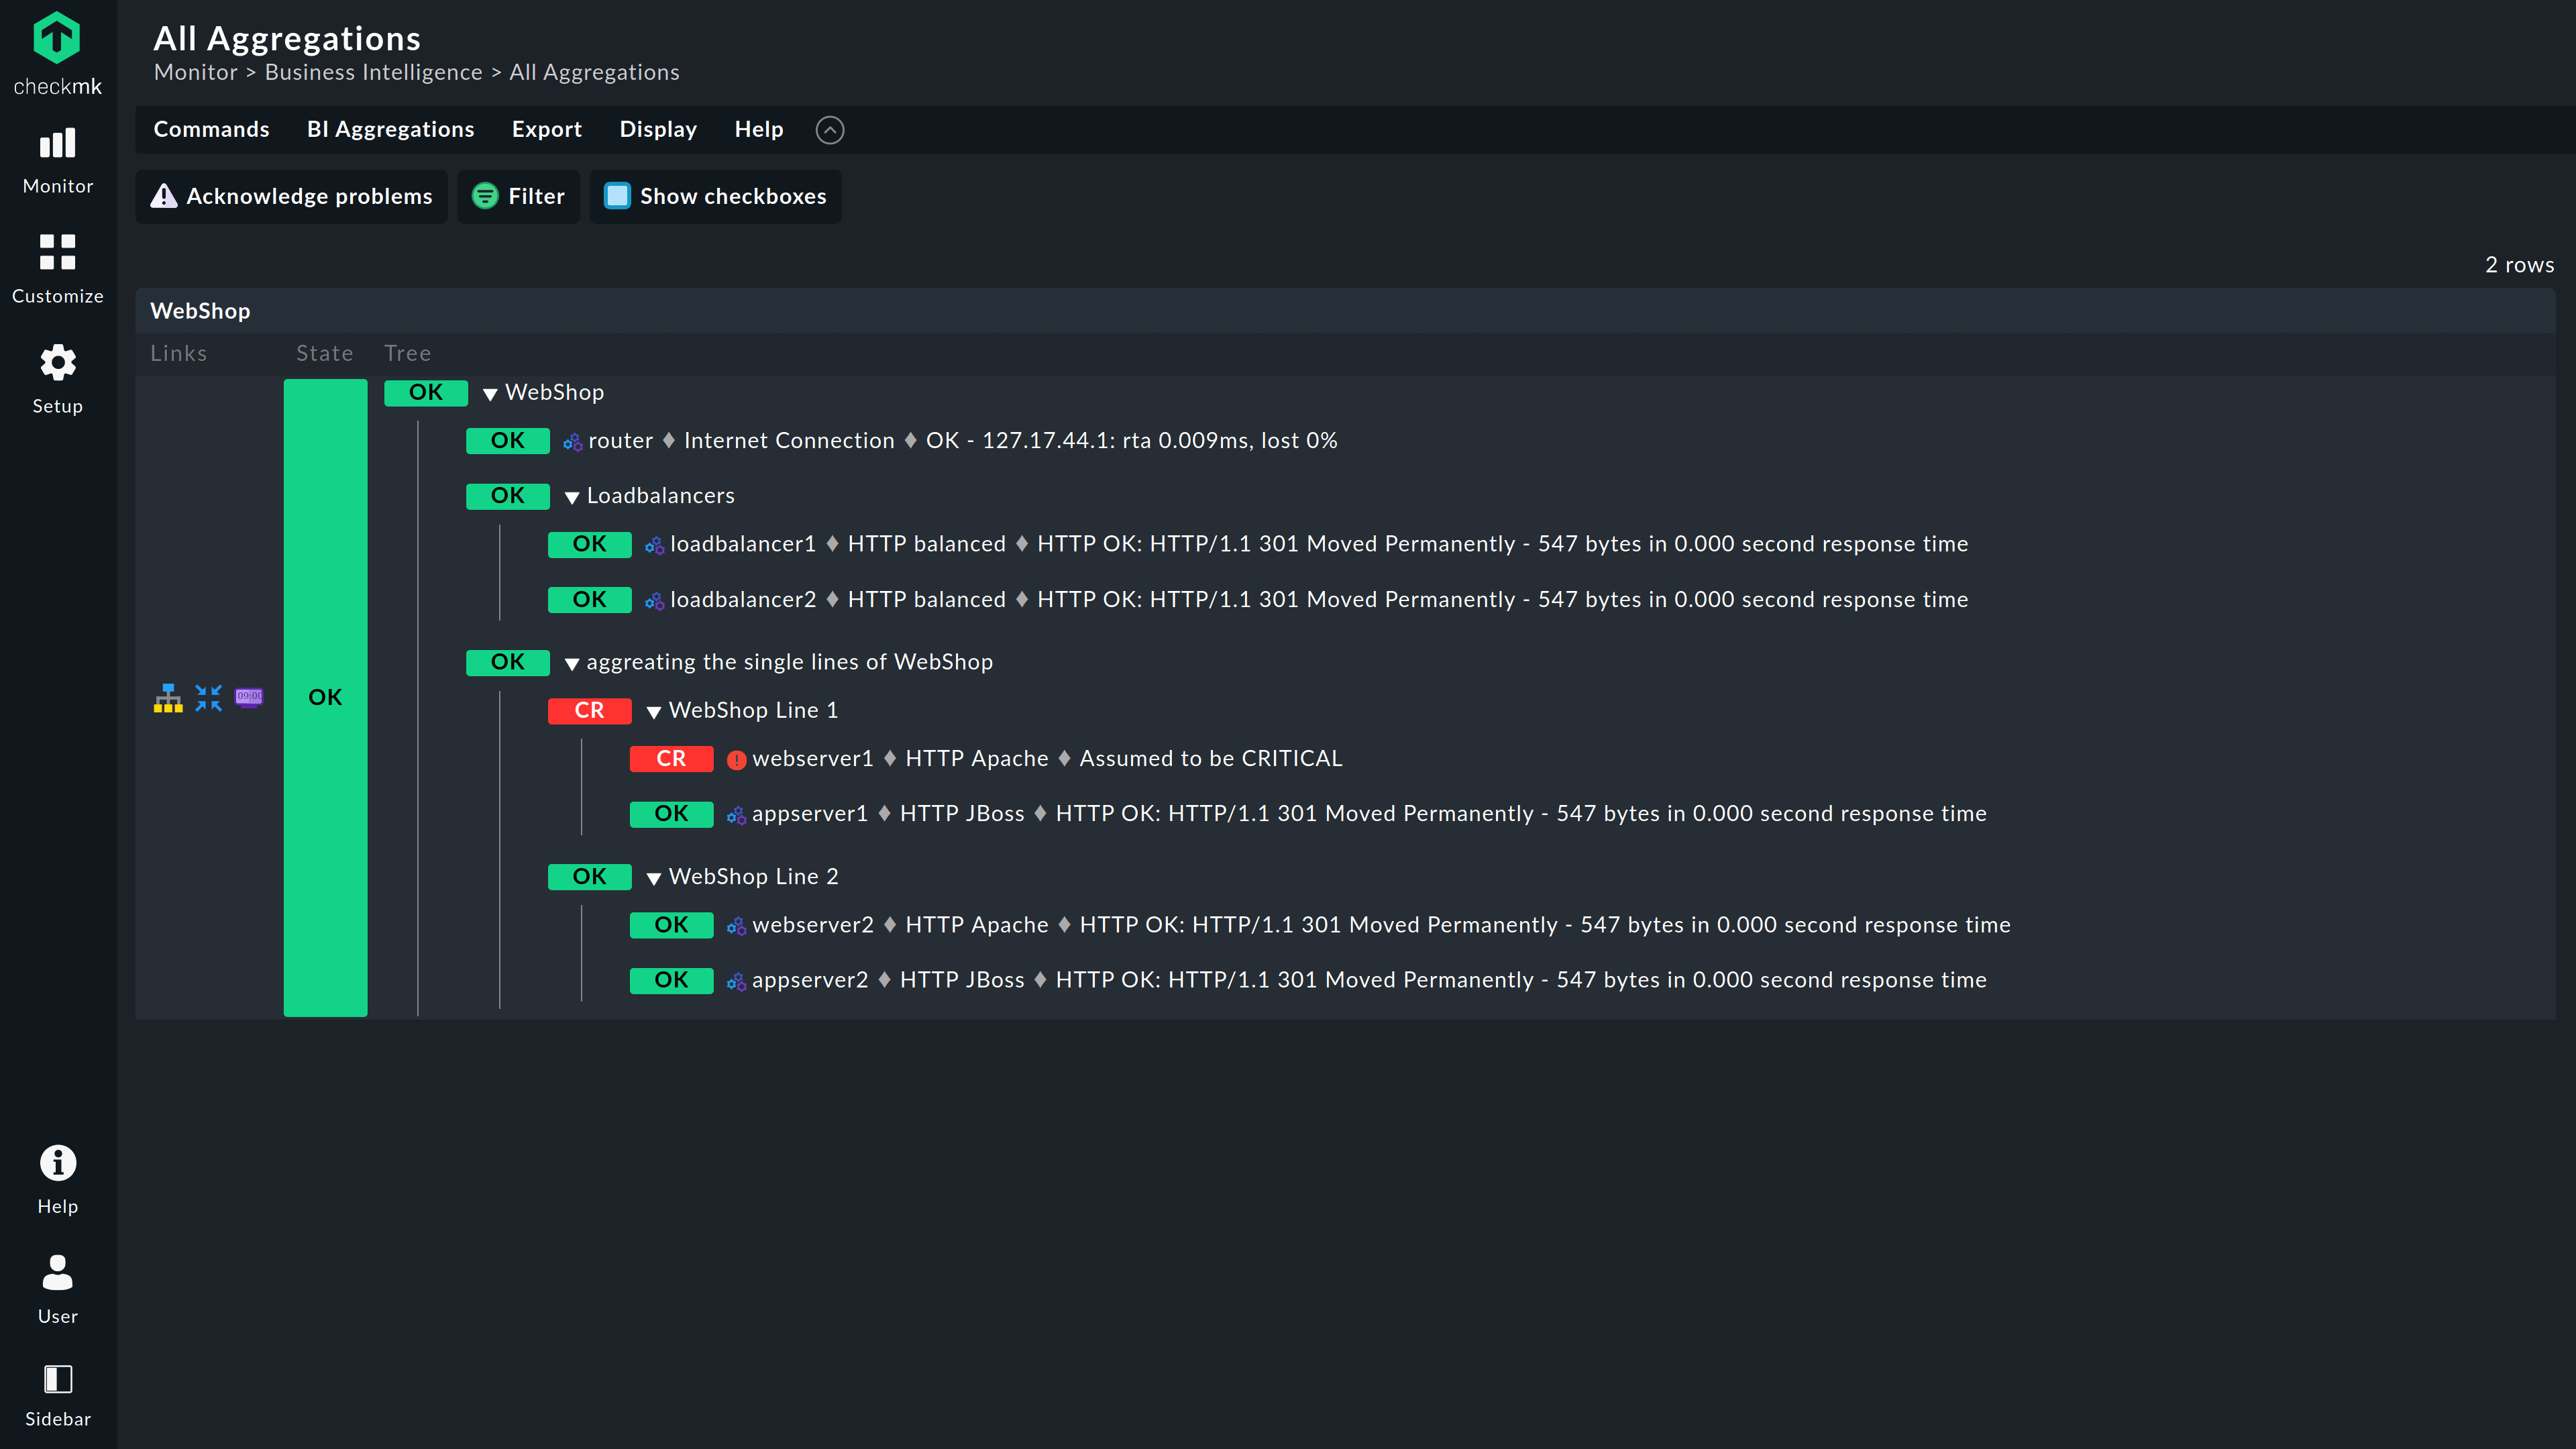
Service availability
You deploy web servers to provide a service such as a web page or web applications to customers. If the service is available, it means that your customers are able to access and use it. If the service is unavailable, then your customers cannot access or use it.
Web server monitoring gives you visibility into service availability. Through alerts, you are notified as soon as a service-affective issue arises. You can then take steps to resolve the issue to restore the service.
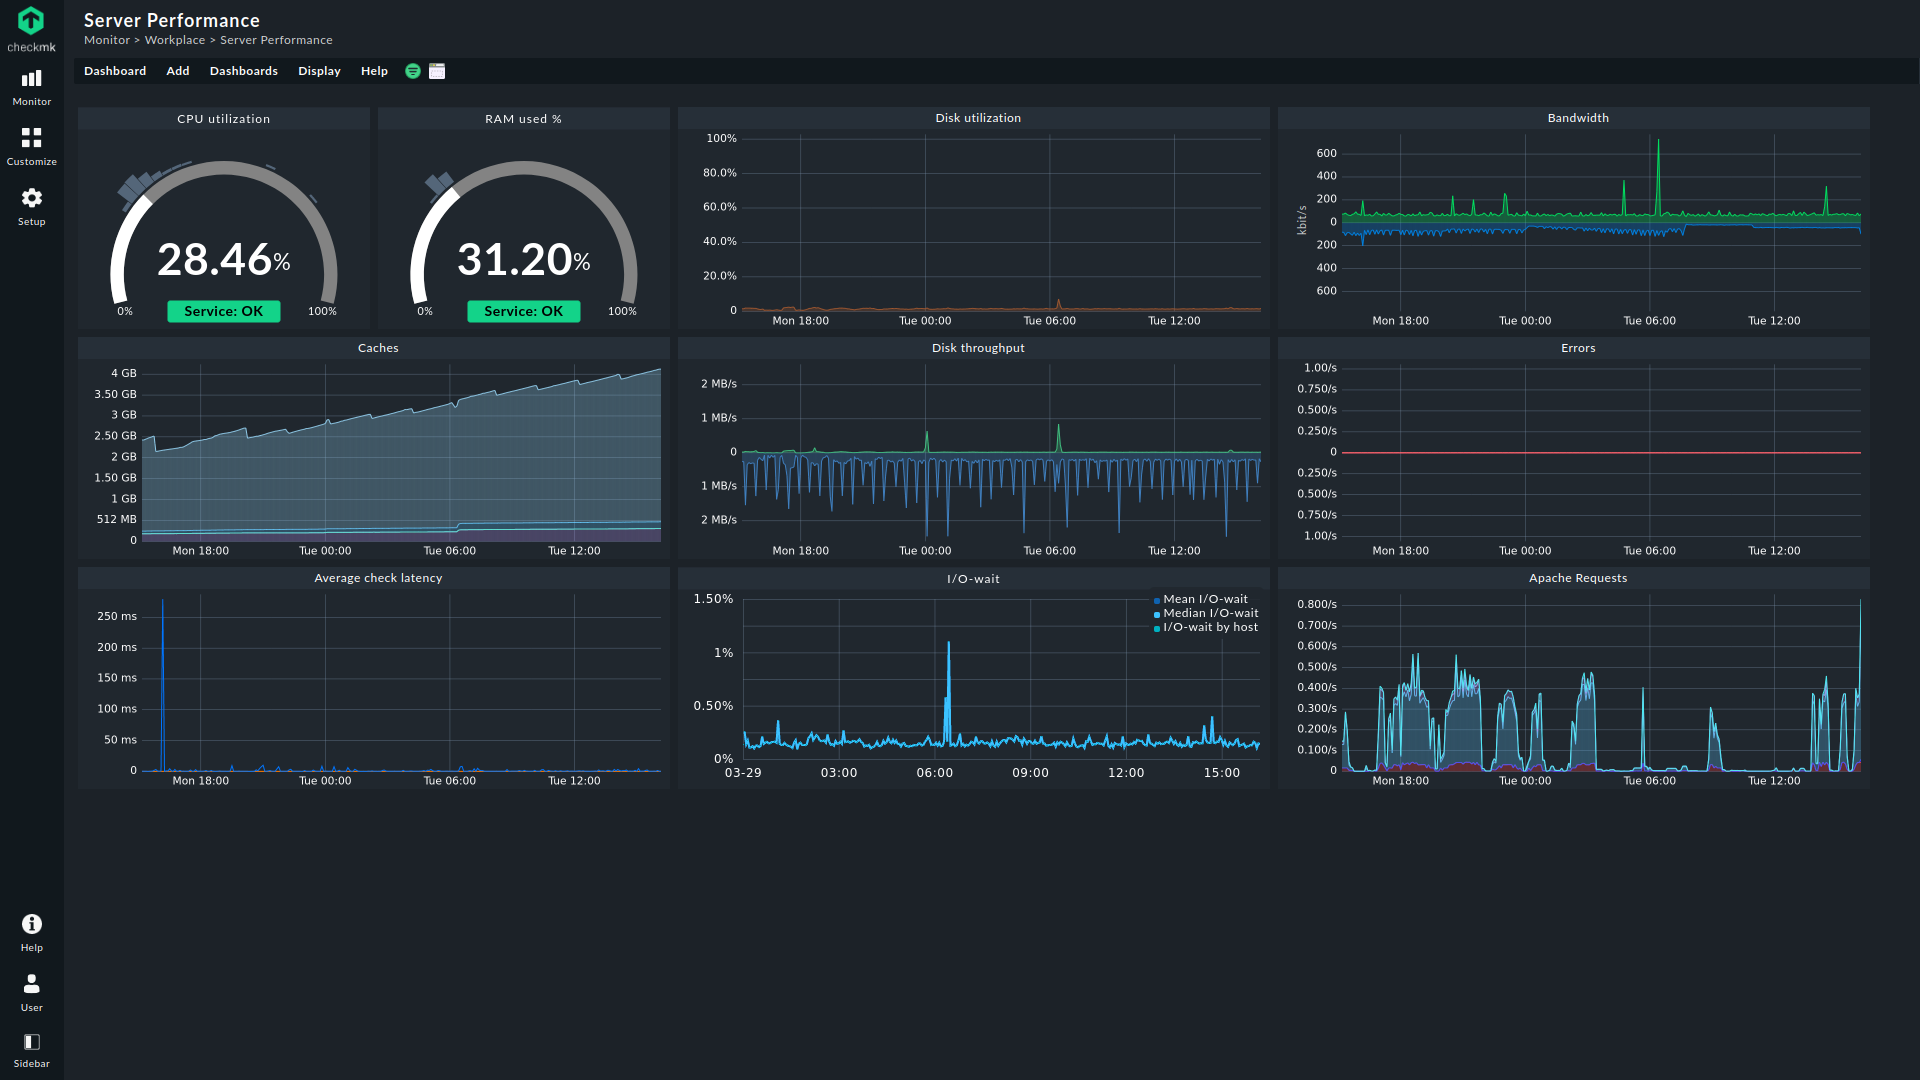
Hardware utilization
Hardware utilization refers to the utilization of host resources, where the host is the machine on which the web server runs as a service. These host metrics include the utilization of the CPU, memory and storage. If the CPU is overloaded, or memory and storage are nearing capacity, then it will affect the performance of the whole system. Users will suffer from slow response times or even service unavailability.
Monitoring of host metrics allows you to prevent issues before they arise. You can also make proactive plans for hardware upgrades, or if required, shift the service to a platform with better hardware.
Performance
Service availability looks at whether customers are able to access and use the service. Performance goes into more detail and looks at requests per second, average, and peak response times and other connection metrics such as requests and active connections that give you a quantitative estimate of the actual user experience.
If web server performance complies with your KPIs, then you don't need to take remedial action. If, however, your KPIs are not met, then you can take appropriate action to improve the customer experience.
What are web server monitoring tools?
Web server monitoring tools are specialized software that provide insight into web server health and performance, from the perspective of hardware, software, applications, and services.
These tools gather relevant metrics and display them in a graphical format for easy understanding. You can use these tools to generate detailed reports that show trends. This allows you to evaluate health and performance over a designated period of time.
You can also define thresholds for metrics of your choice and set up notifications. In this way, you will be informed and can take appropriate remedial action.
How does web server monitoring work?
Web servers such as Apache and Nginx report internal metrics via an HTML page. The servers also provide machine-readable versions of these pages. Tools like Checkmk periodically parse these machine-readable pages for metric collection. The collected metrics can also be combined to create custom metrics. The metrics are then displayed through different visualization options such as dashboards.
How to set up web server monitoring?
Every web server configuration is different and has its own operational requirements. The tool that you select for web server monitoring should satisfy your particular requirements.
Furthermore, the tool should be
- Easy to configure.
- Intuitive to use.
- Support integration with 3rd-party applications.
- Scalable.
What are the best practices for web server monitoring?
The following is a list of best practices for web server monitoring.
Use a tool with comprehensive monitoring capabilities
The best way to implement web server monitoring is through the use of a tool that offers all the monitoring features that you require. The tool should be able to monitor your web servers whether they are on the cloud, on your premises or on a virtual machine. The tool should give you the required level of detail so that you can make decisions based on valid insight.
Checkmk is a complete solution for IT infrastructure monitoring. You can not only monitor web servers with Checkmk, but also networks, applications, storage, databases, cloud, and the Internet of Things.
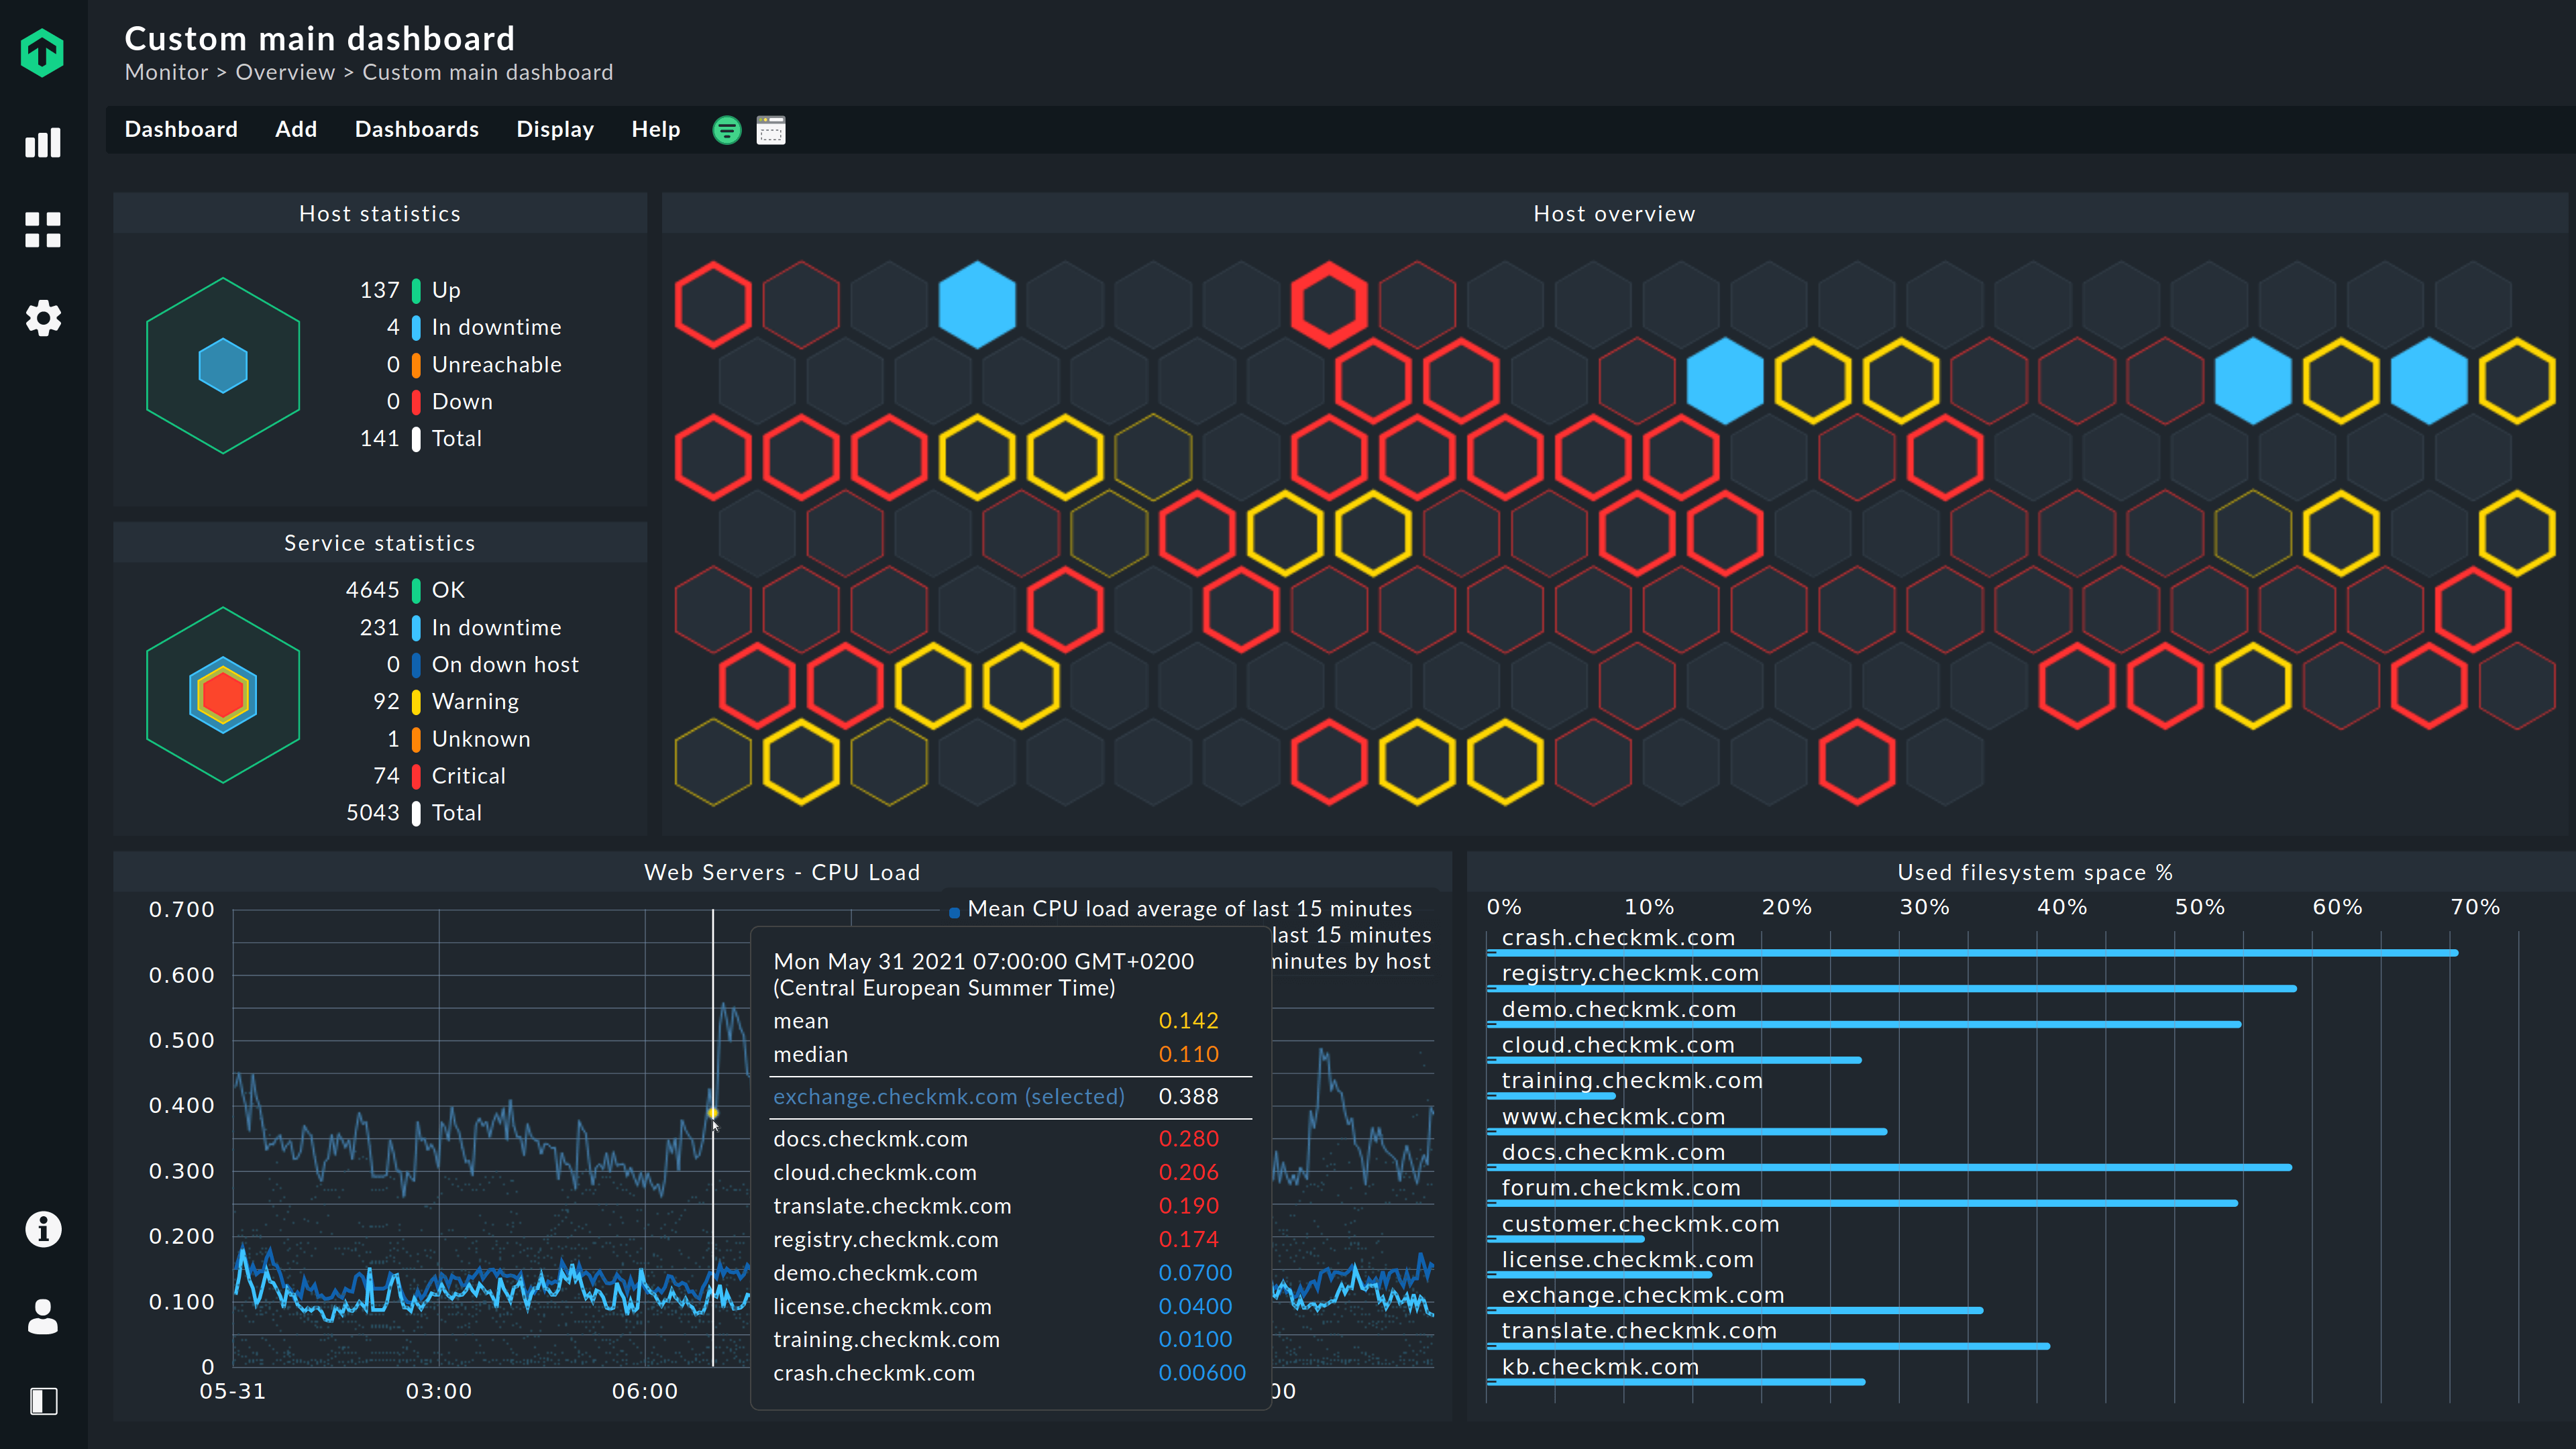
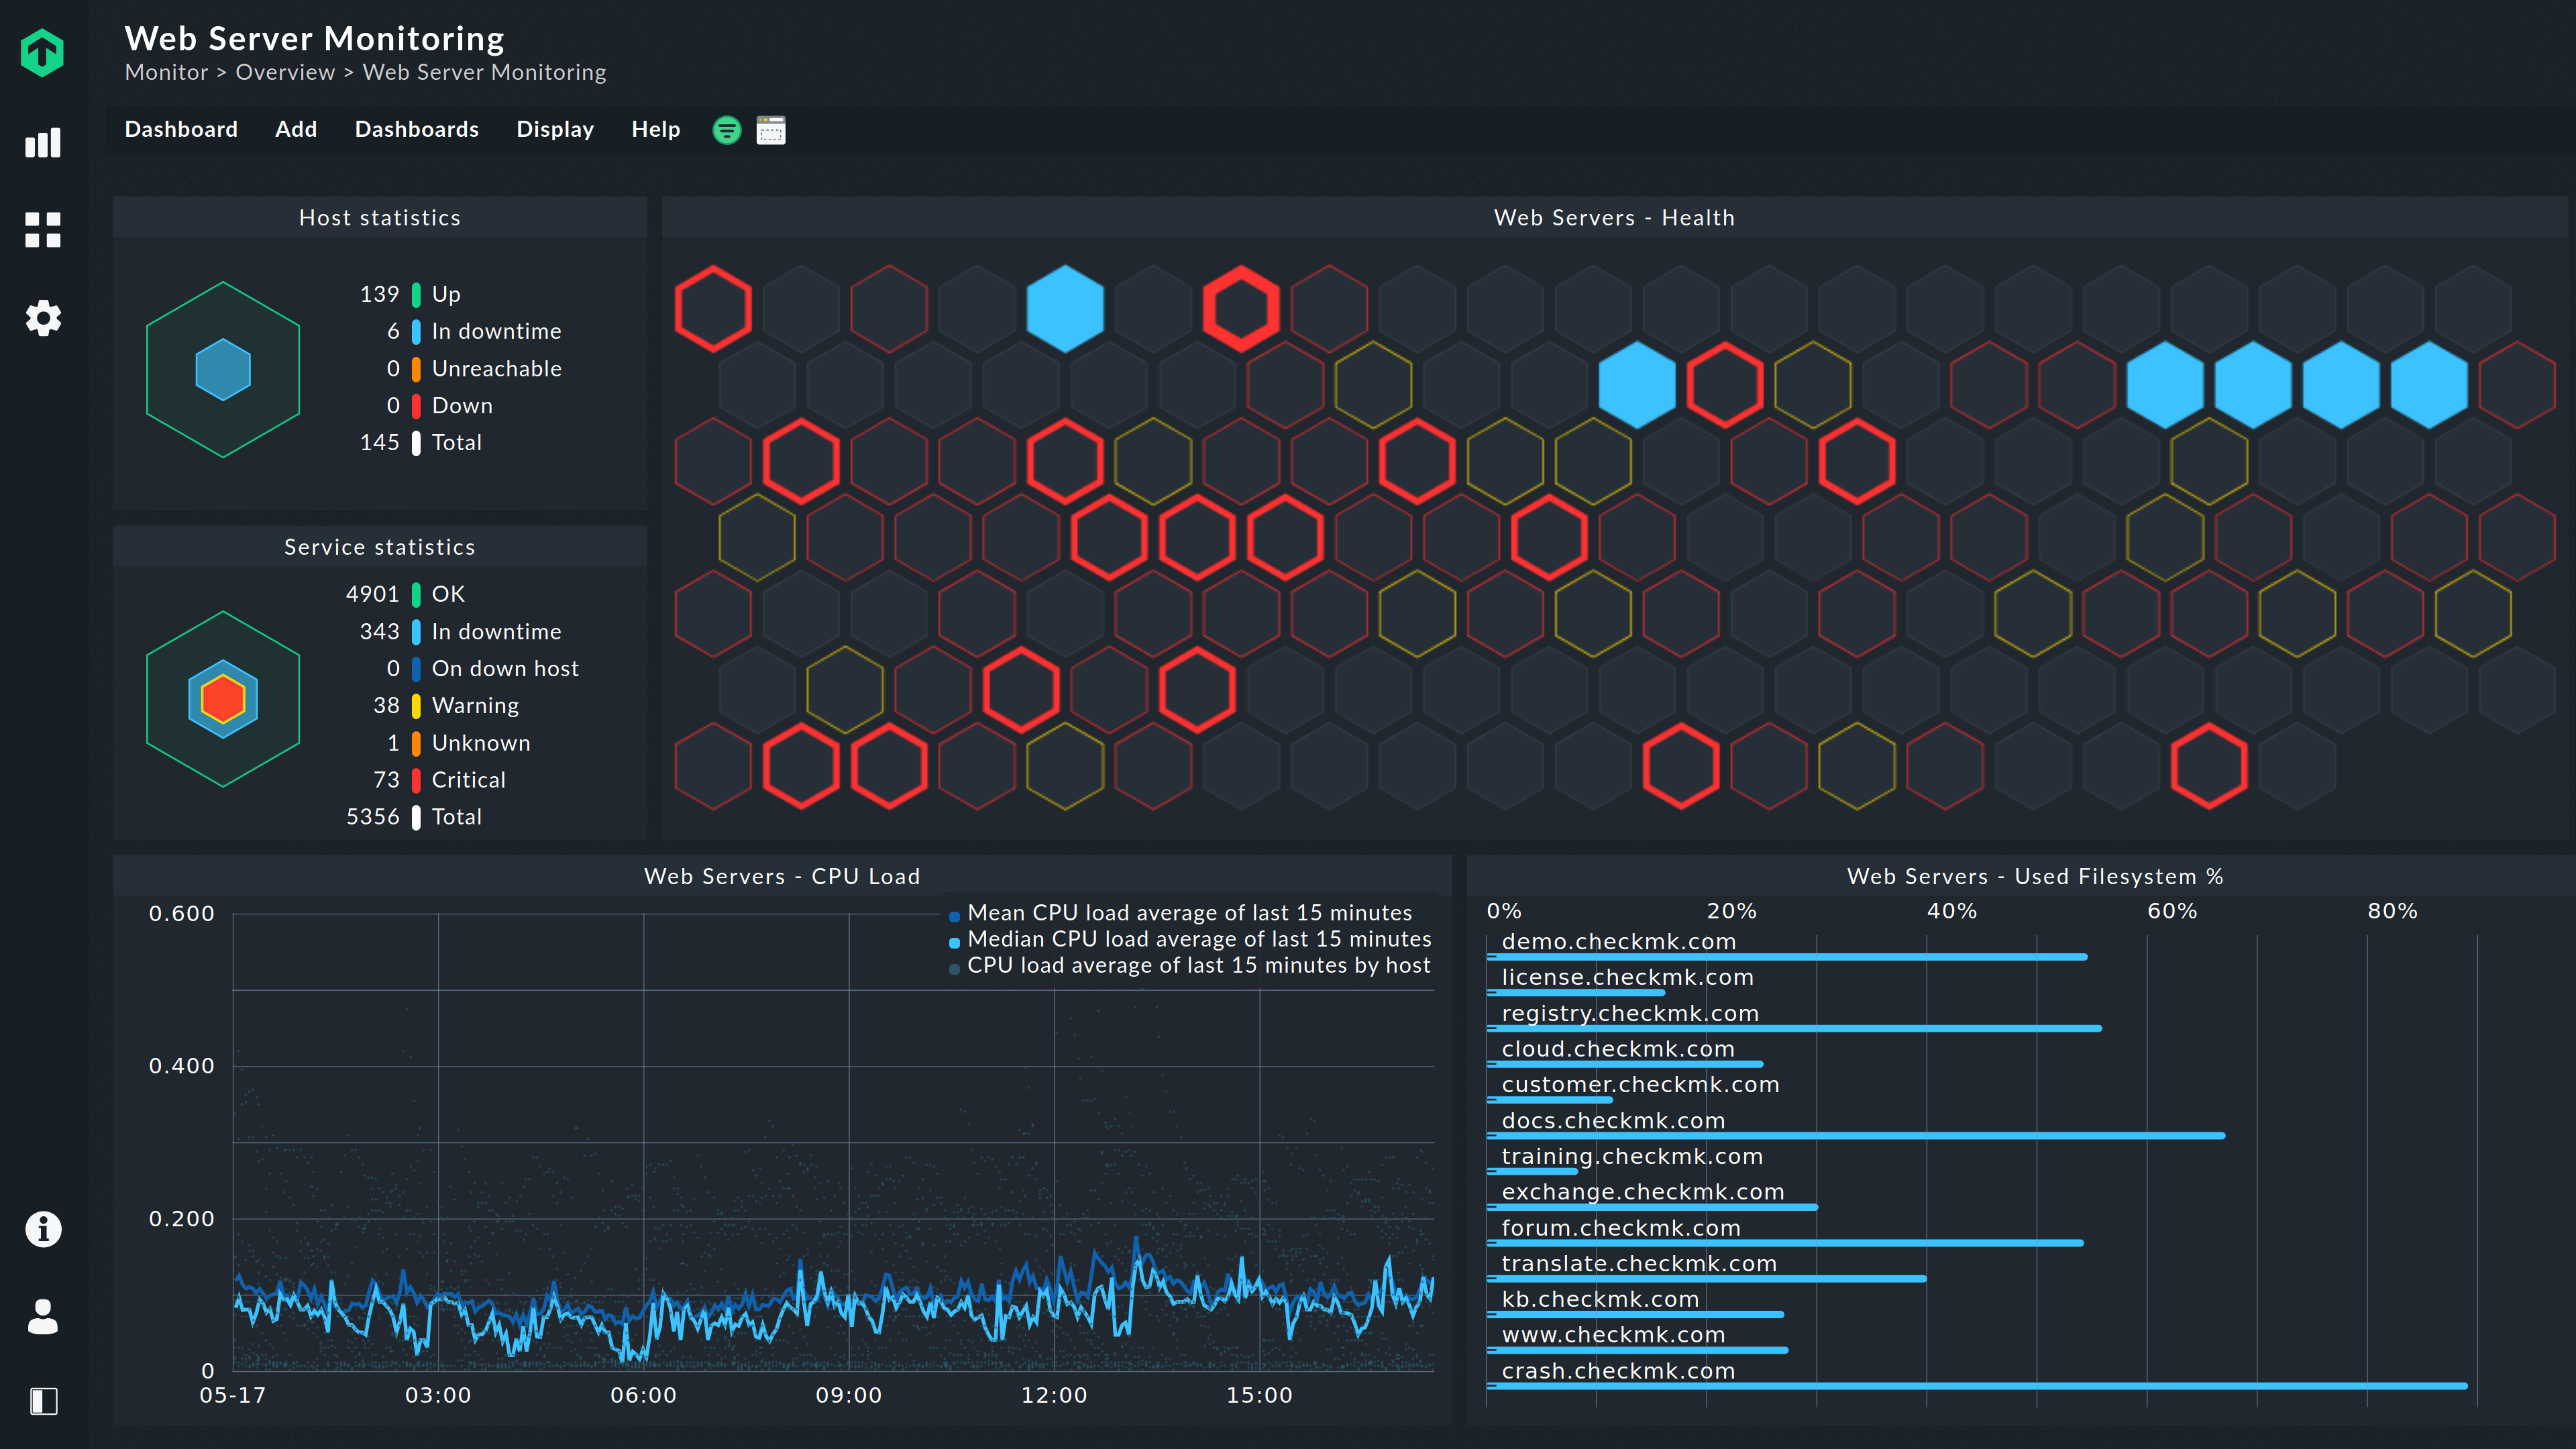
Set up dashboards
You can set up dashboards for your web servers that give you a clear and visual representation of the most important metrics. With one glance, you can decide if things are working well or if you need to take action to take care of an existing or developing issue.
Checkmk allows you to set up custom dashboards for metrics of your choice. You can set up multiple custom dashboards that focus on specific areas, for example a dashboard for hardware performance, a separate dashboard for application performance and so on. This gives you tremendous flexibility in monitoring, which you can use to pinpoint service-affecting issues and resolve them in the least possible time.
Set up alerts and notifications
Setting up alerts and notifications that are tailored to your requirements allows you to increase efficiency and save time. You can set up thresholds for metrics that are optimized according to your operational requirements.
How do alerts help to save time? When you receive an alert, you know exactly which metrics are exceeding their thresholds. This allows you to focus on and troubleshoot the possible causes for those particular alarms, and avoid spending time on irrelevant issues.
How do alerts help to increase efficiency? Without alert-based monitoring, some resources would be dedicated to keeping an eye on the monitoring system 24/7. With alert-based monitoring in place, IT resources can be engaged in other productive activities such as planning, network roll-outs and expansions.
When setting up alerts, it is important to make sure that the alerts are sent to the IT resources that understand their significance and can take appropriate action. It is also important to send alerts through the appropriate communication channels – SMS, email etc. – so that they are received in time and acted upon.
FAQ
What are examples of connection metrics?
Every connection made to a server leads to the transfer of data between the server and the device making the request. Connection metrics include:
- Request rate: the number of requests received per unit time. An increase or decrease in the request rate indicates a corresponding increase or decrease in traffic.
- Response time: the time taken by the server to respond to a request. High response times could be caused by issues with the web server, host, or the network.
- Active connections: the number of user requests currently being handled by the web server. A very high number of active connections points to high web server load. This could prevent new connections and or increase response time for active connections.
Why is monitoring SSL/TLS certificates considered a critical part of web server health?
An expired or misconfigured SSL/TLS certificate triggers severe browser security warnings, completely blocking user access and damaging corporate reputation. Web server monitoring protects against this by tracking the certificate's validity window. Monitoring platforms like Checkmk use active connection checks to pull certificate details directly from the network port (e.g., 443). Administrators can configure specific thresholds to trigger warning alerts 30 days before expiration and critical alerts 7 days before, ensuring ample time for automated or manual renewals. You can find detailed instructions on setting up these parameters in the Checkmk HTTP connection monitoring guide.
What is the C10K problem, and why does it affect how you monitor Apache vs. Nginx?
The C10K problem refers to the historical architectural challenge of a web server handling 10,000 simultaneous connections. Apache traditionally relies on a process-driven model (creating a new thread or process per connection), which causes CPU and memory consumption to scale linearly under high load. Nginx, conversely, uses an asynchronous, event-driven architecture that handles thousands of connections within a single worker process. When monitoring these setups, tracking host memory utilization and process/thread counts is vital for Apache to prevent resource exhaustion, while Nginx monitoring focuses heavily on active worker connections and socket queues.
How do HTTP status codes help pinpoint web application issues during monitoring?
While hardware utilization logs indicate server strain, HTTP status codes offer immediate insight into the actual software and application layer health. Web server monitoring tools parse web server access logs or send active synthetic requests to track these codes in real time:
- 4xx Codes (e.g., 404 Not Found): Indicate client-side issues, bad requests, or broken links within the website framework.
- 5xx Codes (e.g., 500 Internal Server Error, 502 Bad Gateway): Signal server-side application crashes, unhandled scripting errors (such as PHP or ASP.NET), or database disconnects. Tracking the ratio of 5xx errors relative to total requests allows tools like Checkmk to trigger instant alerts the moment an application layer failure occurs.
How do Checkmk and other monitoring tools collect internal performance metrics from Apache and Nginx?
Web servers do not expose internal metrics like active worker threads or requests per second via standard OS layers. Instead, they provide dedicated internal status modules that generate a machine-readable page containing live operational data. Checkmk utilizes specialized agent extensions that query these local endpoints, parse the raw strings, and transmit the organized data back to the monitoring server.