Note: The content on this page uses the former names of Checkmk editions. Checkmk Cloud (self-hosted) is now Checkmk Ultimate, Checkmk Enterprise is now Checkmk Pro.
With Checkmk 2.2, we not only extend Checkmk as a platform for hybrid IT monitoring, but also introduce a new product edition, Checkmk Cloud (self-hosted). In this blog post, we will highlight some of the enhancements in the new release. The release brings a number of improvements in the following areas:
TL;DR:
Checkmk 2.2 takes hybrid IT monitoring to the next level with the introduction of Checkmk Cloud (self-hosted), making it easier to manage cloud infrastructure.
- It now offers monitoring capabilities for AWS, Azure, and GCP, along with support for advanced cloud services, Kubernetes, and OpenShift, featuring ready-to-use dashboards and automated host registration.
- With push-mode agents and host lifecycle management, monitoring remains current even in dynamic or segmented environments.
- The latest updates include new automation features, a more user-friendly interface, expanded checks, additional integrations, and SAML support, all designed to enhance operations and security.
Cloud monitoring with Checkmk 2.2
A major focus of the new release is the monitoring of cloud workloads. Not only have we added or revised the number of checks for AWS and Azure for Checkmk Enterprise and Checkmk Cloud, but we now also support monitoring of Google Cloud Platform (GCP). In addition, Checkmk Cloud will be available through the AWS and Azure marketplaces. Read this blog post to learn why we developed Checkmk Cloud.
Lift & Shift with Checkmk Enteprise
With Checkmk Enterprise, we cover lift-and-shift scenarios in cloud infrastructures from GCP, Azure, and AWS. So if you are in the process of replicating on-premises infrastructure to a cloud environment from any of the three cloud providers, you can easily monitor it with Checkmk Enterprise.
With Checkmk Enteprise, we cover the following cloud use cases for all three hyperscalers:
- Compute/VM: Checks for EC2, GCE and Virtual Machine.
- Storage and Backup: Checks for S3, Cloud Storage or Blog Storage, for example.
- Database: Checks for RDS, Cloud SQL or DB for PostgreSQL, among others.
- Load Balancer: Checks for ELB, GCP Load Balancer and Azure Load Balancer.
- Management: Various checks for cost and health.
Monitoring with Checkmk Cloud
More advanced cloud use cases, such as the use of SaaS or PaaS products, are covered by the new Checkmk Cloud. It includes checks for monitoring use cases such as Functions, Containers and Kubernetes, Storage, Networking, Cache, App Integrations and Notifications. An overview of all Checkmk Cloud plug-ins can be found in the corresponding manual article.
Furthermore, in addition to the advanced cloud checks for AWS, Azure and GCP, other features are reserved for Checkmk Cloud. These are:
- Cloud-specific dashboards for AWS, Azure and GCP.
- Monitoring of OpenShift clusters.
- Configuration of a push agent.
- Auto-Registration of hosts.
Built-in cloud dashboards
The pre-configured dashboards included in Checkmk Cloud allow you to visualize the status and details of your resources in GCP, AWS, and Azure for an easy overview. In CEE, the following dashboards are included:
- EC2 and S3 instances on AWS.
- VM/Compute and Blog Storage instances in Azure.
- Compute Engine and Cloud Storage instances in GCP.
Monitoring agents with additional capabilities for the cloud
Compared to Enterprise, Checkmk Cloud offers additional checks and even more features for the monitoring agents. You can configure the monitoring agent in push mode or work with auto-registration.
The push mode
In the Checkmk Cloud, you can also configure the monitoring agent for Windows or Linux systems in the so-called push mode, in addition to the previous pull mode. This means that the agent autonomously sends the monitoring data to the Checkmk server. In pull mode, the agent always responds to a request from the server.
When the monitoring instance cannot access the network of the monitored host, such as in a cloud-based configuration or a segmented network, push mode is required.
The auto-registration
The auto-registration feature in Checkmk Cloud automatically adds deployed hosts to your monitoring without any manual interaction on your part. These can be objects created by AWS, Azure, or GCP, for example.
During auto-registration, Checkmk not only adds the host to monitoring, but also automatically performs service discovery and activates the changes. This automatically keeps your Checkmk cloud monitoring up to date with your dynamic cloud infrastructure. Using the Agent Bakery, you can also provide agent packages with the configuration for auto-registration in Checkmk Cloud, making mass rollouts much easier.
Host lifecycle management
Cloud environments are dynamic infrastructures, as the cloud system creates EC2 instances as needed and then deletes them when no longer needed. With the host lifecycle management feature available in both commercial editions, you can automatically remove vanished hosts from Checkmk if the monitoring server is unable to reach them for a specified period of time. This allows you to keep your monitoring of dynamic cloud workloads up to date, or to easily clean up monitoring after a major infrastructure update.
Run and backup in the cloud
Checkmk Cloud will be available on the AWS and Azure marketplaces. This allows you to create your own image of Checkmk Cloud in minutes. The marketplaces will always have the latest version of Checkmk available, including a 30-day trial and BYOL (Bring Your Own License) licensing.
In addition, with Checkmk 2.2, you can set your AWS S3 bucket or your Azure Blob Storage as a backup destination. This gives you the most convenient backup option in the cloud. However, you can also use the cloud backups as an offsite backup for your on-premises instance of Checkmk.
OpenShift and Kubernetes monitoring
Last year, with Checkmk 2.1, we gave you a deep insight into your Kubernetes clusters with a complete overhaul of Kubernetes monitoring. Now, with 2.2, we're adding support for OpenShift. This means you can now configure the special agent for Kubernetes to monitor your OpenShift environment. You can also use the Kubernetes monitoring dashboards that have been available since version 2.1 for your OpenShift clusters.
Separately, as of version 2.2, Checkmk also supports CronJob, Persistent Volumes, and Persistent Volume Claims in Kubernetes monitoring.
More automation for your monitoring
New features for the Rest API
The REST API, introduced in the 2.0 release, allows you to automate your day-to-day monitoring tasks. With 2.2, the API now supports additional endpoints such as SLAs, metrics, comments, site management and user roles, moving rules, and performing “Tabula rasa” in the service discovery. As a result, the REST API not only covers all the functionality of the legacy Web API, which is no longer supported as of 2.2, but also provides many more capabilities for monitoring automation.
Generic agents in the Agent Bakery
With the Agent Bakery, it is now possible to configure generic agents for any folder. This allows you to configure agents before any of the affected hosts are even registered, not only for cloud applications, but also for on-premises Windows image deployment. As of 2.2, you can also optionally compress packages with the Agent Bakery and select a target platform.
In Checkmk Cloud, agent packages can also be configured for auto-registration using the Agent controller auto-registration rule. This allows the packages to automatically register after installation.
Visible improvements in GUI
You will quickly notice many visual improvements when using Checkmk 2.2. This is not only due to the much better visibility of the buttons at various places in the GUI, such as in the agent bakery, on the configuration pages, or on the parent scan page.
With this release, we also increase the visibility of checkboxes in the drill-down menu, for example. Thanks to the new icon for toggle actions, you will be able to see whether a function is activated or not at a glance.
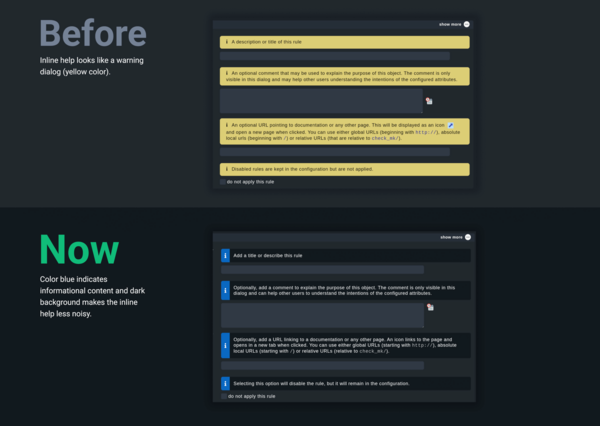
The inline help has also been given a more modern look, and is now presented in a more "informative" blue color.
We also redesigned the confirmation dialogs. This means that the buttons now have a more precise label, so that it is immediately clear what action you are about to trigger. This includes changing the name of the 'Abort' button to 'Cancel'.
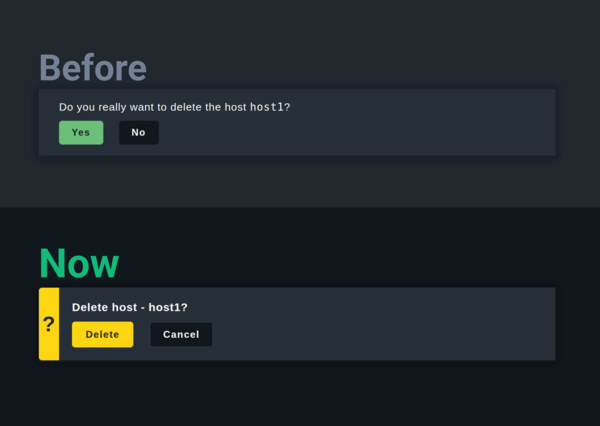
Revised host setup
We have added a single icon for the “Remove TLS Registration” action to better differentiate between the “Delete” and “Remove TLS Registration” actions. In addition, you can perform the “Remove TLS Registration” and “Detect Network Parent” actions directly on the host in the host overview.
You can also toggle host tags or explicit host labels to show or hide them. This allows you to decide for yourself whether you prefer a simple host overview or whether you want to know more information about your hosts.
When setting up a new host in 2.2, the "IP address family" field is no longer hidden under "Show more". In addition, the buttons on the page are now action-oriented and shorter named. This makes them more consistent with other actions in Checkmk.
After running Service Discovery, you also get the status of the data sources.
More intuitive configuration of monitoring
In addition, many other changes in Checkmk 2.2 further improve the usability of Checkmk and increase the value of your monitoring. For example, to find Dynamic Host Management, you can now search for "Piggyback" or "DCD" in the Setup menu.
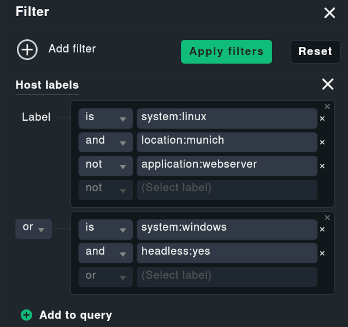
As of 2.2, you can filter host and service labels using Boolean logic with AND/OR/NOT. This allows you to refine the result list of your filters, e.g. to find all Linux servers located in Munich that are not web servers.
Frozen business aggregations
With the new Frozen Business Aggregations, Business Intelligence gets an additional feature. It allows you to visualize changes in your IT. Using frozen aggregates, you can click to compare the frozen status quo with the live version and immediately identify changes. For example, you can see whether nodes have been added to or removed from an aggregate and, at the same time, get an explanation for any changes in status that have resulted.
Joined inventory columns
With Checkmk it is now possible to combine data from different inventory tables in a single view and to extend this view with services. However, a prerequisite for such a combined inventory column is that the entry of the column from the other table that you want to use for the comparison is unique. In addition, this function is only available to you if you have selected an inventory as the data source. To learn how to configure joined inventory columns, see the manual article.
You can now also apply a regular expression when creating joined columns. For example, if you have hosts running either service A or service B, you can now use regex to resolve this and get the correct service for each host in a column. You can also use regex to display the service Processor Queue on Windows servers and the service CPU load on Linux systems in a joined column.
Another new feature is that you can now set custom titles for all types of columns. This applies not only to Joined columns, but also to columns or Joined inventory columns. This allows you to change the default titles to your liking.
Distributed monitoring environments easier to update
Updating Checkmk in distributed monitoring environments will also be much easier in 2.2, as the Checkmk extension package (MKP) management will support different versions in the future. This allows the central instance to maintain packages for remote instances that are still at the old version level, as well as those that have already been updated. This means that you do not have to update instances simultaneously anymore, but can update them in stages. As a result, you can resolve potential issues on individual monitoring servers before you update the next Checkmk instance.
Share dashboards, views and reports with others
Also, starting with 2.2, it is possible to share dashboards, views, e.g. together with a check, and reports with other users or instances as an MKP.
New checks and agents
Since version 2.1, we have made 174 improvements or added new checks and agents to Checkmk. We will only highlight a few here.
Monitoring Cisco Meraki
In 2.2, a special agent for Cisco Meraki monitoring has been added. It queries the back-end and front-end of the devices and adds information about the device status (online, alerting, offline or dormant), queries the temperature sensor of the devices and provides an overview of the Meraki licenses. In this way, Checkmk helps you get a better overview of your Meraki fleet.
Special agent for Ivanti Neurons for MDM: Compliance monitoring of your mobile devices
Customers who use Ivanti Neurons for MDM (formerly MobileIron Cloud) for their mobile device management can now use Checkmk for compliance monitoring of their Ivanti Neurons for MDM managed devices. The special agent retrieves data from Ivanti and allows you to set thresholds for things like compliance violations, patch and security patch levels, and client version, so you can use Checkmk to monitor the compliance of your mobile devices at any time.
Revamped NetApp monitoring
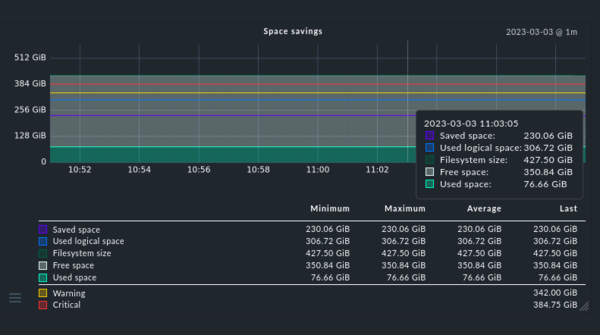
With this release, we have enhanced the monitoring capabilities of the special agent for NetApp. The agent now monitors not only the virtual ports, but as of 2.2 also the physical ports, so that you can keep a better eye on the HA of your NetApp systems and detect potential failures before they occur. In addition, Checkmk now better monitors volume efficiency. This means that you can now use Checkmk to see how efficient the "space savings" from deduplication, data compaction, or data compression are, helping you decide which is best for your NetApp-based systems.
More in-depth Graylog monitoring
The revised special agent for the monitoring of Graylog instances breaks down the JVM load on a per-node basis as of version 2.2. This was previously limited to the cluster level. This allows you to better balance the JVM usage of your Graylog nodes. You can also gain insight into the performance of individual nodes and set appropriate thresholds. The special agent also integrates Graylog alerts and events into Checkmk and lets you configure thresholds.
New checks for Primekey appliances
Checkmk allows you to monitor Primekey appliances. The new SNMP checks provide data on VMs, RAID, EJBCA, signservers, HSM status, CPU temperature, DB usage, fan speed and HSM battery voltage of your Primekey appliances.
Special agents support password store
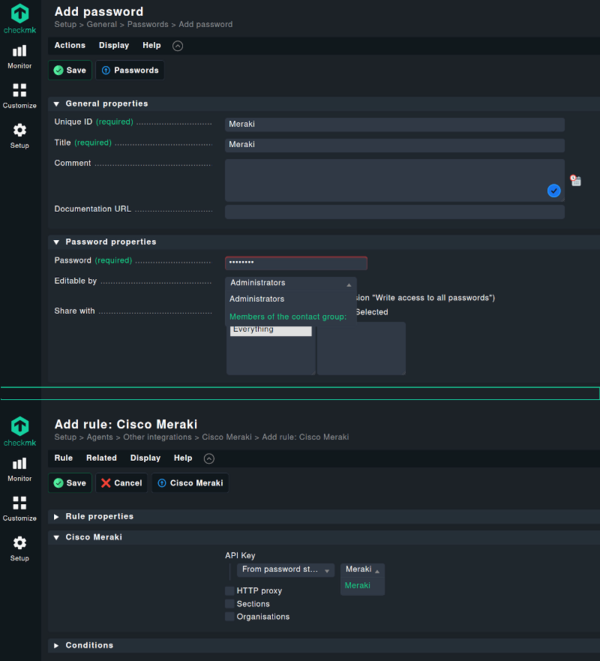
Starting with 2.2, all Checkmk special agents now support storing passwords. This means that for all passwords that are stored, you can define who is allowed to use the password and/or to change the password. The authorized person will only see the password ID you assigned when setting up monitoring via the special agents or Active Checks. In this way, no conclusions can be drawn about the password itself.
You can also see how strong or weak your chosen password is with the new password strength indicator.
New features for integrations
With version 2.2 we have not only extended the range of checks and agents, but also existing integrations. For example, the notification in MS Teams is new. But other existing integrations have also been revised with the release.
Grafana
Over the last couple of months, there has been a lot of work on the Grafana integration. Among other things, the Grafana plug-in now supports the REST API as well. Our Grafana plug-in release cycles are separate from Checkmk's. As a result, we release new versions of the plug-in at shorter intervals. The next version, 3.1.0, will be released soon. It will support variables as fixed or dynamic lists, allowing you to switch between objects to be displayed.
There will also be an integration with Grafana Cloud in Checkmk Cloud. This means the Grafana plug-in for Checkmk will be available through the Grafana Plugin Store, making integration with your cloud environment easy. The beta version of the Grafana Cloud integration will be available soon.
Graphite/InfluxDB
The integration with InfluxDB has also been improved to support batching and compression of data so that Checkmk sends the compressed data in bulk. The changes are a result of improvements to the Graphite/InfluxDB and rrdcached exporters. With 2.2, we have unified the behavior so that the data sets are always the same. Checkmk now also provides several metrics for troubleshooting RRDs (round-robin databases) in general. As a result, Checkmk gives you the insight you need to keep an eye on RRD processing performance.
SSO with SAML
Starting with version 2.2, SAML authentication is now integrated into Checkmk. The integration works with any configured MFA (Multi-Factor Authentication) setup and allows the configuration of SAML authentications as well as the assignment of SAML attributes to roles and contact groups via the GUI.
Checkmk Trial
Check out Checkmk 2.2 for yourself with the free trial version. Simply download Checkmk Cloud. It gives you the full functionality of the Checkmk Cloud for 30 days. After 30 days, you can continue to use Checkmk for free – as long as you don't monitor more than 750 services in one instance.

