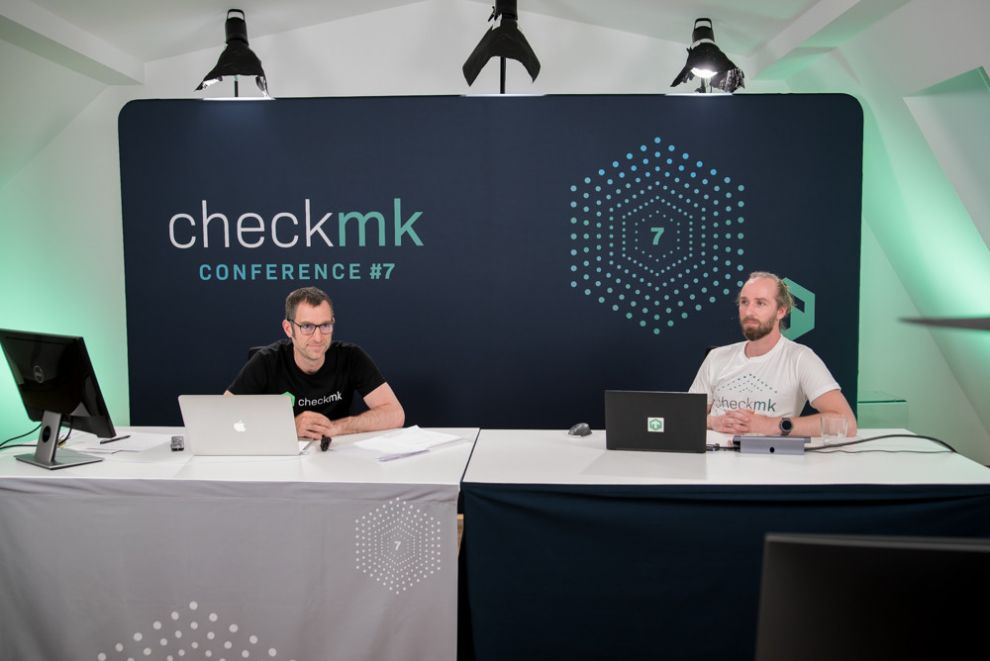
On the first day of the Checkmk Conference #7, everything revolved – as is traditional – around the latest Checkmk version. Checkmk 2.0, which was launched in March this year, is not only the biggest product release in our history, but its completely-redesigned interface and navigation also provides a completely new user experience for Checkmk users.
An essential feature of the new version was, among other things, the improvement of the dashboarding. With Checkmk 2.0, we have not only revised the look and feel of the dashboards, but also simplified their handling. Thus the first tech session of the conference was dedicated to the subject of how high-quality dashboards can be created with the new Checkmk version. tribe29 founder Mathias Kettner and Checkmk consultant Marcel Arentz used the example of a Linux server to show how impressive dashboards can be created in just a few steps thanks to the new dashboarding functions. For example, predefined time series graphs for a service can be assigned to a special dashboard via the action menu. In principle, the creation of dashboards is much easier than in previous versions due to the new navigation.

In addition to the easier handling when creating and configuring new dashboards, Mathias and Marcel also presented the four new dashlets. These give Checkmk 2.0 now even more options for the visualization of monitoring data in addition to already available views such as the tabular listing of items and the time series graphs.
For example, the new gauche element is suitable for displaying individual metrics that have an upper or lower limit, such as the current utilization of memory. This is in contrast to the single metric, which is designed for metrics that do not have such a limit, such as the up-time of a system. Both dashlet elements can be optionally enhanced with historical data. In the case of the gauche, this is a histogram that shows the average values over a specified period of time. In the case of the single metric, its historical progression is displayed. In addition, both elements optionally show the status of the associated service.
With the bar chart, Checkmk Version 2.0 also features a completely new option for visualizing data from multiple hosts. For example, the dashlet can be used to summarize the available hard disk space of various hosts in a single bar chart.
The scatterplot chart also collects data from different hosts, but includes historical data, too. With the scatterplot, Checkmk visualizes metrics such as CPU load from multiple hosts over a period of time, with each host represented by a line. In this way, outliers can be immediately recognized. In addition, two graphs show the median of the upper and lower values.
In interaction with the time series graphs and table views, Checkmk offers the option of organizing your monitoring data visually by means of informative dashboards. In this blog article you can find more information concerning the revised GUI and the new dashlets.
Keynote: Monitoring of hybrid IT infrastructures
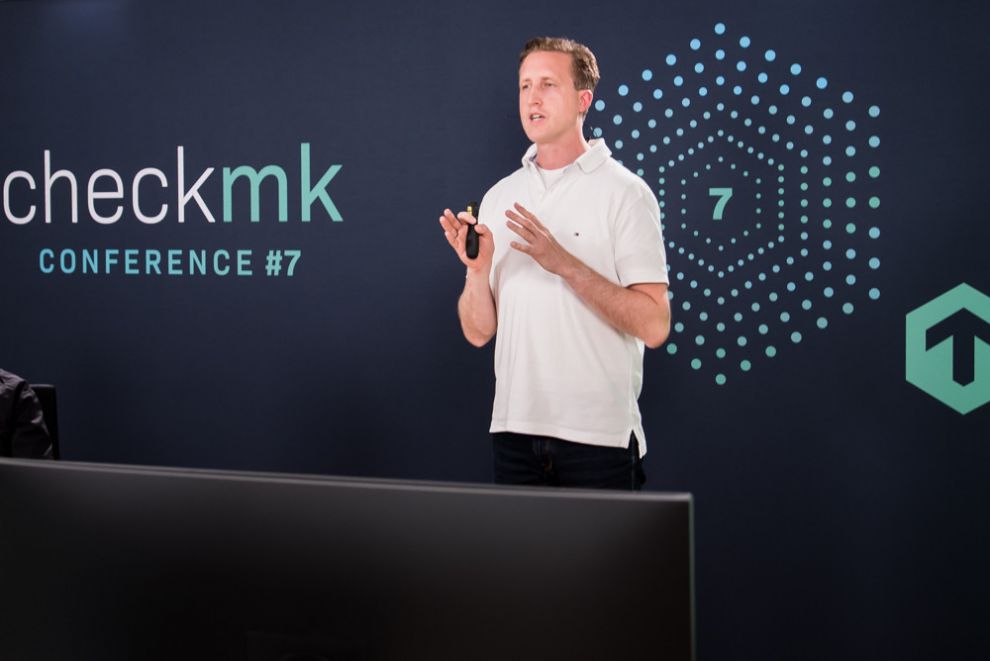
The official kick-off for the Checkmk Conference #7 was given by tribe29 CEO Jan Justus in his keynote on the main stage. In his speech, Jan not only discussed the program for the two days of the conference, but also spoke about the current challenges in IT monitoring. Nowadays organizations are relying increasingly on modern, cloud-native IT stacks in addition to traditional IT stacks. This hybrid and heterogeneous world of on-premises, cloud, containers, Kubernetes, etc. must also be mapped and monitored with a monitoring tool – ideally with Checkmk.

For example, tribe29 has recently put a lot of effort into significantly improving the daily workflow with Checkmk through its new user interface. Also, Checkmk provides the best possible hybrid IT monitoring through the integration of observability tools and enterprise IT, i.e. the various IT systems and solutions that companies need for their business operations. APIs and integrations allow companies a comprehensive, flexible monitoring with the best-of-breed approach.
To enable the integration of all these connected enterprise IT systems into IT monitoring, tribe29 relies on open source. In our opinion, this offers the necessary flexibility and adaptability that it needs to monitor hybrid IT infrastructures. Our aim is that any company can have a decent monitoring, indifferent of how their hybrid infrastructure looks like. This approach is not only reflected in the Enterprise Edition, but is also shown in the fact that we are constantly improving the open source-based Checkmk Raw Edition. This has received many new functions with this new product release and it will continue to benefit from improvements in the future.
The open source approach also enables our community to develop their own extensions for IT monitoring. For example, the new Check Plug-in API makes it easier for users to integrate their own connectors into Checkmk. In addition, we are working with our community to make Checkmk available in more languages.
In addition, Jan also took a look at the future development of Checkmk and thus at the content of the second day of the conference: Currently, tribe29 is working on both simplifying cloud monitoring and improving Kubernetes monitoring with Checkmk. In addition to simpler deployment in the cloud through the provision of Checkmk via the Azure and AWS Marketplaces, it should also be possible to monitor on-premises assets from the cloud in the future. For this, it is necessary that the agents transfer the data 'in the opposite direction', i.e. that they push the monitoring data into the cloud. Some building blocks for an improved Kubernetes monitoring are, for example, predefined configurations that significantly simplify the installation of Checkmk for Kubernetes.
In addition, the revision of the existing integrations of Grafana and InfluxDB as well as a new DataDog interface are three more items on the Checkmk roadmap.
The State of Checkmk
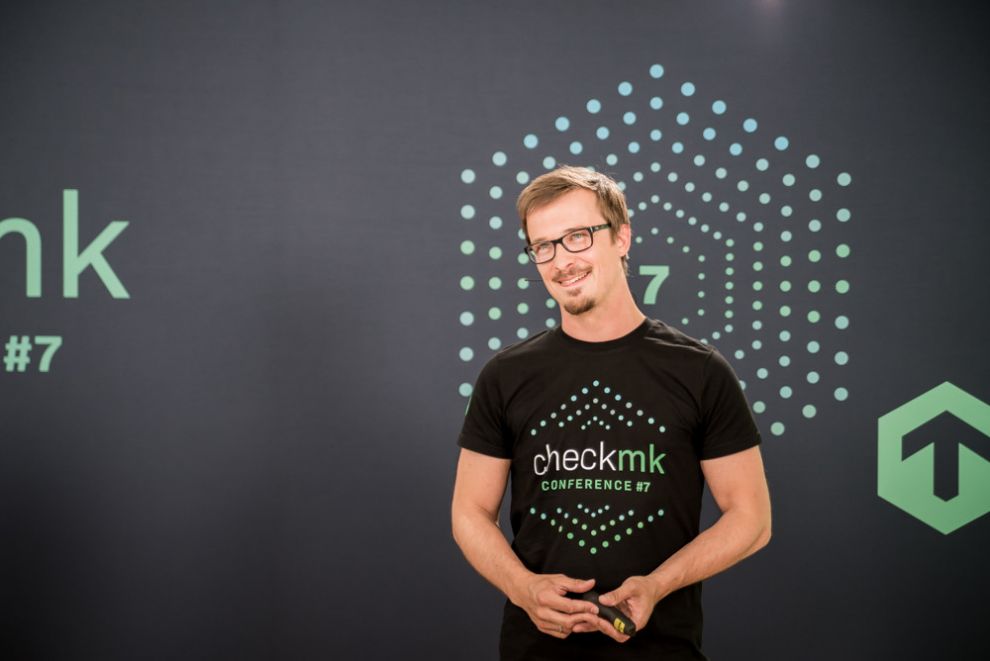
Lars Michelsen, Head of Development at tribe29, gave a detailed overview of the current status of Checkmk in his presentation. With the new UX, the new Check Plug-in API and the new Rest API, there have been three major updates in Checkmk 2.0. Furthermore, Checkmk has closed a grey spot in the network area by integrating ntops network flow monitoring. Thanks to this integration, it is now possible to get deeper insights into network traffic. The integration of Prometheus connectors allows organizations that use Prometheus for their Kubernetes monitoring to incorporate its monitoring data into Checkmk.
Lars also went over the benefits of the new user interface and navigation. The new Main Dashboard in Checkmk has been designed to help users identify trends immediately by providing a broad overview of the monitored services and by showing the status of the monitoring as well as the state of their IT infrastructure. Checkmk provides three dashboards for this purpose: the Main Overview, the Problem Dashboard and the Checkmk Dashboard. The change can be made easily via the three icons in the Top Bar. It is also possible to display a user-defined dashboard after logging into the web interface.

With the new REST API, Checkmk 2.0 also has more options for automating a monitoring process. In comparison to the previous web API, with the new interface not only is it possible to automate host configurations, for example, but also to receive status information from monitoring or to perform operations such as the scheduling of downtimes.
Additionally, with the newly-introduced Check Plug-in API, tribe29 can ensure the support for the now almost 2,000 official Check plug-ins in the future. The new API follows best practices in Check design and also introduces standards that ensure the management and security of the plug-ins. There is also additional material to help Checkmk users develop their own plug-ins. We have summarized all of the important information relating to the new REST API and the Check Plug-in API in a blog article.
On the performance side, Checkmk 2.0 has also undergone a number of changes. The architecture of the Checkmk Micro Core (CMC) implemented in the Enterprise Edition has been fundamentally revised. As a result, monitoring with Checkmk now requires significantly fewer resources. You can find out how the new architecture of the CMC is designed in this blog article.
Capacity management with Checkmk has also become easier with version 2.0. The forecasting graphs had already been introduced with Checkmk 1.6 – but the function had to be separately installed and laboriously configured. With Checkmk 2.0, tribe29 has replaced that engine with its own, leaner solution. In addition, the forecasting option is now by default a part of Checkmk's functional scope.
As the final part of his talk, Lars also went into the migration from Checkmk to Python 3. In total, over 700,000 lines of code had to be migrated from Python 2 to Python 3. This had led to some difficulties in a few places, but on balance there turned out to be fewer problems than expected.
The Fireside Chat – and some insider stories...
The final item on the first day's program was the so-called Fireside Chat. In a relaxed atmosphere and with a freshly-tapped beer keg, Jan, Mathias and Lars ended the first day in the TV studio. They not only talked about the development of the current Checkmk version, but also about the early days of Checkmk – namely how Lars had come to be Mathias' first employee and how the cooperation was during the early days. Among other things, the audience learned that Lars is a 'bad' consultant because he completed a five-day project within two days. Mathias and Lars also talked about the first milestone of their collaboration – the self-developed Checkmk Micro Core. This enabled them to offer not only the open source version, which is based on the Nagios core, but also a much faster and less resource-intensive Enterprise Edition – the basis for Checkmk's success.
After the short excursion into history, further guests were added via Zoom. Community manager Faye Tandog reported on the language program, among other things. Currently, nine (machine-translated) language packages are available. Everyone from the community can help to optimize the translations and thus make Checkmk available in their mother tongue. You can contribute to the project at translate.checkmk.com. The language packages are available for download as MKP packages in our Exchange.
With Andreas Döhler and Robert Sander, two active members of the Checkmk community were also connected to the studio. They told us why they enjoy working with Checkmk and why they also like to share their Checkmk knowledge with other users in the forum when find some time, of course.
The last guest of the evening was Checkmk developer Moritz Kiemer. He reported on the development of the new Check API and which obstacles had to be overcome and the discussions on the way from the concept to the functioning API. At the same time, Moritz also gave an outlook on further plans regarding the API, such as pre-configured cluster setups for services.
The Fireside Chat brought the first day of the conference to an end. On the second day of the conference, the focus was on the future development of Checkmk.
