E2E-Monitoring: Make sure your applications are running
 on Nov 16, 2020
With infrastructure or system monitoring, an IT team can keep an eye on the health of its IT infrastructure at all times. In this way, problems can be identified quickly and easily and faults can be rectified before they affect the IT infrastructure. One area that such monitoring does not cover, however, is user experience monitoring: Does the software work as it should for the user or do long loading times slow down the employee's productivity?
This problem is becoming more apparent with the growing use of cloud platforms, services and infrastructures in organizations. Here an IT administrator often has no access to the underlying infrastructure. This means he cannot look as deeply "under the hood" as would be possible with a local infrastructure. This makes it much more difficult to find the cause of a problem occurring within an application.
End-to-End monitoring gives IT administrators the ability to illuminate such dark areas in their IT environment. It aims to make the operation of the provided IT infrastructure as trouble-free as possible.
This blog article aims to raise awareness of the need for End2End testing and explain how to integrate such tests into Checkmk.
TL;DR:
End-to-end monitoring guarantees that applications function properly from the user's viewpoint, going beyond just traditional infrastructure checks.
- It addresses the gap between OSI layer 7 and the end user by evaluating the actual functionality and performance of software as users experience it.
- Robot Framework automates repetitive tests across web, desktop, and custom applications, simplifying the process of identifying errors, slowdowns, or crashes.
- Additionally, Robotmk integrates these tests into Checkmk, enabling scheduled execution, result collection, and alert notifications, allowing administrators to proactively maintain a seamless user experience.
Orientation in the OSI model
Why End2End-Monitoring is important is made clear by looking at the OSI layer model. The model shows what an administrator can monitor using IT infrastructure monitoring – and shows where the natural limit of this type of monitoring is to be found.

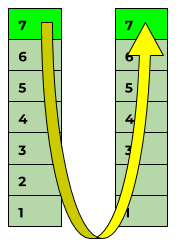
In this model, network protocols basically build on each other in layers. For example, the echo request from the ICMP check traverses layers 3, 2 and 1 before it then travels up through the transmission medium (air or cable) on the target host through layers 1, 2 and 3 again. There it is confirmed with a response packet which is returned in the opposite direction.
What happens in detail with the package on its journey through these layers is irrelevant to Checkmk and is not the topic of this current article. What is important is that the request from layer 3 is answered within a certain time, so that Checkmk can mark the host as 'UP' – i.e. reachable.
This is because for example, a web server must be able to do more than just answer ICMP requests, there are of course also checks for the protocols of higher layers.
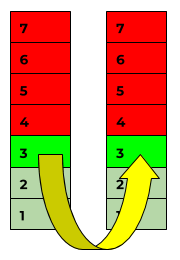
If Checkmk checks a target host, for example, with an FTP check, the packet in such a case starts in layer 7 (= the FTP plug-in), travels down through all layers and at the target host it travels back up to layer 7, where the FTP server is ( hopefully ) operating. It answers this request and then returns the packet.
The colors in the previous and following graphics show exactly what you know on the one hand, and on the other hand what you can derive from it:
- green is the confirmation that Checkmk and the target host can communicate on layers 3 and 7 respectively. Metrics, such as packet delay, are accumulated on this layer.
- light green is the color of acceptance, which means that the monitoring system recognizes that these layers are permeable and that they transport the packets. However, it does not know whether, for example, the ancient Token Ring protocol was used on layer 2 instead of Ethernet.
- red indicates only speculation: If layer 3 works, an important prerequisite has been met for an FTP server to be able to run on it – but this is by no means guaranteed.
The application layer
The name of layer 7, the so-called 'application layer', could easily give the impression that this is exactly where the applications that users work with are located. But this is not the case.
Layer 7 is only the input and output interface for the applications and these are dependent on it. This is unfortunately often misunderstood.
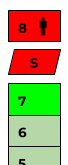
In view of the fact that the extended OSI model on Layer 8 defines the human or user, one needs to think of an intermediate layer on which the software runs ('Layer S').
And this makes it clear: With monitoring checks you actually only ever check the prerequisites for the software layer (= all inclusive. Layer 7) – but never the status of this layer itself!
The End User-Experience
What is the actual role of an administrator?
- Replacing hard drives?
- Monitoring latencies?
- Installing updates?
Yes – and also no. There is actually really one job: to ensure that users are satisfied when using the services and applications provided – i.e., that they have a good 'end user experience'. This is what IT is measured and judged by. All of an administrator's other tasks are only a consequence of this 'mission':
That the software in use is actually functioning remains a matter of speculation as long as the administrator does not monitor the software directly, but only monitors up to layer 7.
- In such a scenario it is possible that the following may remain undetected:
- The quality of service/performance of externally hosted applications,
- any gradual deterioration of start and loading times,
- seemingly random program crashes,
- display errors,
- problems in process chains,
- obsolete data,
- as just a few examples.
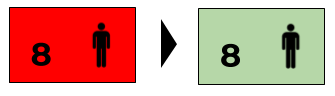
With this background knowledge, it is now possible to explain the meaning behind the term 'End-to-End': the aim is to move monitoring in the OSI model even further up the ladder – to the limit of computer to human interaction. To the highest level, you could say. During end-to-end monitoring, this layer is tested from the user's perspective.
Robot Framework
So yes – let the testing be done for you. Robot Framework is one of the best open source tools for automated testing. Like a robot, it shuffles through the same paths in an application over and over again and can handle any kind of application, be it web-based or installed on Windows or Linux.
By the way, Robot Framework is not only used for testing software. It is also very well suited for RPA (Robotic Process Automation). The idea behind this is to automate workflows that normally only humans can perform, such as stupidly entering data into existing software that has no import interface. Robot Framework thus comes very close to the image of a 'software robot on the assembly line'!
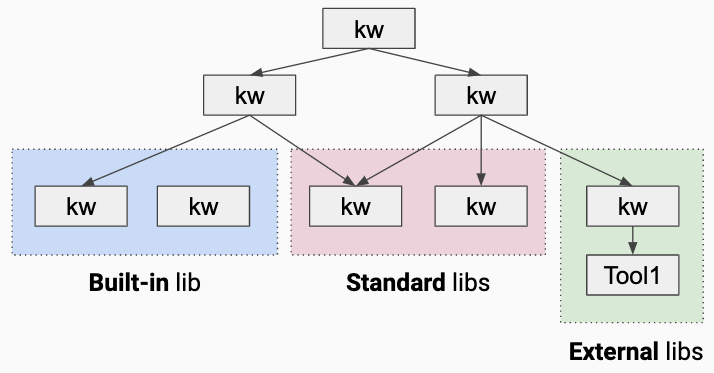
If there is one feature that sets Robot Framework apart from all other test tools, then this is certainly its "keyword driven" approach. Robot is also extended with libraries, which, for example, via special keywords provide the test methods for Selenium, AutoIT, SAP, Sikuli etc. Keywords abstract the Python program code that would be necessary for Selenium tests, for example.
Keywords can be nested like functions in a scripting language and provided with input and output parameters. Certainly, programming tests in Python provides the maximum freedom, but however also restricts the circle of those who write tests to programmers. Because robot keywords encapsulate and abstract Python code, they make writing and reading/understanding tests much easier.
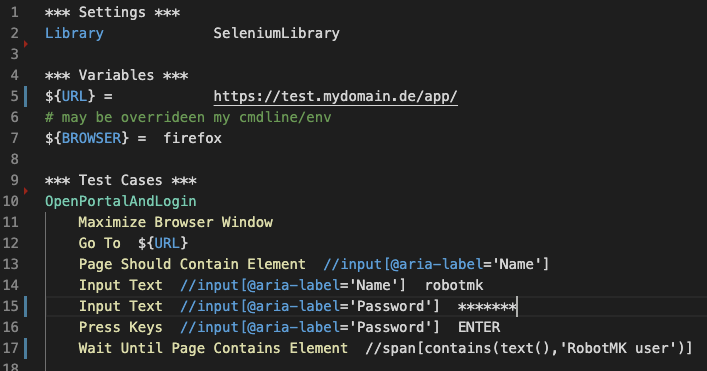
In this extract from a robot file, the Selenium library is used for web testing (line 2). After defining two variables in the 'Variables' section, the 'Test Cases' section begins. The 'OpenPortalAndLogi'" test case executes a set of keywords from the Selenium library to perform the login to a web application.
When formulating tests, one should always take care to verify the desired target state, as line 17 shows: the login was only successful if a span element exists that contains the text 'Robotmk user'.
The integration of such robot tests into the monitoring was up to now not possible, nevertheless here it concerns both the regular execution and the evaluation of the results – because in any case functional or performance-technical errors should also be alarmed.
Robotmk
"Robotmk" is an extension specifically for Checkmk which closes this gap.

This is available on the Checkmk Exchange as MKP (MK-Package). Robotmk v1 is compatible with all Checkmk 1.6 versions as well as Checkmk 2.0 ongoing. Since Checkmk 2.3 Robotmk is integrated as a new add-on called Checkmk Synthetic Monitoring. At this place we talk about Robotmk v1.
The central building blocks of Robotmk are the plug-in and the Check. The plug-in is triggered either asynchronously via the Checkmk agent, or externally via the task scheduler, and it executes the robot test cases on the target machine.
The result from each test is transmitted via the agent output to the Checkmk server. There the check not only evaluates the runtimes from the different test sections but also influences the length and the form of the output. A further rule defines which test sections should generate performance data.
Using the Discovery Rule, it is also possible to create separate services from individual sections of a test. This is especially helpful, for example, when a robot executes a test several times using different test data, or when different teams need to be separately alerted concerning the test sections. In addition, for Test Suites a kind of 'real-time progress display' can be provided in Nagvis.
With the OSI layer model in mind, it becomes clear why the 'Layer S' above the application layer should not remain a blind spot in monitoring – after all, this is the layer with which the user interacts with the infrastructure.
With the use of an End-to-End monitoring system based on Robot Framework, the functionality and performance of applications in this layer can be monitored. This therefore represents an ideal enhancement to Checkmk, because it monitors what the user sees.
Further advantages are:
- Monitoring of the problem free interaction of technologies and functional chains.
- Cross-site tests and evaluations (e.g. SLA reports) create a clear basis for discussion and decision-making.
- An early warning system for application operation. The proactive elimination of emerging problems increases availability and ensures the image of and trust in IT.
In short, end-to-end monitoring is the systematic monitoring of the ultimate and most important link between man and machine.
In our next blog article, how to configure Robotmk, we show you how you can easily setup up a Robot Framework test and integrate it into Checkmk using the Robotmk scheduler in Checkmk 2.3.
About the author:
Monitoring has always been a constant in Simon's 20-year career in IT – first as an administrator, then as a consultant and since 2018 in his own company ELABIT GmbH, which he founded to focus on the automated testing of applications and the integration of such tests in Checkmk. The "Robotmk" solution is the result of his endeavors and is highly regarded in the Checkmk community.
When he is not working at Checkmk as a product manager coordinating the further development of Robotmk, he helps customers all over the world to integrate synthetic monitoring into their environment.
