End-to-End Monitoring with Checkmk: Configuring Robotmk
 on Jun 26, 2024
Monitoring applications end-to-end is as vast as essential in infrastructure monitoring. We discussed what it is in the previous part, titled “E2E-Monitoring: Make sure your applications are running”. That was the “what”, while the current article is the “how”.
We will cover two main topics: how to set up your development machine so that you can easily start, debug and develop a Robot Framework test in VS Code. And, secondly, we will see how to walk through all the steps needed in order to integrate this test into Checkmk using the Robotmk scheduler.
Note: The article is based on Robotmk version 2, which is part of Checkmk since version 2.3. This version focuses on Windows hosts as test nodes; if you need to execute tests on Linux hosts, the version 1 of Robotmk is still available as an MKP and can be downloaded from the Checkmk Exchange page.
TL;DR: - This is how Robotmk v2 works
- On the client side, Robotmk is not an asynchronous plug-in anymore side by side to the Checkmk agent.
- The scheduler reads the execution configurations (called "plans") from a JSON config file. Plans are configured via the bakery rule.
- Each plan can run in its individual interval. This allows parallel executions, but also sequential execution is supported.
- No Python installation hassle anymore thanks to the integration of the open source RCC tool.
- Scheduler, agent plug-in, RCC binary and the JSON config are deployed together with the MSI package.
- The Robotmk agent plug-in is responsible for reading the results of executed plans and to pass them into the agent output.
- The concept of scheduler, plan and test services allows well-targeted and differentiated notifications
Machine setup
Our example starts on a brand new Windows 11 virtual machine with no Python, Robot Framework, or any related libraries installed. This pristine environment is crucial as it mirrors the scenario for a test author who wants to start a Robot Framework test with VS Code.
The machine only has installed the Checkmk Vanilla agent for a very basic monitoring:

In this example, the machine will serve for two purposes:
- it is the host where we will start and develop the test with VS Code
- it is also the monitored "Robotmk test node"
In reality, this will likely be two different machines.
Anatomy of a Robot Framework suite file
Let's examine a very basic web test based on the Browser library for Robot Framework. You can download the example from here:
https://github.com/Checkmk/robotmk-examples/tree/main/templates/web
For a first manual execution, it's ok to save the directory in the Documents folder, for example:

It's highly advisable to maintain your Robot Framework suites within dedicated folders. This not only helps in managing the suites but also simplifies integration with other tools or version control with git. In our case, under the Documents folder, there's a subfolder named cmk_google_search housing the example Robot Framework suite.
The file cmk_google_search.robot inside the folder is called a "Robot Framework suite". A "suite" in Robot Framework’s terminology is a collection of test cases.
To edit Robot Framework suite files, any text editor can be used. For the best user experience and the possibility to run and debug the tests, we highly recommend installing VS Code and, inside of that, the great extension RobotCode. This extension provides code completion, debugging, refactoring and more to ease the work on Robot Framework test suites.
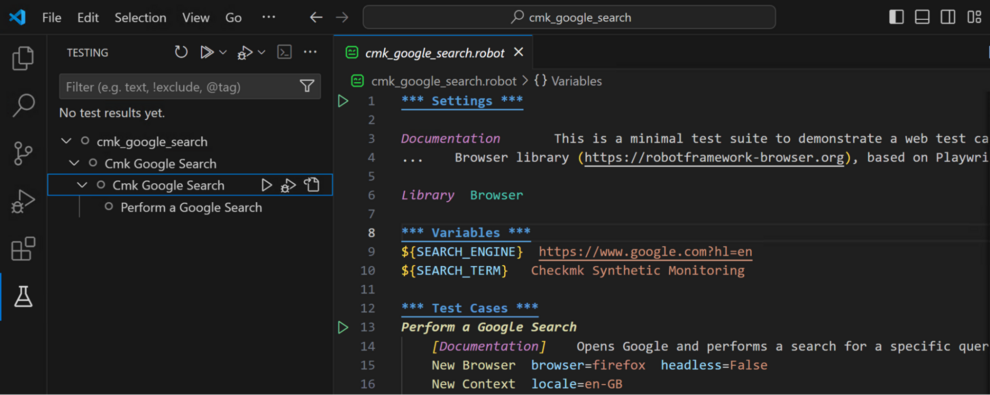
This is how a Robot Framework suite looks like in VS Code. You will probably note that there are blue lines with stars; they mark the different sections with their special meaning:

- Settings: This is the place where you can write some documentation, import one or more of the countless open source libraries, or also reference resource files – a neat trick to create maintainable and reusable code, by the way.
- Variables: As the name suggests, this section is to create variables on a suite level, which means that they can be accessed (and changed) in all test cases. For example,
${SEARCH_ENGINE}holds the URL for the search engine,${SEARCH_TERM}contains the string which should be searched for. - Test Cases: Where the rubber meets the road. Just write the name of the test case and then with an indentation, the keywords which should be executed.
- Keywords: The keywords used in this example all come from the browser library. Only the “Sleep” keyword is from the Robot Framework’s Builtin the Image in Library. Pro-tip: Test cases can be simplified even further by defining user keywords.
That's basically it! The following two main parts of the article focuses on how to work with the suite as a user and how to configure Robotmk to use it.
In both cases, the tool "RCC" plays a very important role, which we will explain first.
The role of RCC in Robotmk
Robot Framework and its libraries are for the most part written in Python, with a minority of them in JavaScript. In order for the Robot Framework to work, you would have to install both Python and JavaScript interpreters and their packages manually on the test node. Things get difficult when each RF suite has other dependencies – without "scripting foo", you cannot use multiple environments on one single machine, even in cases when they do not need an unpredictable set of scripting languages.
In any testing scenario, consistency is also key. You need to ensure that the environment setups are standardized across various test machines, and that they can be easily re-created in a predictable way. To use a famous saying: it should "also work on your machine"...
This is what the RCC tool does for us: it automatically creates environments based on a dependency file conda.yaml
Start tests by hand
Your first step is to download RCC from their official download page.
At the time of writing this, version 17.18 is the latest stable version you should use.
Place the file rcc.exe into a bin folder, right below our Windows user profile folder, for example:
c:\Users\simon_meggle\bin
Then add this path to the user environment variable %PATH% in the "Advanced Settings" of the Windows System:

Let's try if RCC is able to create the environment for our example suite.
Open a new CMD in the folder of the example and type:
rcc task shell
What does that command do?
It reads the environment specification from the conda.yaml file, creates the environment (which can take some minutes) and directly brings you into the activated environment. "Activated" here means that, magically, you can now execute Python, Node.js, robot – whatever you specified to install in the conda.yaml file.
From an activated environment, the simplest way to execute Robot Framework is on the command line. Try and wonder:
robot tests.robot
This works, but the fun really begins when you use VS Code as editor. Since you are already in an activated environment anyway, it makes sense to call VS Code directly from here and all the work is done:
code .
which means: open the current folder (=the dot), in VS Code.
You will notice that the editor now shows two green "play" buttons, and the test tube icon on the left side reveals a tree structure of the suite file and of its test(s).
Pressing any of these "play" buttons will start the test as from the command line.
Congratulations – you are now ready to become a Robot Framework test developer!
Execute tests by Robotmk
Now we come to the really interesting part: how do we teach Checkmk to execute a Robot Framework test so that we can integrate its status in the monitoring?
The integration starts by generating a new agent package that bundles the Robotmk scheduler, the Robotmk agent plug-in, the RCC binary and a configuration file that specifies the suites to be executed.
The Robotmk scheduler rule
The responsible rule "Robotmk scheduler (Windows)" for that task can be found when searching for the term "robot" in the Setup menu:

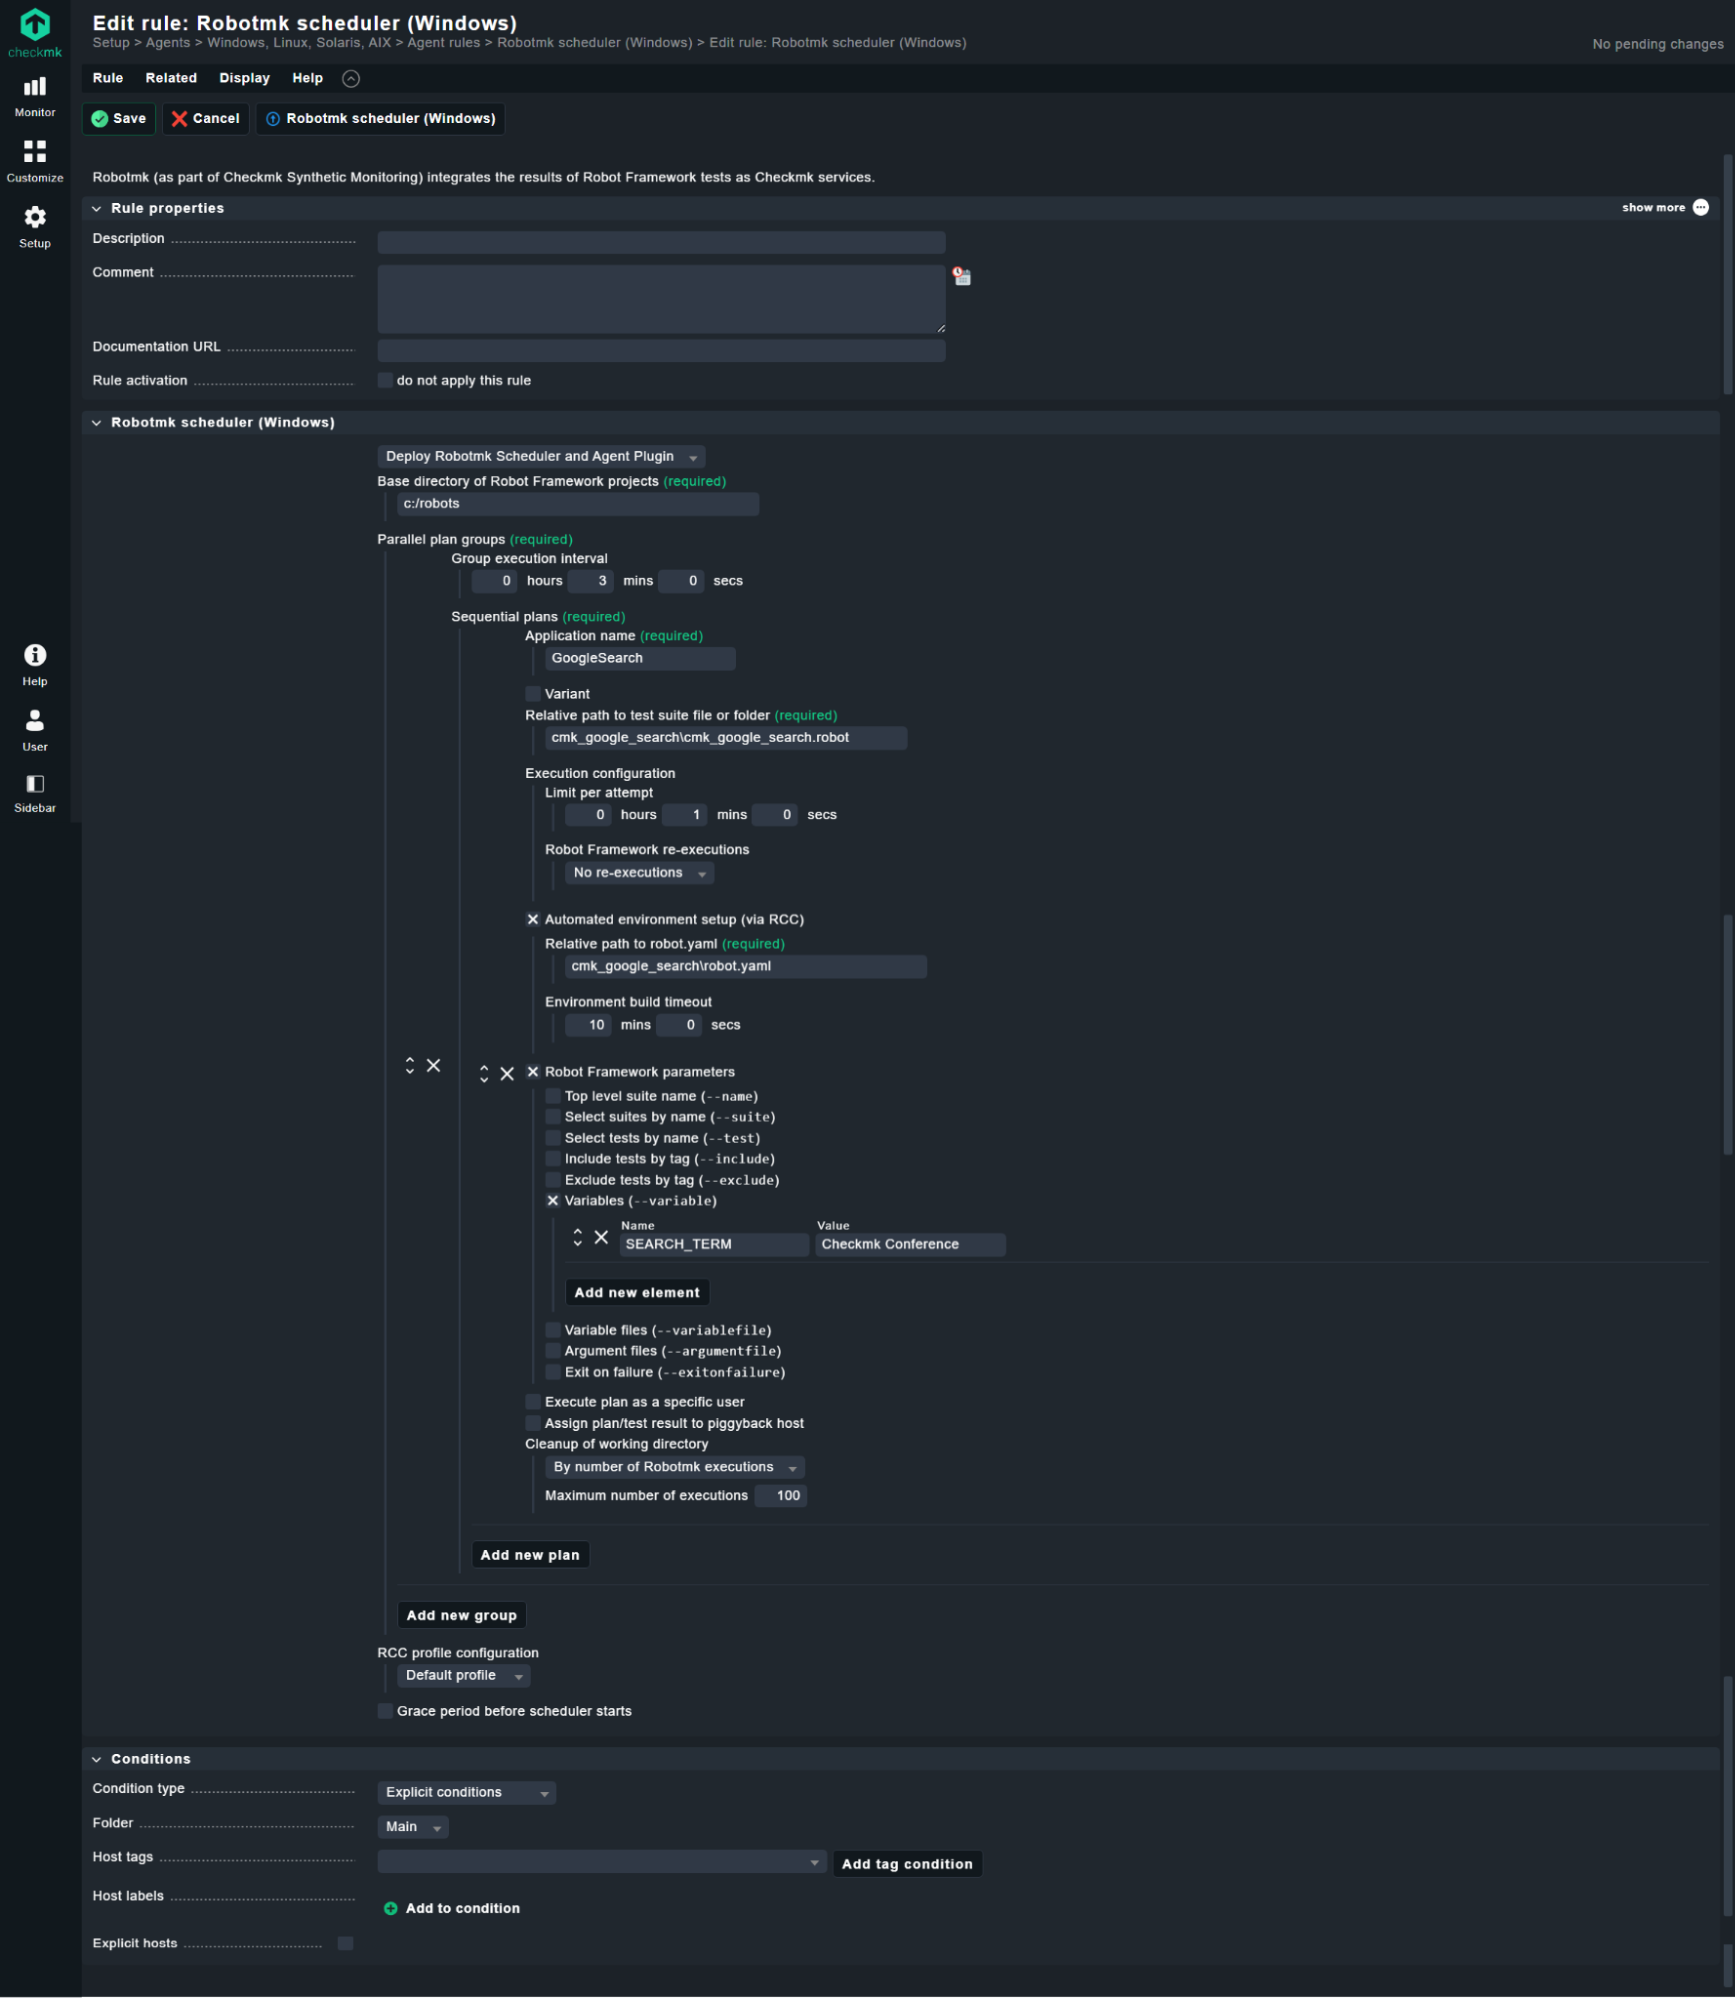
Initially you should limit the scope of the rule to specific hosts or host labels to ensure that tests are only run where necessary. Secondly, set the base directory to c:\robots at the very top of the rule.
The bakery rule in Robotmk v2 is quite similar to the one in Robotmk v1. The most important change is that on this page we aren't talking about "suites'' anymore, but "plans''.
So, what is the difference between a suite and a "plan"?
A "suite" always refers to what is represented by a .robot file as we have seen above. In simple words, it's something that Robot Framework can execute directly.
A "plan" defines all the settings and parameters for Robotmk to run a suite. It contains the path to the suite and settings which are related to Checkmk.
First, let's go quickly through the most important fields within a plan:
- Application name: Set this to an arbitrary name of the application you are testing.
- Variant: in case you want to execute the same suite multiple times, but with different parameters, you must fill out the variant field so that Checkmk can differentiate between them.
- Relative path to test suite file or folder: This sets the path to the Robot Framework suite folder or directly to a specific `.robot` file, relative to the base directory.
- Limit per attempt: by default, Robotmk executes a suite exactly once, which is called an "attempt". The timeout specifies how much time such an attempt is allowed to run.
- Robot Framework re-executions: Robotmk can re-execute a failed suite a certain number of times if one or more tests have failed. The final result gets calculated from all attempt results. You can choose between two strategies, incremental (re-execute single tests) and complete (if tests depend on each other, the complete suite gets re-executed).
- Automated environment setup (via RCC): For systems without a pre-installed Python environment, configure RCC to automatically set up the necessary environment. This includes specifying the relative path to the main RCC configuration file robot.yaml that RCC uses to build the environment, executing tasks, and scripts. More info on what this file is can be read on the official documentation page.
- Robot Framework parameters: this allows to set the most common command line parameters for Robot Framework. Perhaps the most important one is "Variables''. It allows you to specify variables which are then part of the global/suite scope in the suite run. Remember the variable "SEARCH_TERM" in the
.robotfile? Let's overwrite this with “Checkmk Conference”, as shown in the screenshot. Instead of the default query defined in the suite file, the test will now use the variable value specified in Checkmk. Cool thing!
You may ask where you can set the interval for the plan. We need to explain a higher-level concept called "parallel plan groups". A plan is always part of such a group, which has an individual execution interval.
Plans inside the same group are executed one after another (thus, the name "sequential" in the UI’s option). This is helpful if you have tests which access the same resource, but no parallel access is allowed. The most famous example for this are desktop based tests. Imagine two RF tests running at the same time fighting on the desktop for the mouse…!
Plans in different groups can run individually and in parallel. The only limitation you have to keep in mind are the machine resources: for Robotmk we recommend at least 8GB of RAM and 4, better 8 vCPUs. Even if parallel executions will work with this setup, you don't know if the machine's scarce resources will slow them down! So you'd better give the machine a generous amount of resources right away so that you don't walk into this pitfall.
Lastly, save and apply the rule. Head over to the Bakery and create a new MSI package:
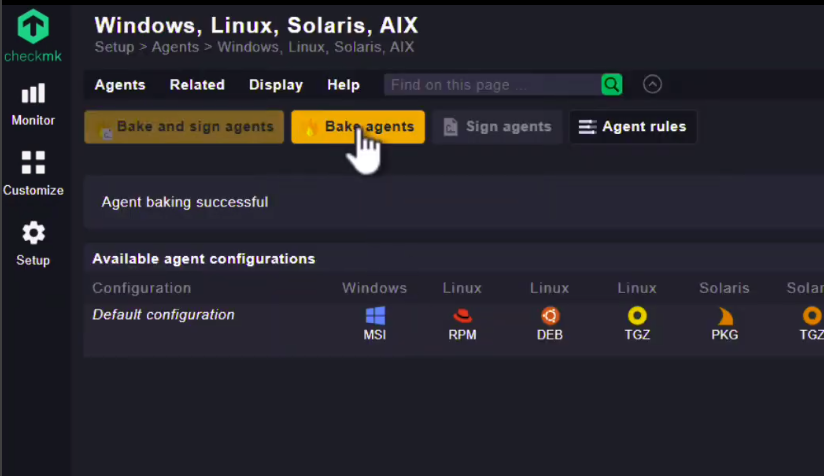
After the new agent has been installed and started, it will immediately start robotmk_scheduler.exe as a sidecar process. And even if you kill this process, the CMK agent will always take care for it to run and restart it!
First discovery: The Robotmk scheduler service
A discovery run on the host reveals a new service, which represents the state of the scheduler.
Currently, the scheduler is busy with the environment creation by RCC.
It's also worth mentioning that the environment creation is always the first task after the scheduler has been started. Plan execution always follows after all environments have been built. The reason is simple: this process takes a pretty amount of system resources; you simply don't want to have this any influence on the runtime/result of running tests.

Second discovery: Plan and Test service
After some time, the scheduler should be finished with the environment creation and enter its second phase, which is the scheduling of the plan groups.
Sooner or later, after the first execution, you will be able to discover two more services:

Robotmk v2 discovers by default all test cases of a suite. These services are what really represent the status of what you are interested in: the tests.
Plan services in turn are targeted to administrators: they would inform them about internal problems like the environment creation, stale results etc.
With this separation of concerns – scheduler, plans and tests – you have full control over the notification channels for different stakeholders.
Thresholds and performance data
What would monitoring be without thresholds? The monitoring of runtimes within a test takes on a special role at Robotmk.
Robotmk takes advantage of Robot Framework's feature of having all elements of a suite (i.e. sub-suites, tests, keywords and sub-keywords) with start and end times already recorded in its resulting XML. And because this XML was transported to the Checkmk page in raw format, the Checkmk admin has all the freedom to use this data for monitoring the runtimes – as usually in Checkmk, using monitoring rules.
You can find the relevant monitoring rules in the setup menu by search for "robot":

The fact that such an integration of results from tests with Robot Framework into a monitoring system is possible at all is due to the fact that Checkmk strictly separates the collection of data from its evaluation. It is not the plug-in on the client that is parameterized, but the server-side check that evaluates the collected data. Incidentally, this is also one of the reasons why compatibility with other monitoring systems like Naemon, Icinga2, Zabbix, etc. is excluded.
Summary and Conclusion
This article showed you how to take your first steps with Robotmk to successfully introduce Synthetic Monitoring in your company. Further articles are planned; please let us know what interests you the most.
In this new version 2, Robotmk covers all the features of its previous version 1. There has been a lot of work done, we have completely reprogrammed the tool in Rust instead of Python.
With the RCC integration and the parallel execution of tests by the scheduler, the basis has been laid for a whole series of further features that will be introduced in the coming versions. Work never stops on improving Robotmk and Synthetic Monitoring with Checkmk!
About the author:
Monitoring has always been a constant in Simon's 20-year career in IT – first as an administrator, then as a consultant and since 2018 in his own company ELABIT GmbH, which he founded to focus on the automated testing of applications and the integration of such tests in Checkmk. The "Robotmk" solution is the result of his endeavors and is highly regarded in the Checkmk community.
When he is not working at Checkmk as a product manager coordinating the further development of Robotmk, he helps customers all over the world to integrate synthetic monitoring into their environment.
