Monitoring of different server types: SQL servers
 on Jun 7, 2021
In the age of the IoT (Internet of Things) and big data, databases play an important role and are crucial for the success of an organization. As a result, the requirements for monitoring SQL servers are also growing. I would therefore like to explain in this blog what you should be aware of when monitoring SQL servers.
What are SQL servers?
The Structured Query Language (SQL) is one of the most important standardized programming languages for managing relational databases such as Microsoft SQL, MariaDB, MySQL, Oracle DB or PostgreSQL. SQL servers are the 'home' of a database and usually host the SQL applications of one database's vendor. This makes it difficult to define the typical SQL server. Each vendor's relational database management system (RDBMS) has different functions and different hardware requirements. In addition, databases vary in size depending on each specific organization.
Most SQL servers use a Linux distribution as operating system. Of course, Windows SQL servers can also be found in Windows environments. These days, you can also set up Microsoft SQL servers under Linux distributions.
Many companies use a variety of SQL databases in parallel. Moreover, in some areas such as web development, SQL databases are considered obsolete. For this reason, many organizations also work with non-structural (NoSQL) databases. They no longer necessarily set these up on classic hardware servers, but use containers and Kubernetes clusters to host their databases. And finally, public cloud providers such as Amazon with its AWS RDS offer services to easily operate SQL servers as a cloud service.
This belongs in SQL server monitoring
The wealth of variants within SQL landscapes in organizations also has an impact on the requirements for SQL server monitoring. Database administrators often have to monitor a multitude of different SQL servers and database systems. Since databases are essential for the success of an enterprise, most IT departments already have a SQL server monitoring in place.
However, in practice, an inadequate monitoring of SQL servers is a major problem. Monitoring is often limited to individual metrics such as the availability of the database or memory utilization. This happens on the one hand, because of the many SQL database providers, some tools are not technically capable of recording all of the necessary data from all current manufacturers. On the other hand, some monitoring tools could theoretically capture more data with a little effort, but are not scalable enough to properly process the large volume of monitoring data that is generated by large databases.
Alongside their availability, organizations should also constantly check and optimize the information flow through their SQL servers. Database system administrators must therefore rebuild or adapt databases more frequently. At the same time, there can be no interruption to the monitoring. It is therefore important that a monitoring tool ensures precise monitoring with minimal effort and that it can be tailored to a variety of databases.
When monitoring SQL servers, data availability in distributed systems, response times and the number of network nodes must always be included in the monitoring. Only through detailed monitoring can organizations avoid bottlenecks and performance constraints. If a monitoring tool is too time-consuming in its usage, it puts database system administrators under immense time pressure, and this leads to gaps in the database monitoring.
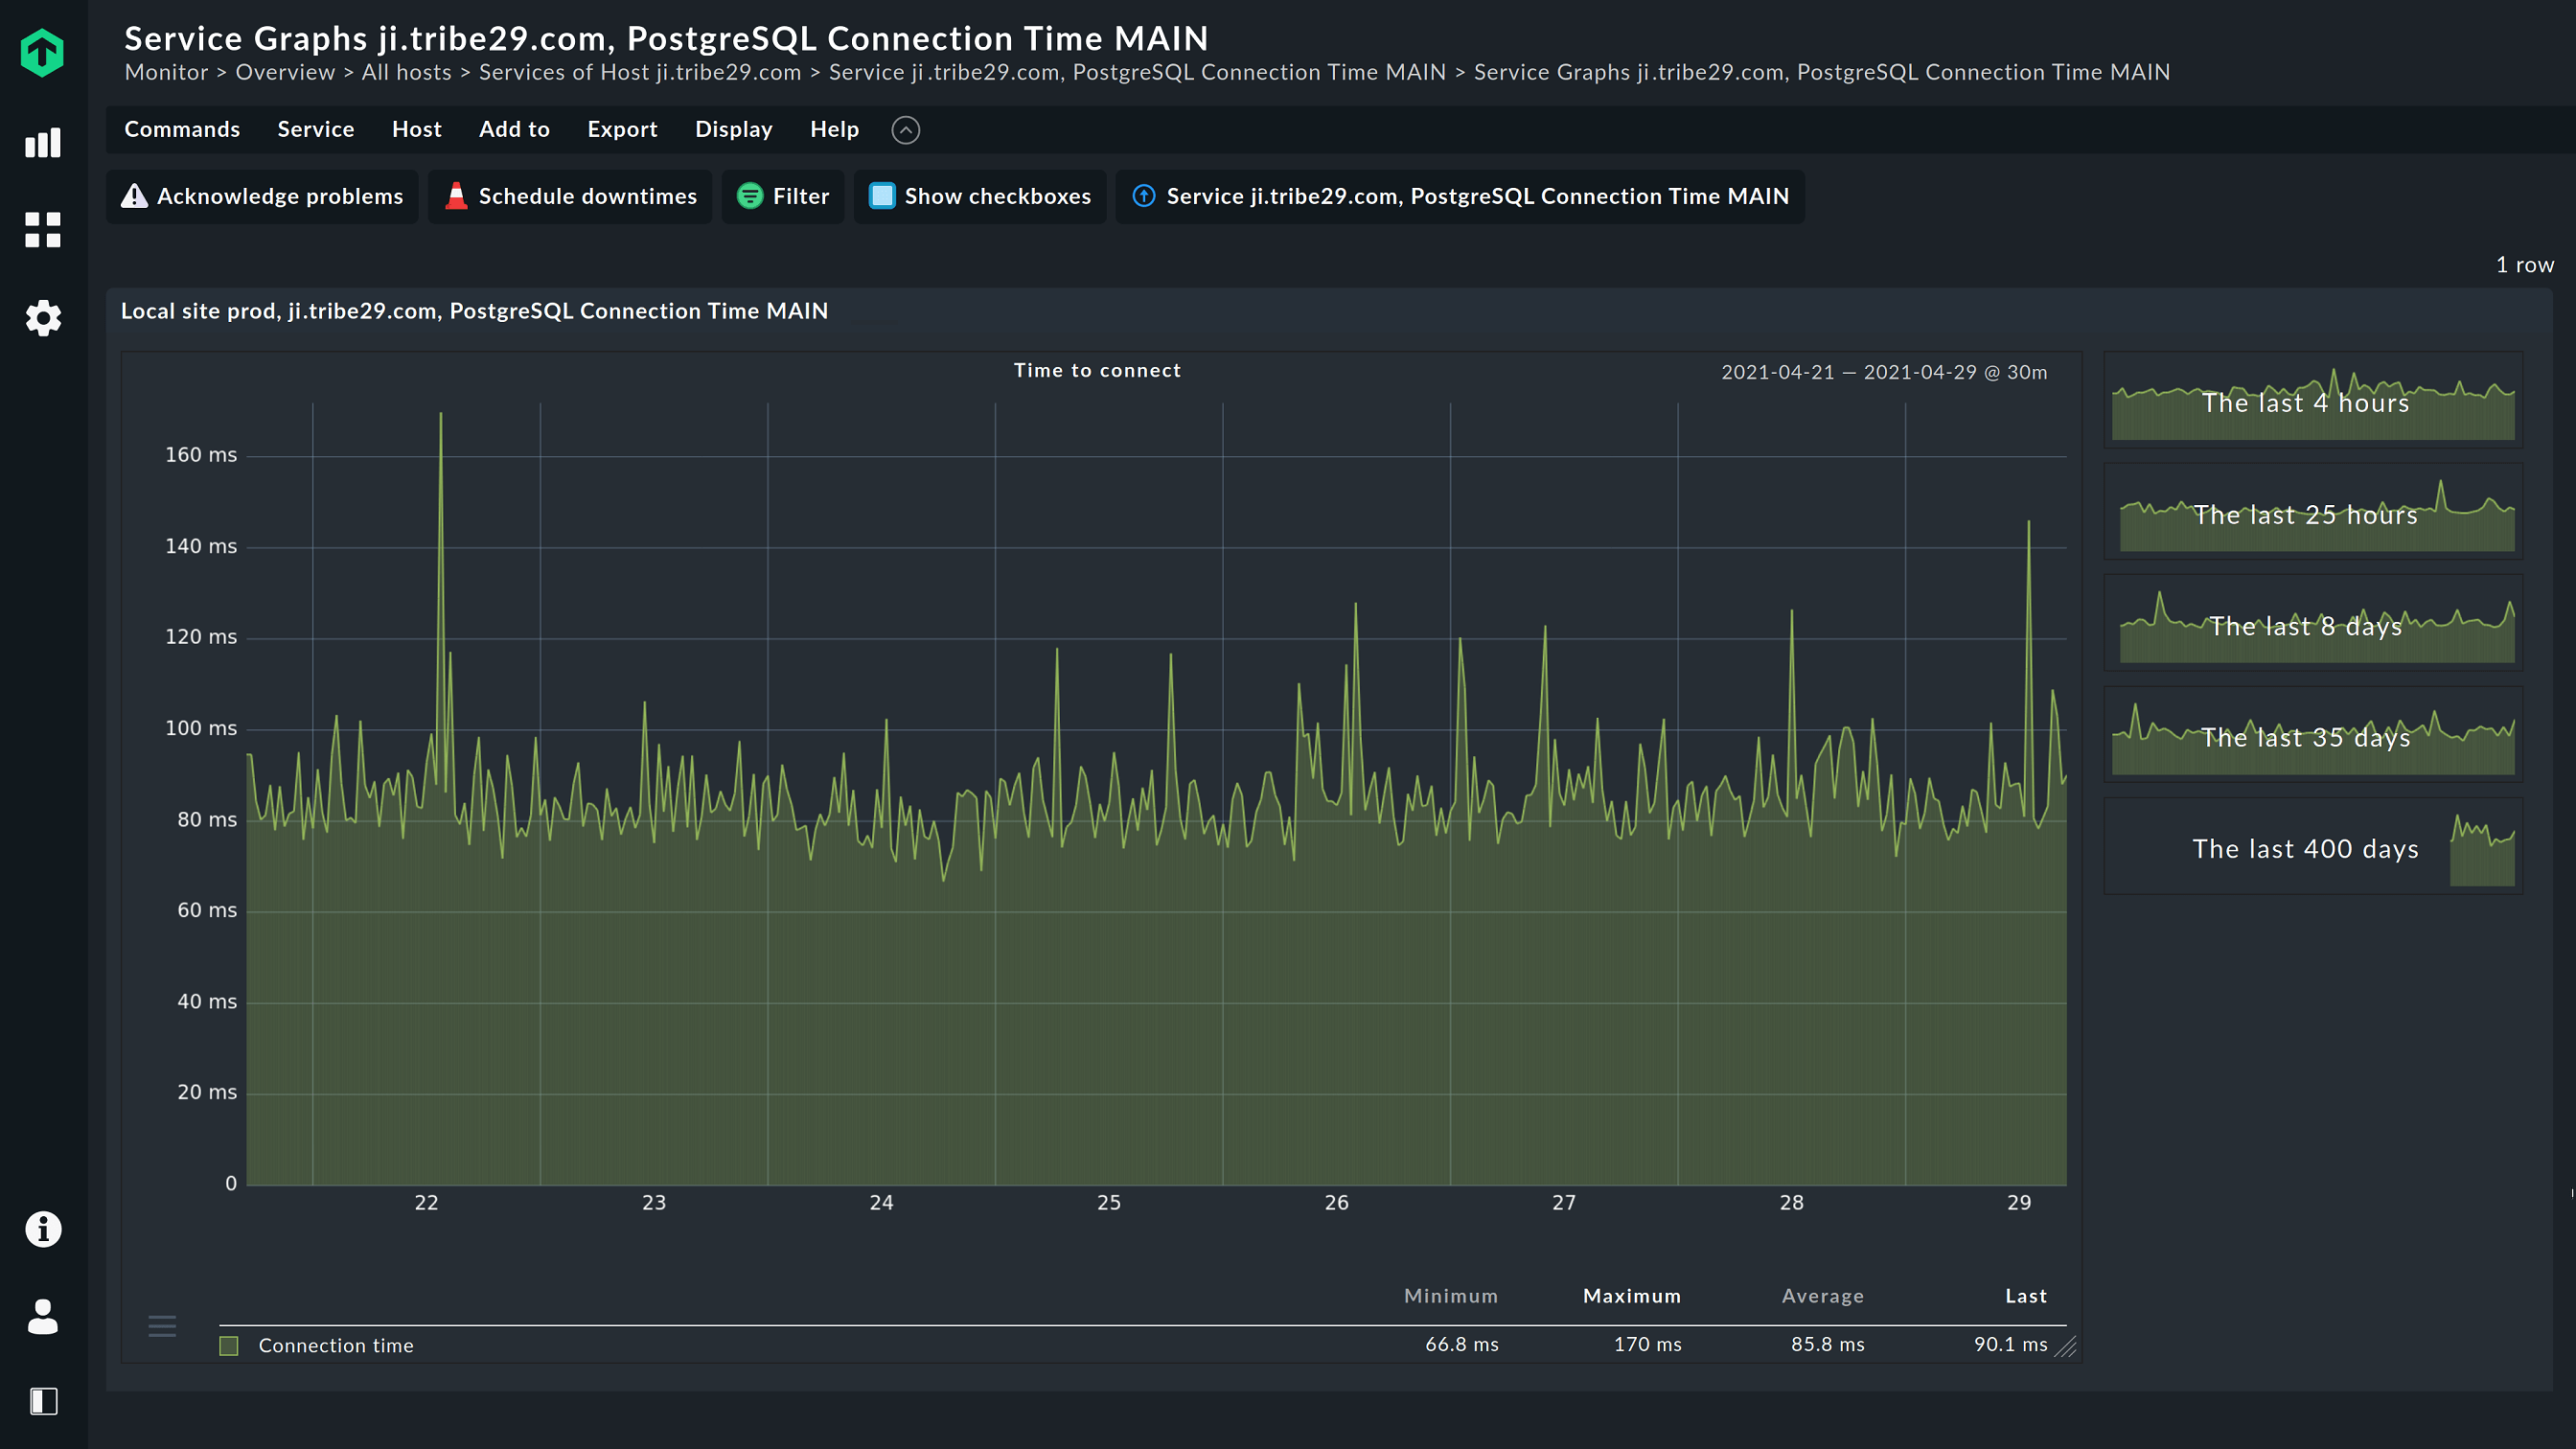
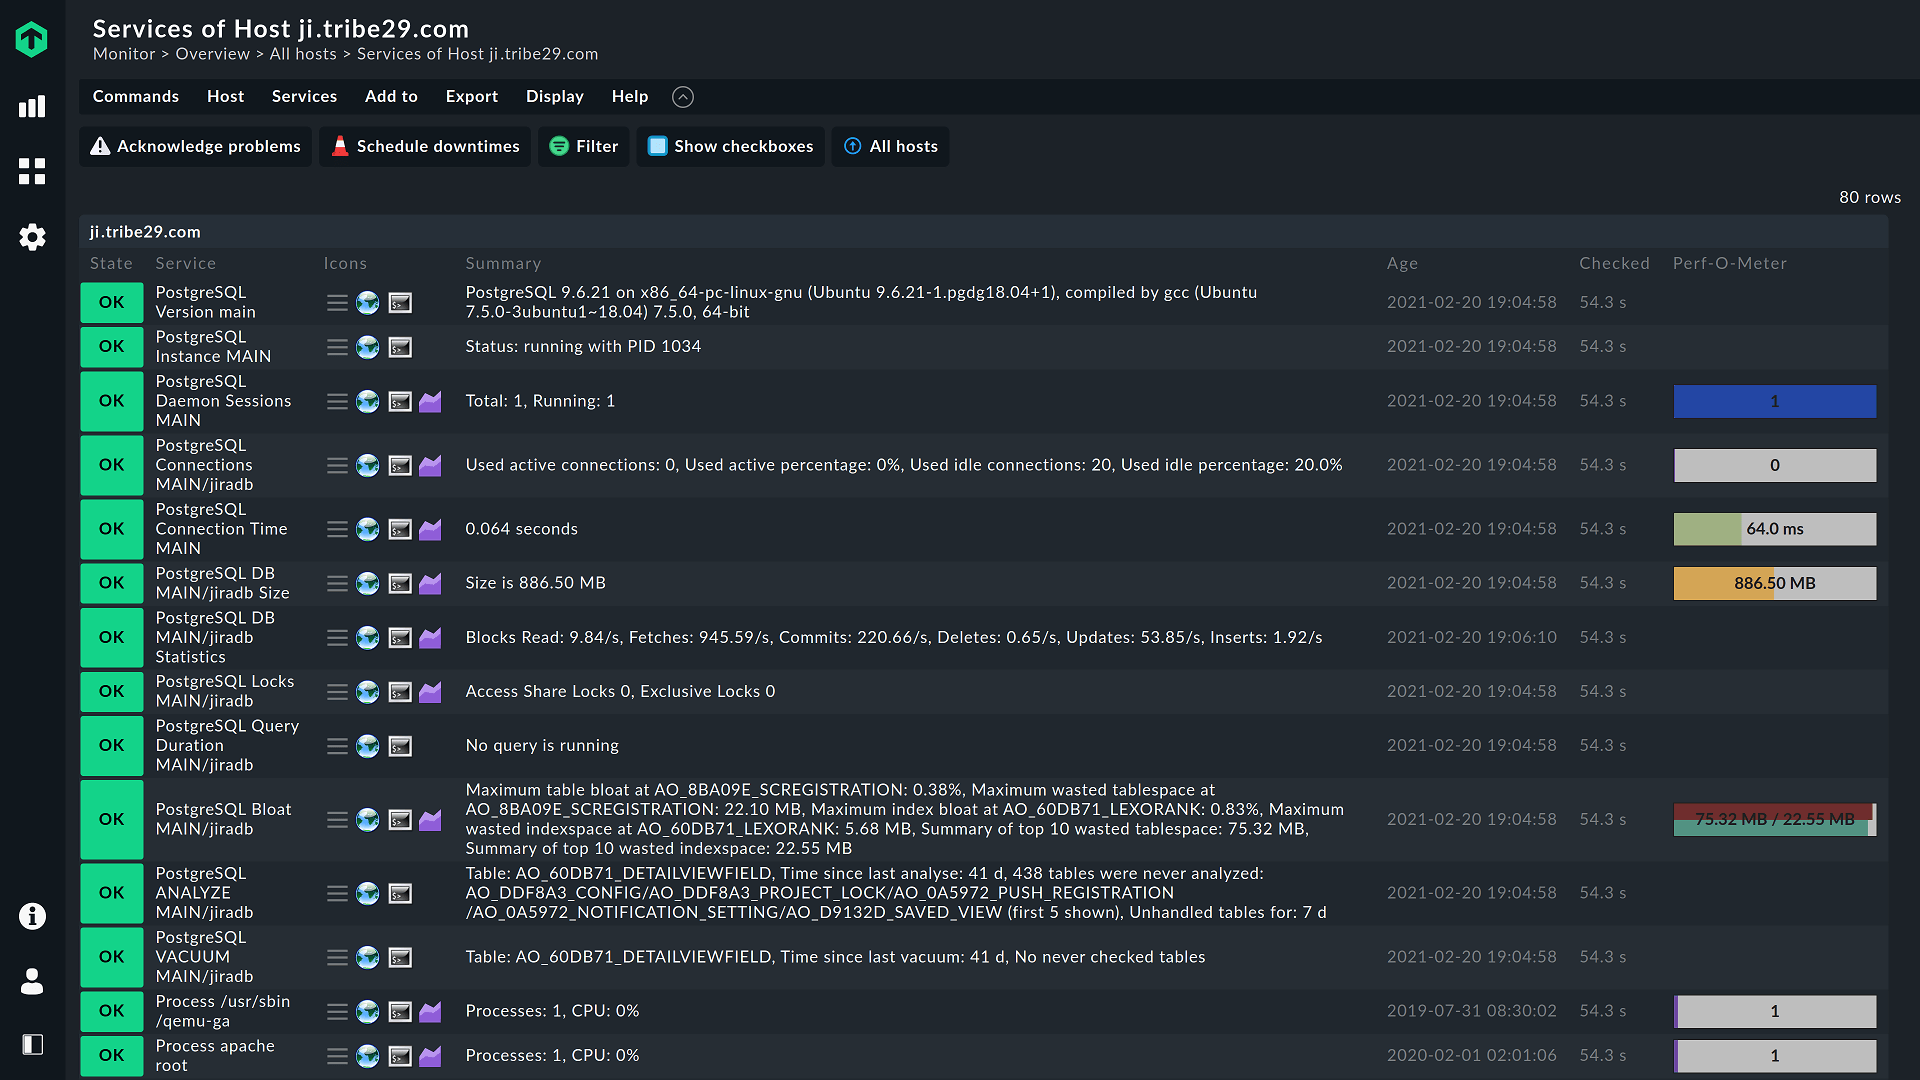
With Checkmk, collecting data is very easy thanks to the existing monitoring plug-ins. The integrations available for Microsoft SQL, Oracle Database, PostgreSQL, MariaDB or IBM DB2, for example, supplement the data from the Checkmk agents, so that with just a few clicks you can set up a comprehensive monitoring of your SQL servers. All of the necessary plug-ins can be accessed via Checkmk's graphical user interface and likewise installed with just a few clicks.
Checkmk works particularly efficiently in monitoring SQL servers and it scales well. Swisscom uses Checkmk to monitor huge Oracle databases with several thousand services per host without any problems thanks to Checkmk's good scalability.
You can also monitor databases in the cloud with Checkmk – you can easily monitor AWS RDS for example. Monitoring integrations in NoSQL databases such as Redis, MongoDB or Couchbase are also available. This allows you to monitor not only different manufacturers, but also different database technologies in a uniform manner. In any case, you always have an optimal data basis and can quickly eliminate problems.
Checkmk is also suitable for cross-team use and provides database administrators with easy access to the DevOps world thanks to its deep Prometheus integration. At the same time, developers also benefit from the data from Checkmk and can monitor the interactions of databases and applications
