Monitoring with SNMP: Troubleshooting in God Mode
 on Jul 14, 2020
Note: The content on this page uses the former names of Checkmk editions. Checkmk Enterprise is now Checkmk Pro.
Network monitoring with SNMP does not always work smoothly. This is often due to the fact that many manufacturers implement the SNMP protocol rather poorly in their devices. In our last blog post we have already pointed out the problems this can cause for monitoring. Possible signs of problems could be that the Check_MK service has the status CRIT, you get a timeout during inventory, or Checkmk services that should be present are not detected.
In this article we will look at troubleshooting typical SNMP problems – in what is known as the 'God Mode'. However, this also means that you need to be especially careful – with great power comes great responsibility. If implemented incorrectly, this will not solve the problem, but may even lead to a complete shutdown of your monitoring, or cause dangerous bugs in the devices you want to monitor. We will assume for this article that you already have a sound knowledge of Checkmk – therefore we will not explain the function of the cmk command here. A detailed explanation can be found in the documentation.
Important: When debugging, always limit the settings and commands only to the affected device. All rules and configurations listed below should ONLY be applied to the affected hosts, and with care.
The blog post is structured as follows:
TL;DR:
The article explains how to debug common SNMP issues in Checkmk using the so-called “God Mode,” which provides deep access to SNMP mechanisms. However, extreme caution is required, as incorrect settings can disrupt monitoring or even cause device malfunctions.
- The article is intended for experienced Checkmk users; basic familiarity with commands such as
cmkis assumed. - All debugging steps must be performed only on the affected host — never applied globally.
- The article covers the following topics:
- Using the
cmkcommand as a foundation for debugging - Differences between Inline SNMP and net-snmp
- Optimizing the bulk size for SNMP queries
- The impact of timing parameters and timeouts
- Gradually slowing down queries to stabilize faulty devices
- Disabling Inline SNMP as a possible solution
- Using the
Debugging basics: the ‘cmk’ command
We assume that the cmk command is familiar. Combining it with the Unix ‘time‘ command is great for troubleshooting. We will use this combination to detect various runtime problems. For example, we can use the command time cmk -Iv HOSTNAME to determine the total runtime for the discovery phase of a host:
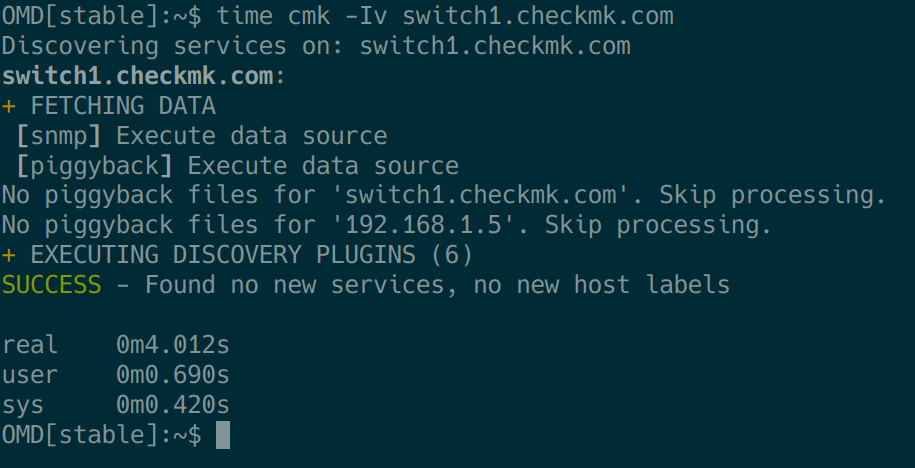
Similarly, it is possible to use time cmk -nv HOSTNAME to check the execution time for querying the discovered services.
You can get even more detailed information by using two ‘v’s, for example cmk -Ivv HOSTNAME or cmk -nvv HOSTNAME. In this way you can, among other things, view the OIDs that have just been queried and thus, for example, identify slow OID ranges that could possibly lead to timeouts.
The total runtime measured in this way for the query (-n) or discovery (-I/II) should be well below 60 seconds for several reasons. After all, the standard timeout of the service ’Check_MK’ is 60 seconds and would have therefore to be increased, together with a suitable check interval for long-running requests. Another negative effect is that a long-running request will also block a helper process for this period.
Caution: The command cmk -II on the CLI corresponds to the ‘Tabula rasa‘ in the GUI. This means that using it is not completely harmless. You should therefore always specify the concrete HOSTNAME with this command, otherwise a tabula rasa will be executed on the entire site! (cmk -IIvv switch1.checkmk.com and not cmk -IIvv).
Also keep in mind that the commands always refer only to the responsible local site of a distributed monitoring. You must therefore execute the command on the site on which you are monitoring the host.
Debugging basics: Inline SNMP versus net-snmp
Checkmk is using inline SNMP since version 1.4. This means that by default we no longer use the command line tools of the net-snmp package, but instead perform the SNMP query using a Python module. This has the crucial advantage that we no longer have to start and stop a separate net-snmp process for each OID query. Depending on the number of monitored SNMP devices, the use of inline SNMP reduces CPU load by more than 50 percent.
Nowadays, inline SNMP is the standard setting in the vast majority of cases and works reliably with the absolute majority of monitored hosts. However, there are known individual cases where inline SNMP had to be switched off for a single host – but we will go into this in more detail later.
In the context of this article, we will disable inline SNMP for another reason, namely for diagnostic purposes, and only temporarily for the host being analyzed:
With inline SNMP switched off, when using the cmk-Ivv/IIvv/nvv commands, we can see the corresponding net-snmp command and use it for further actions using copy and paste.
For example, with a cmk-Ivv HOSTNAME we get the following output

and can use it to copy the command ‘snmpbulkwalk -Cr10 -v2c -t 1 -c public -m "" -M "" -Cc -OQ -OU -On -Ot 192.168.1.5 .1.3.6.1.2.1.2.2.1.1’, for example, and modify it for further analysis if necessary.
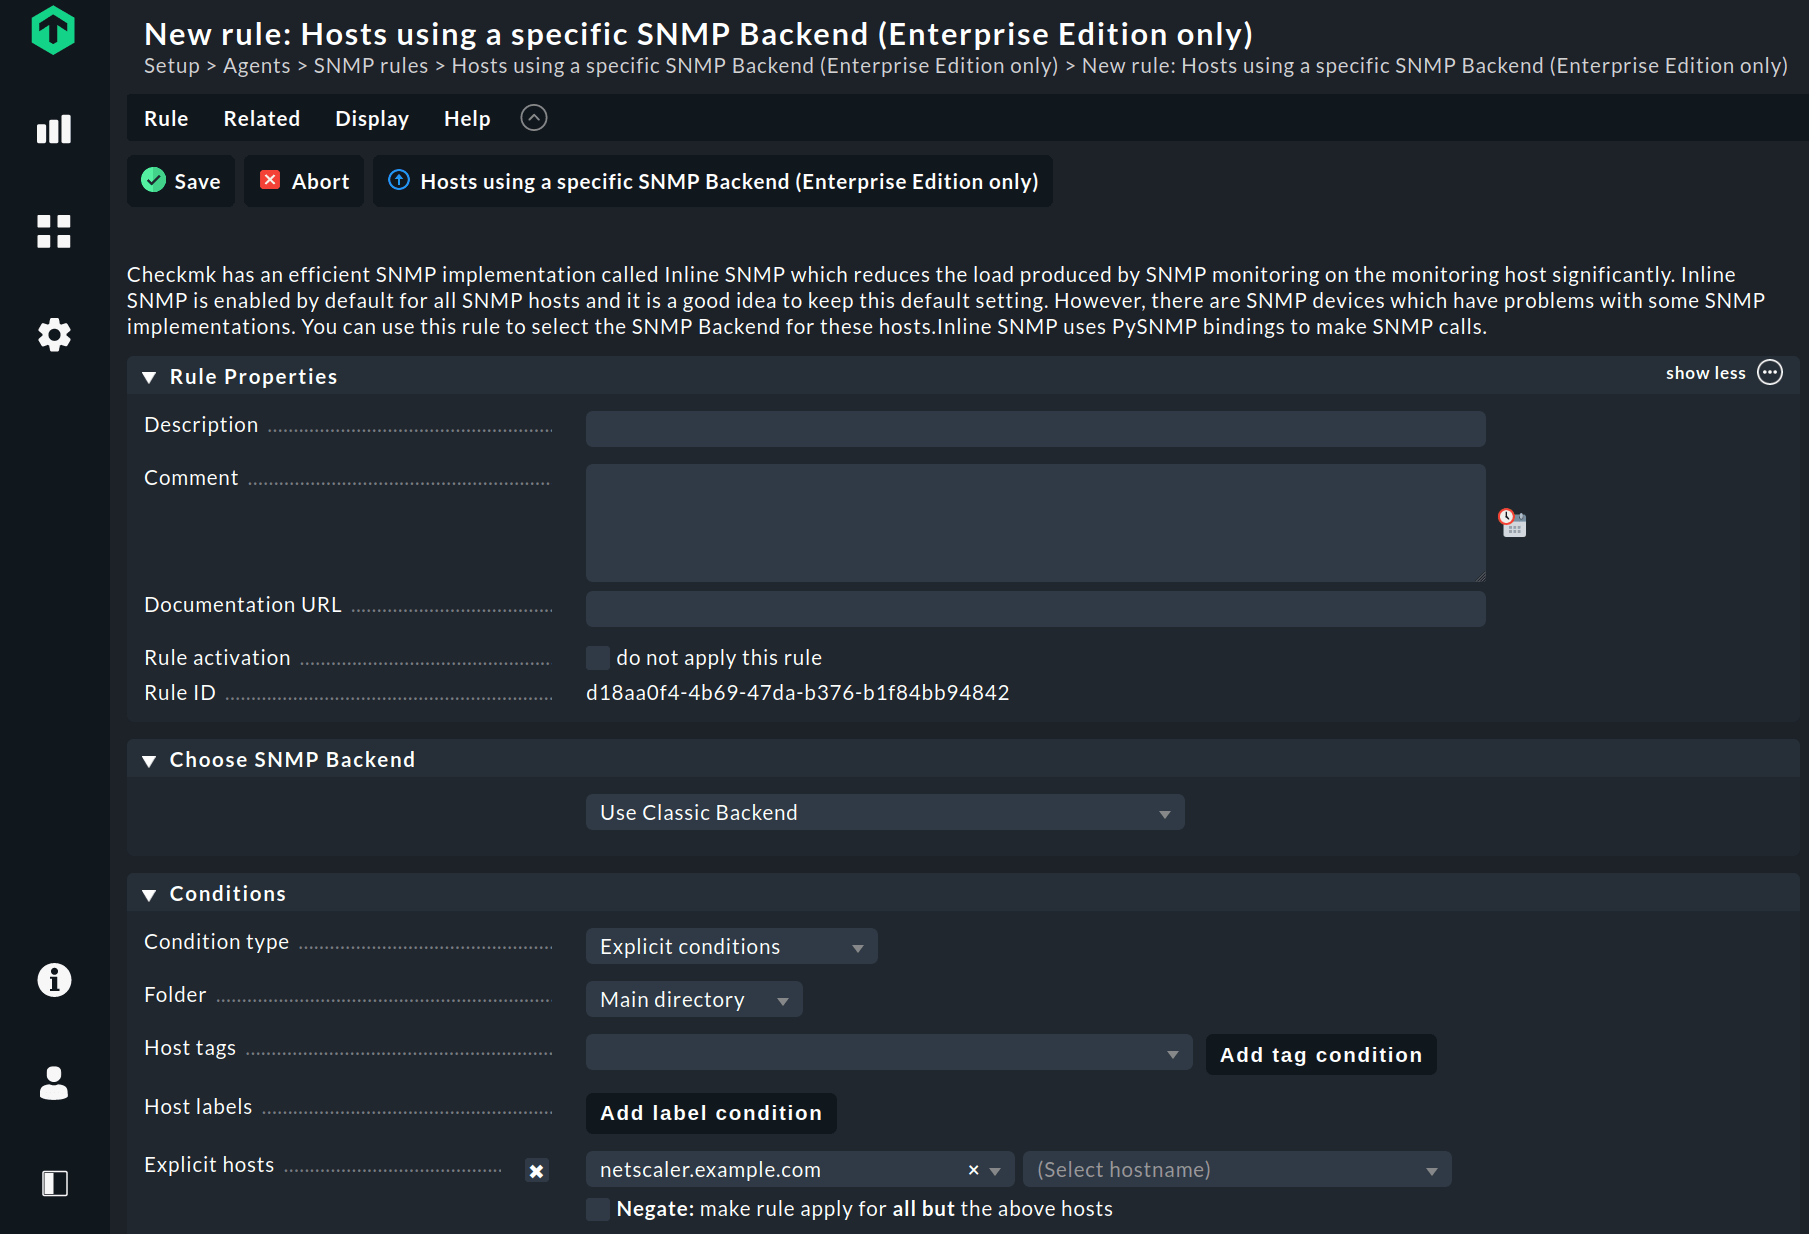
The inline SNMP rule can be accessed via: WATO ➳ Host & Service Parameters ➳ Access to agents ➳ Hosts not using inline SNMP.
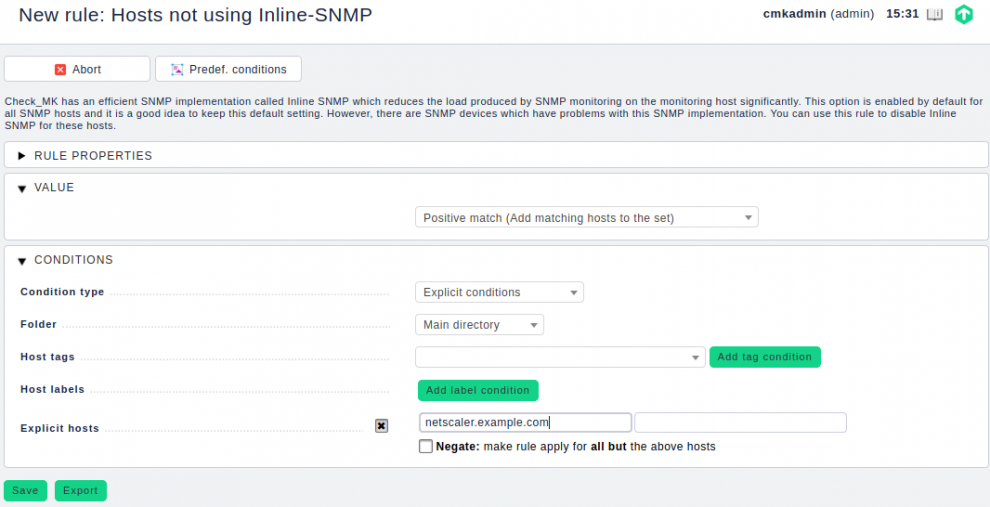
In Checkmk 2.0, you can find the required rule by searching for 'Backend' in the Setup menu. Under SNMP rules you now create the rule Hosts using a specific SNMP Backend (Checkmk Enterprise only). In the rule, add the host under Explicit hosts and select Use Classic Backend under Choose SNMP Backend.
Bulk requests – it’s all a question of size
In our first article on network monitoring with SNMP we explained that SNMPv2c and v3 have the advantage over v1 that you can not only query OIDs individually via snmpget, but can also query entire OID ranges in one go via snmpbulkget or snmpbulkwalk. In Checkmk 10 OIDs are preset as ‘bulk size’ by default. This has the decisive performance advantage that the monitoring instance only has to execute one query instead of ten individual queries to the device. This normally reduces the generated load – both on the monitored system and on the monitoring server itself.
It can always occur that certain devices have problems with the default bulk size of 10, and that the SNMP stack of the device can simply crash at a certain point when querying with a bulk size larger than, for example, 8. As a result, the query will be incomplete and services can no longer be discovered or queried.
However, it can also happen that the total run time of an SNMP query is very long and, for example, querying of a larger switch comes close to the standard timeout of 60 seconds or even exceeds it. In this case it may be useful to increase the bulk size significantly – for example to 60 – but increasing the bulk size, although it is more efficient, can actually have the opposite effect and increase the total run time. As you can see, you are moving in a minefield here. Speaking of minefields – we have already experienced that a core switch crashes completely and reboots when the bulk size is too large!
Important: We can’t suggest a general bulk size that definitely works. As is often the case, this depends on the respective device. Therefore a certain amount ‘fiddling’ is necessary. In other words, play around with the values until the problem no longer occurs, and so that ideally the query does not increase the total run time.
So to get closer to the problem, we go to the command line as described in the section Debugging Basics: the cmk command. First of all we should look at what is found using cmk -IIv HOSTNAME:
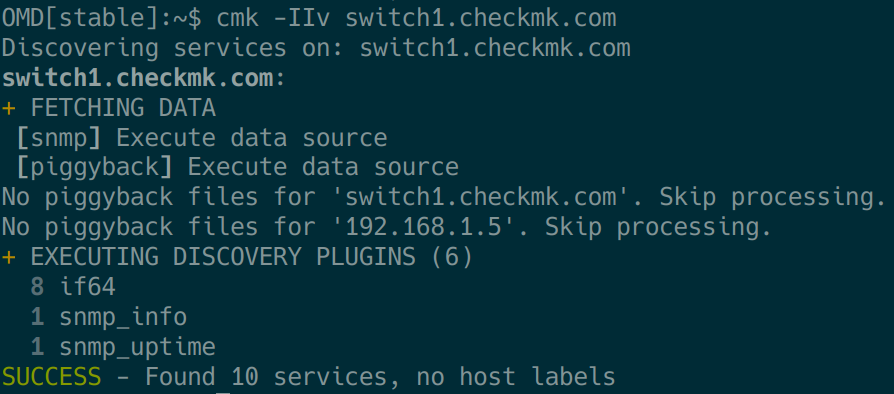
If errors occur here, with a second ‘v’ we can now switch with the command cmk -IIvv to an even more talkative mode and – as you can see in the above video – detect slow or non-appearing OIDs.
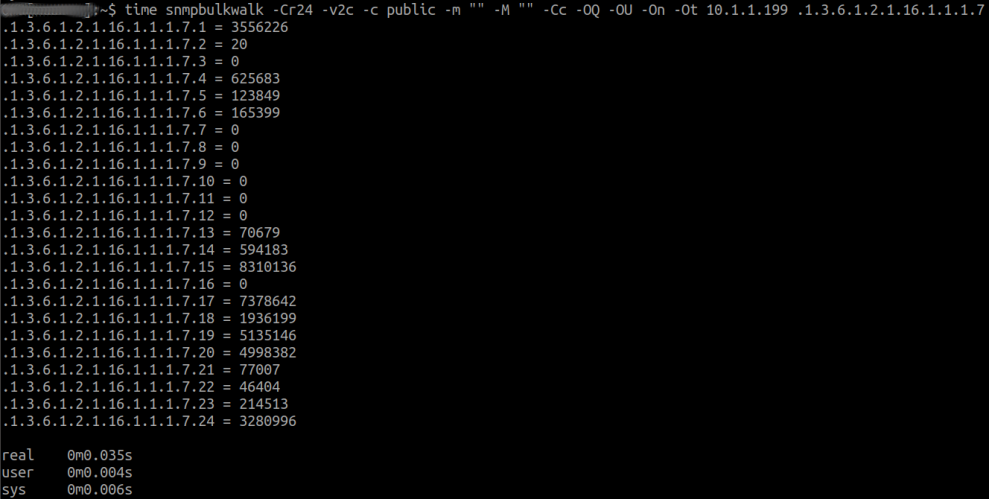
A possible reason can be the bulk size as mentioned. So if we have identified a range and disabled inline SNMP, as explained in the section Debugging Basics: Inline SNMP vs. net-snmp, we can specifically analyze the affected OID or OID range and manipulate the bulk size (-Cr10) with smaller or larger values until we find the ideal value. For a bulk size of -Cr24, for example, the result looks like this:
Once we have worked out a working parameter combination, we need to store it in the WATO rules. For this we need the rule Bulk walk: Number of OIDs per bulk under Host & Service Parameters ➳ Access to Agents. Here you can adjust the bulk size now be adjusted:
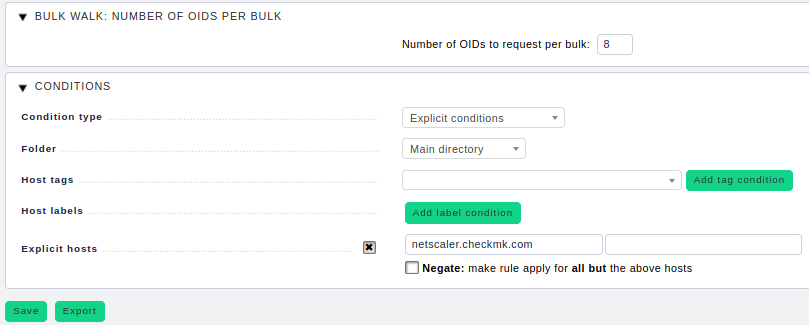
Again here: if you create this rule it must only apply to the affected host(s). Never apply it to the overall monitoring!
After creating this rule and activating the configuration, we again have to check with the corresponding cmk commands whether the changes made now lead to the desired result, i.e. whether the missing services can now be queried.
Timing is everything
Apart from this, it regularly happens that a complete SNMP stack reacts very slowly, or only individual OID areas react at all. For example, the temperature sensors in Cisco SFPs – which can be queried with the check cisco_temperature.dom – are notorious for this. Sometimes the query of these OIDs takes considerably longer than one second per OID (depending on the device, even up to seven seconds). By default, however, Checkmk is set to have a timeout per OID of one second with inline SNMP enabled or also disabled. By the way, a timeout of one second with five retries is also the default setting of the net-snmp package.
The result of course is that such slow OIDs significantly increase the total SNMP query time: 1(s) * 5(Retries) * x Sensors.
For example, with 120 sensors and a bulk size of 10 we already have a total runtime of about 60(!) seconds – without even being able to discover the temperature sensors at all, since we ran into a timeout. In this example we even reach the default timeout of the Check_MK service itself, so we run into an overall timeout. The result is that we either can no longer ‘discover’ anything, or services that have already been discovered become ‘stale’. (This is a very theoretical example as an illustration – in practice much more complexity is possible).
We can now of course use the snmpbulkwalk commands and approach the timeout values with the timeout switch (-t). This allows you to create the rule Timing settings for SNMP access with the appropriate values under WATO ➳ Host & Service Parameters ➳ Access to Agents.
However, you should keep the following things in mind:
- The values apply per OID or per OID range in the case of
snmpbulkget. - The problem is multiplied by: x seconds timeout * number of affected OIDs * retries set.
- How do the above settings affect the total runtime?
- Will I possibly reach the total timeout?
- Can the monitoring instance still check every minute? Note: Check_MK/Check_MK Discovery Timeout ≤ Check Interval
- How many Checkmk Helpers do I block with this? Each affected device blocks a helper during a slow check.
Considering all these aspects, is it maybe sometimes more sensible to live without these slow OIDs or checks?
Take it slowly...
You can get to the required timing settings by modifying the -t parameter from the above example command and set it to seven (-t 7) seconds:
’snmpbulkwalk -Cr10 -v2c -t 7 -c public -m "" -M "" -Cc -OQ -OU -On -Ot 192.168.1.5 .1.3.6.1.2.1.2.2.1.1’
If in this way you have determined a timeout value that allows the above-mentioned SFP temperature sensors to be read reliably, add an additional second for safety’s sake. The Timing settings for SNMP access rule required for this can be configured via WATO ➳ Host & Service Parameters ➳ Access to Agents.
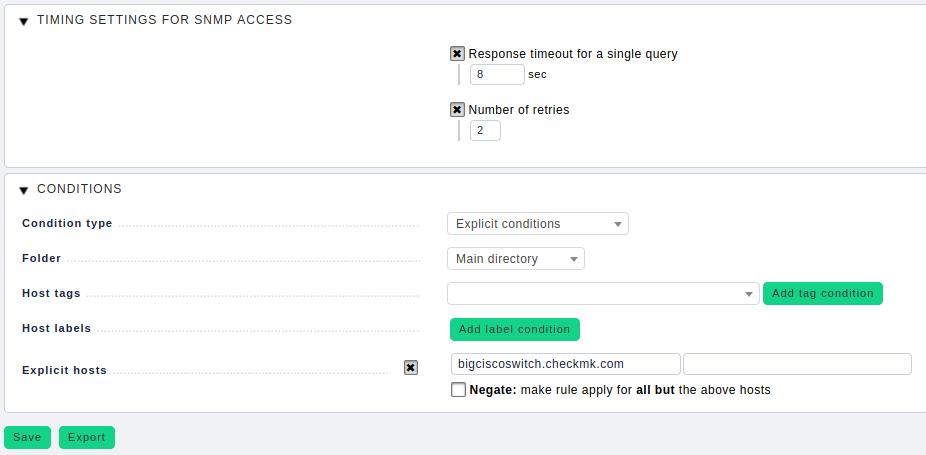
Again important here: This rule may only be applied to the affected hosts and never to the entire monitoring! It can happen that SNMP implementations do not signal ‘NO SUCH OID’ at the end of an OID branch, but simply do not respond at all. This is a clear protocol violation on the part of the manufacturer and, in combination with long timeouts, leads to such queries suddenly taking ages, and, unnecessarily leading to total timeouts. In other words: We wait far too long for something to come, and are unaware that in fact nothing will come.
The same principle applies to the retry rate. It is unlikely that nine times there is no answer, but the tenth request is suddenly answered. Therefore, you should choose a small number of retries and limit the number of attempts to two or three, for example. Better a quick end by a timeout than timeouts without end...
... even slower...
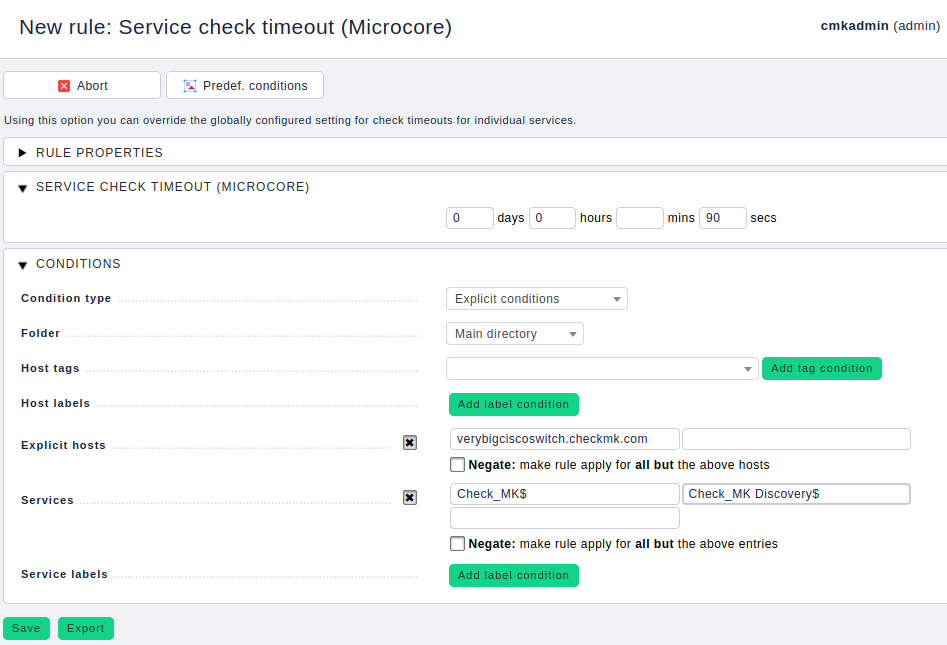
If we have managed to make the information queryable with the above settings – great! It becomes however problematic, if we approach or even exceed the total timeout of 60 seconds. In this case we have to adjust the total timeout for the relevant services. We can do this using the following rule: WATO ➳ Host & Service Parameters ➳ Monitoring Configuration ➳ Service check timeout (Microcore).
Increase the service check timeout and restrict this rule by setting the Services Condition to Check_MK$ and Check_MK Discovery$.
As already mentioned, you have to set the check interval appropriately – at about two minutes (timeout ≤ interval). Otherwise the services will be ‘stale’, because they can only be checked later than actually intended by the configuration. Go to WATO ➳ Host & Service Parameters ➳ Monitoring Configuration ➳ Normal check interval for service checks.
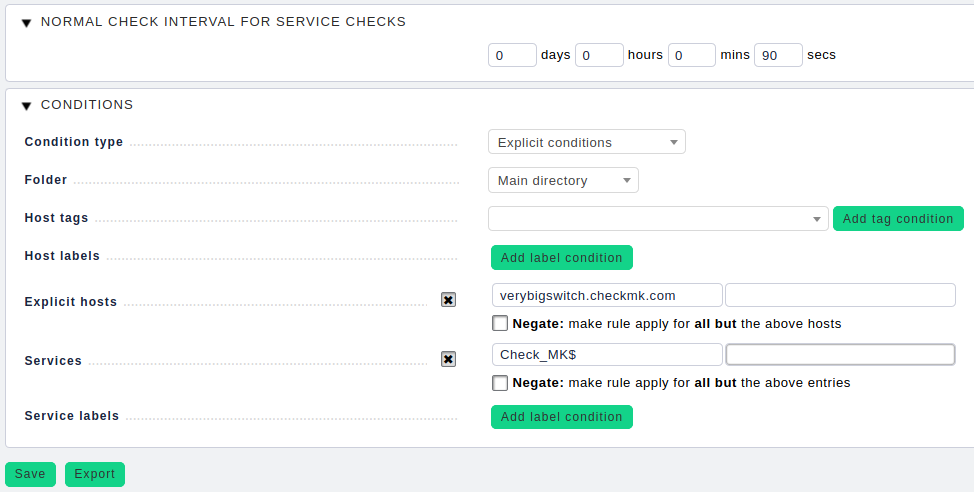
It is important that this rule only applies to the Check_MK service and not to Check_MK Discovery or Check_MK HW/SW Inventory. The latter have a standard check interval of two or 24 hours, respectively, and would generate a considerable load if they were to run with a two-minute interval. Therefore you have to use the expression Check_MK$ in the Services Condition.
Important: ‘$’ is the regular expression (Regexp) for string end. This means that the search pattern only matches Check_MK. This ensures that the rule is not applied to Check_MK-Discovery or Check_MK HW/SW Inventory as it would be the case with the search pattern Check_MK (without ‘$’ – Infix Search).
Again relevant here: When you create these rules, they must only apply to the affected host or hosts. Never apply them to the overall monitoring!
... oh, now it’s too slow!
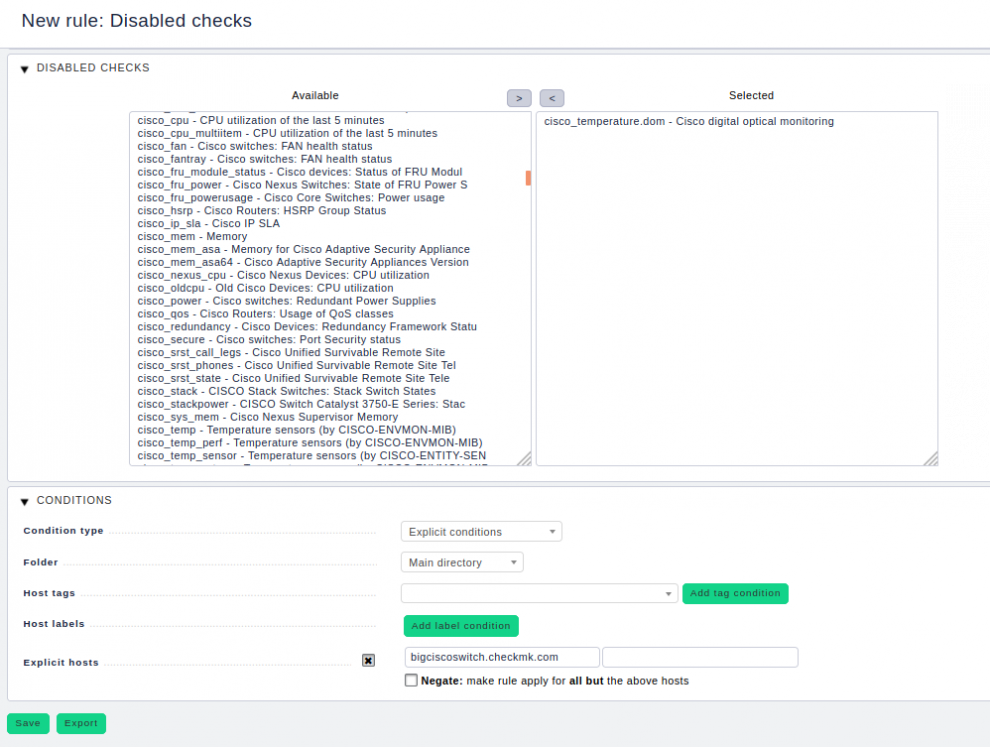
But if you now come to the conclusion that you would rather poll the switch more often than every two, or even only every ten minutes, and that the slow temperature sensors seem rather unnecessary to you – then you can deactivate the corresponding check. This is sometimes the better choice. The necessary rule can be found below: WATO ➳ Host & Service Parameters ➳ Monitoring Configuration ➳ Disabled checks.
You already know that this author does not like to repeat himself, but it has to be done: When you create these rules, they must only apply to the host or hosts in question. Never apply them to the overall monitoring! The only exception: You do not want to see the services on any of your devices – even though they might be responding fast in exceptional cases.
At this point, we would also like to briefly point out that deactivating individual services using a rule of the ‘Disabled Services’ type is not an effective alternative for this use case. As long as only one sensor is queried, the entire check is executed, also due to the bulk size.
Switching off inline SNMP as a solution
Last but not least, in some cases it may be necessary to turn off inline SNMP for certain hosts. For example, we had the case where a device reliably and stoically filled the SNMP sequence number that should actually be counted up with each response with a 1. This is another clear RFC violation, and the Python SNMP module consistently rejected these packets. However, the command line tools of the net-snmp package did not have an issue with this, so we were able to help the customer by providing a – you have already guessed – granular rule for this one host. More sustainable – but less fun – would of course be a ticket for the hardware manufacturer.
Conclusion
As we have seen, the ‘S’ in SNMP stands for ‘simple’, but this only applies if the manufacturer has implemented all RFCs properly and cleanly. If not, it quickly becomes arbitrarily complicated with numerous, sometimes interlocking or even unexpectedly counterproductive settings. And we haven’t even touched on SNMPv3 contexts and similar exciting things in this article. Nevertheless, we hope that this troubleshooting has helped you to identify and fix possible SNMP problems in your monitoring environment.
In the next and last part of our series Network Monitoring with SNMP we want to take a look at the future development of SNMP monitoring and discuss possible successors. Or will SNMP continue to please us for the next 30 years?
